Low IgE and absence of sensitization in non-T2 asthma: a transcriptomic and cytokine study
Jyh-Hong Lee, Yu-Tsan Lin, Li-Chieh Wang, Hsin-Hui Yu, Ya-Chiao Hu, Yao-Hsu Yang, Bor-Luen Chiang

TL;DR
This study identifies distinct biological mechanisms in non-T2 asthma, explaining low IgE levels and lack of allergic sensitization through suppressed immune pathways.
Contribution
The study reveals novel gene and cytokine patterns in non-T2 asthma, linking suppressed pathways to low IgE and no sensitization.
Findings
Non-T2 asthma shows inhibited FcϵRI and BCR signaling pathways, reducing allergic responses.
Reduced IL-4 and IL-9, but increased IL-2, suggest altered immune cell activity in non-T2 asthma.
Downregulated IGHV, IGKV, and IGLV genes may impair IgE stability and antigen binding in non-T2 asthma.
Abstract
Asthma exhibits heterogeneity, including type 2 (T2-high) and non-T2 phenotypes. This study aimed to elucidate the inflammatory mechanisms that drive non-type 2 asthma, a subtype characterized by low immunoglobulin E levels and negative allergic sensitization. This context considers the complex processes of allergic sensitization. We performed gene expression analysis in non-T2 (n = 11) versus T2-high (n = 17) pediatric patients using public datasets GSE145505 for comparison (non-atopic and high-atopic datasets). We applied Ingenuity Pathway Analysis (IPA) to identify canonical pathways. We used the Database for Annotation, Visualization, and Integrated Discovery (DAVID) for functional annotation. We examined the Reactome pathway activities, focusing on differential genes related to high-affinity immunoglobulin E receptor (FcϵRI) signaling and B-cell receptor (BCR) signaling. We…
Genes, proteins, chemicals, diseases, species, mutations and cell lines named across the full text — each resolved to its canonical identifier and authoritative record.
Click any figure to enlarge with its caption.
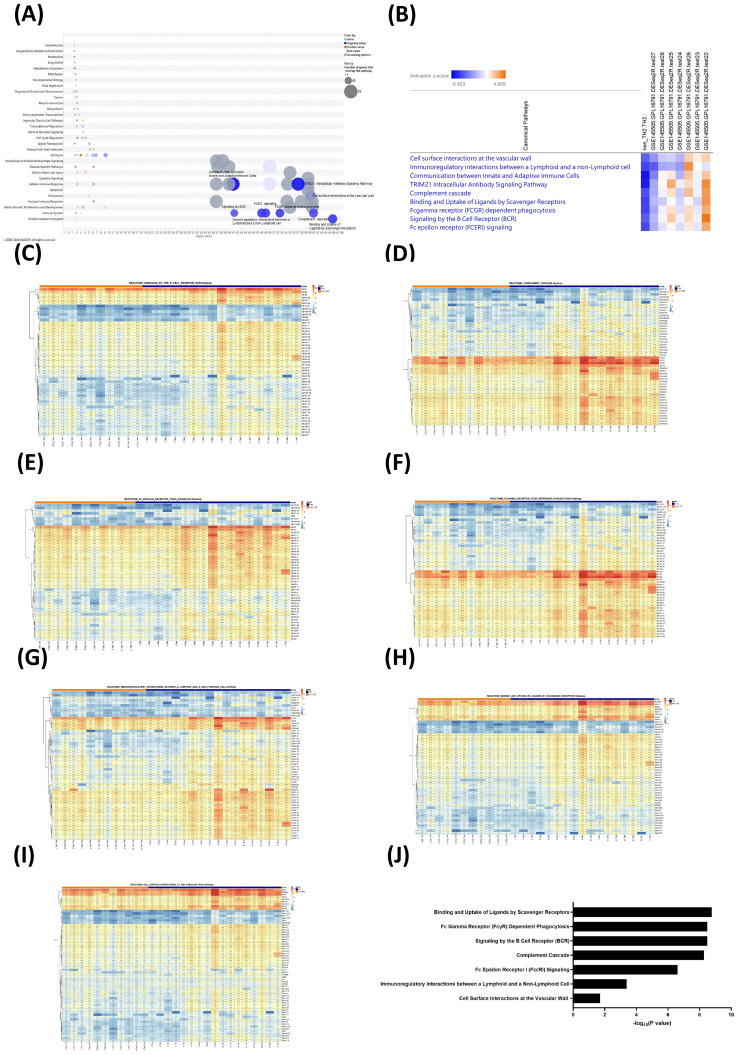 Figure 1
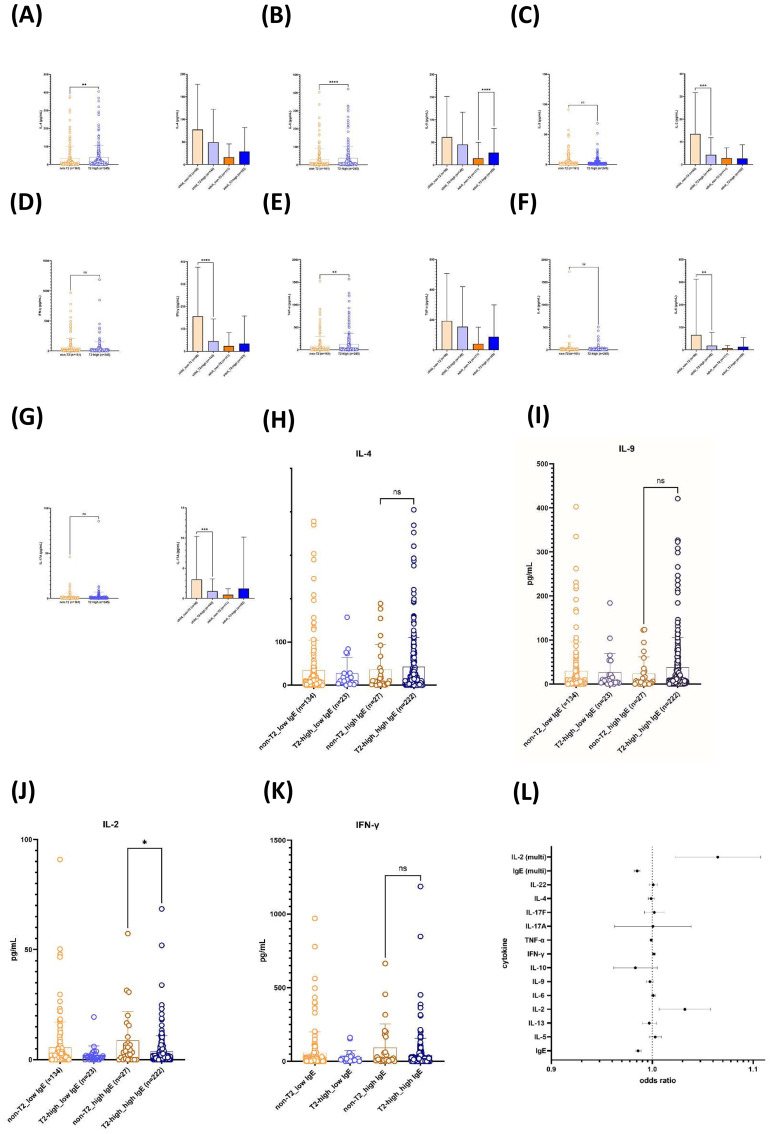 Figure 2
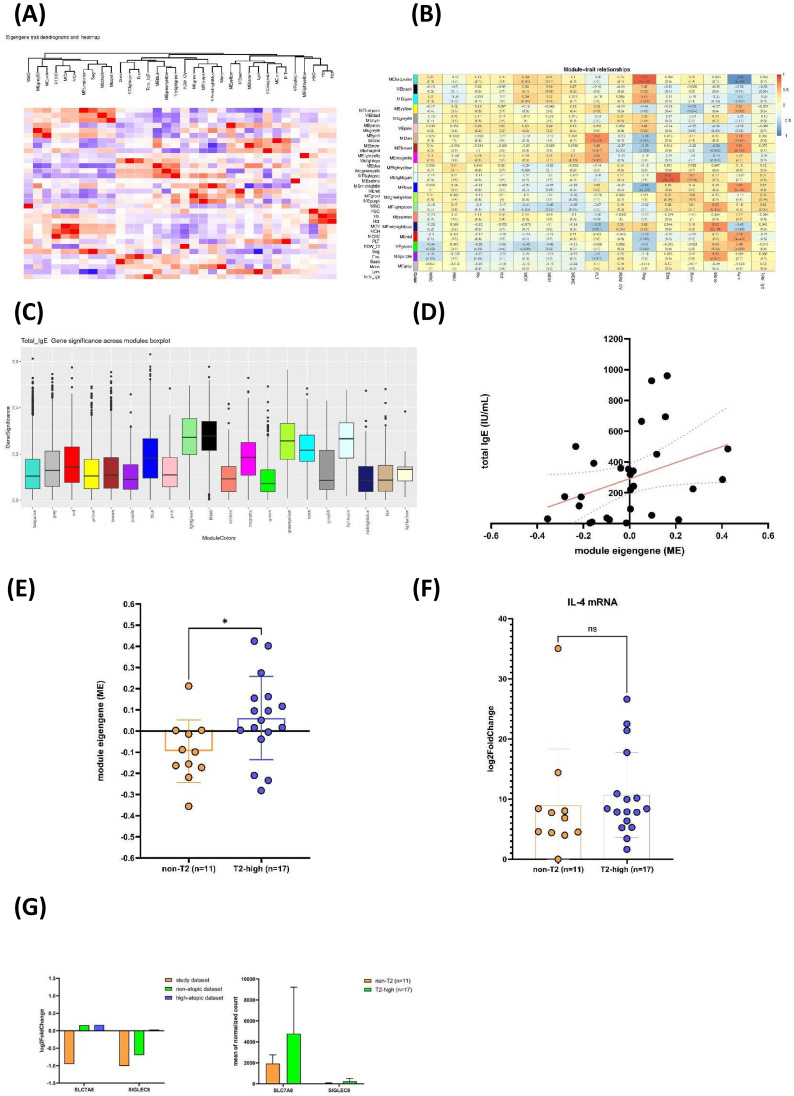 Figure 3
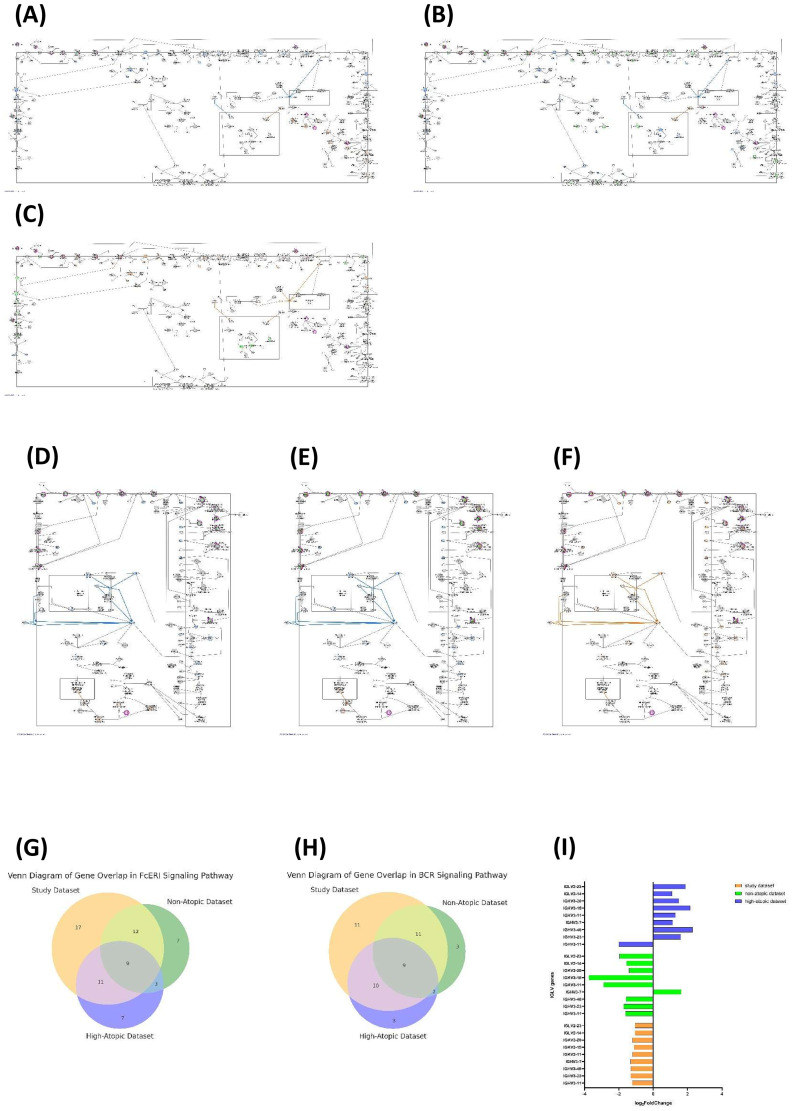 Figure 4
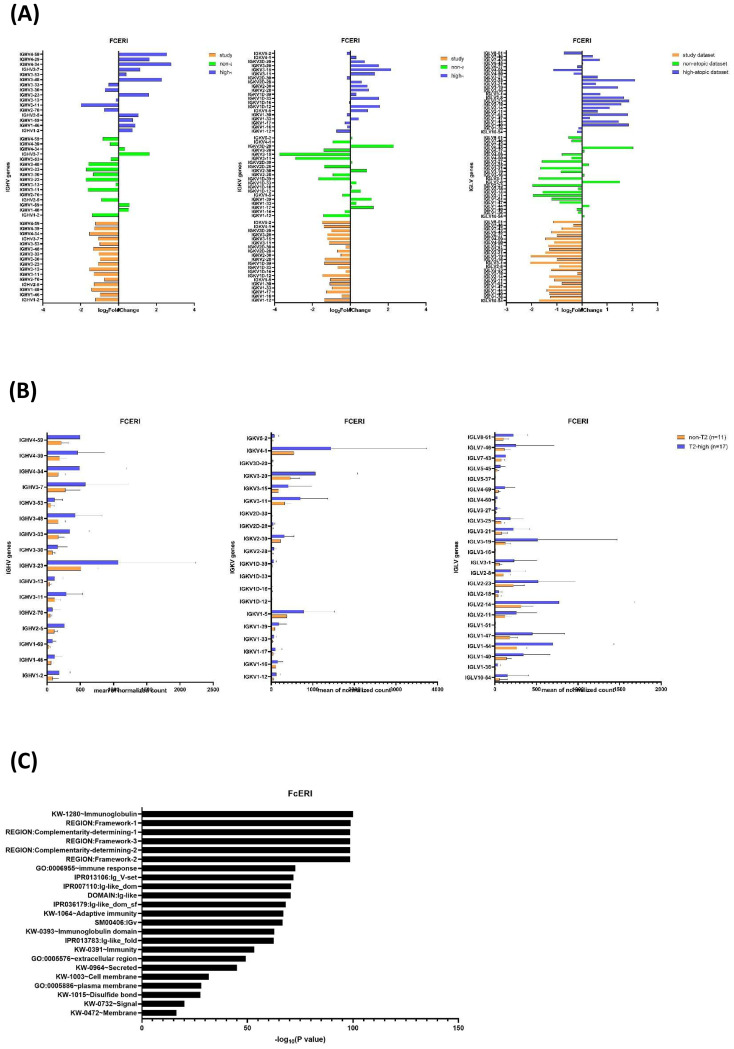 Figure 5
| Characteristic | Non-T2 asthma (n = 11) | T2-high asthma (n = 17) |
|---|---|---|
| Age at enrollment: | 10.72 ± 5.24 | 9.86 ± 5.84 |
| F:M (ratio) | 6:5 | 8:9 |
| Total serum IgE (IU/mL; mean ± SD) | 41.12 ± 32.57 | 405.84 ± 252.12 |
| Peripheral blood eosinophil (%; mean ± SD) (range) | 2.01 ± 1.78 | 4.14 ± 3.22 |
| Sensitization rate (%) | ||
| Dust mites | 0 | 100.00 |
| Dander | 0 | 55.60 |
| Molds | 0 | 22.20 |
| Grass | 0 | 22.20 |
| Foods | 0 | 5.60 |
| Cockroach | 0 | 0 |
| Latex | 0 | 0 |
| Canonical pathways | Study dataset | Non-atopy (non-atopic dataset) | Transient wheeze, low atopy | Low wheeze, low atopy | Low wheeze, high atopy | Medium wheeze, low atopy | High wheeze, high atopy, low lung function | High wheeze, high atopy (high-atopic dataset) |
|---|---|---|---|---|---|---|---|---|
| Cell surface interactions at the vascular wall | −5.96 | −4.025 | −1.961 | −1.723 | −2.722 | 1.606 | 0.557 | 1.508 |
| Immunoregulatory interactions between a lymphoid and a non-lymphoid cell | −7 | −6.119 | −3.286 | −3 | −3.841 | 3.569 | 0 | −1.033 |
| Communication between innate and adaptive immune cells | −8.718 | −4.714 | 0.302 | 0.742 | −2.832 | 1.961 | −0.539 | 1.896 |
| TRIM21 intracellular antibody signaling pathway | −8.488 | −3.244 | 0.164 | 2.692 | −0.686 | 1.279 | −0.577 | 3.795 |
| Complement cascade | −6.505 | −3.124 | −0.557 | 1.043 | −1.89 | 2.183 | −0.6 | 3.286 |
| Binding and uptake of ligands by scavenger receptors | −7.071 | −2.596 | −1.89 | 0.146 | −1.569 | 0.277 | −1.569 | 3.528 |
| Fc gamma receptor (FCGR) dependent phagocytosis | −6.928 | −3.286 | −0.655 | 1.067 | −1.225 | 1.155 | −0.943 | 2.785 |
| Signaling by the B-cell receptor (BCR) | −6.091 | −2.6 | −0.426 | 1.768 | −0.471 | 1.265 | −0.535 | 4.491 |
| Fc epsilon receptor (FcϵRI) signaling | −6.856 | −3.024 | −1.091 | 0.302 | −1.279 | 0.707 | −1 | 2.785 |
| ID | Gene set size | Normalized enrichment score (NES) | False discovery rate (FDR) | |
|---|---|---|---|---|
| REACTOME_BINDING_AND_UPTAKE_OF_LIGANDS_BY_SCAVENGER_RECEPTORS | 80 | −3.10892 | 0.025274083 | 0.002237136 |
| REACTOME_FCGAMMA_RECEPTOR_FCGR_DEPENDENT_PHAGOCYTOSIS | 138 | −3.10805 | 0.025274083 | 0.002212389 |
| REACTOME_SIGNALING_BY_THE_B_CELL_RECEPTOR_BCR | 163 | −2.99441 | 0.025274083 | 0.002325581 |
| REACTOME_COMPLEMENT_CASCADE | 89 | −2.9776 | 0.025676721 | 0.002336449 |
| REACTOME_FC_EPSILON_RECEPTOR_FCERI_SIGNALING | 182 | −2.89675 | 0.025274083 | 0.002320186 |
| REACTOME_IMMUNOREGULATORY_INTERACTIONS_BETWEEN_A_LYMPHOID_AND_A_NON_LYMPHOID_CELL | 172 | −2.86861 | 0.025274083 | 0.002314815 |
| REACTOME_CELL_SURFACE_INTERACTIONS_AT_THE_VASCULAR_WALL | 166 | −2.58274 | 0.025274083 | 0.002298851 |
Peer Reviews
No public reviews on file for this paper yet. If you reviewed it on a platform where reviews are public (OpenReview, ICLR, NeurIPS, ICML), you can paste yours below so the community can read it here.
Videos
No videos yet. Explain this paper in a talk, walkthrough, or lecture? Add one.
Taxonomy
TopicsAsthma and respiratory diseases · IL-33, ST2, and ILC Pathways · Bioinformatics and Genomic Networks
Introduction
1
Asthma is a complex, chronic inflammatory disease characterized by epithelial shedding, airway smooth muscle hypertrophy and hyperplasia, overproduction of mucus, and airway inflammation (1). The pathophysiology of asthma has been attributed to an inflammatory process that occurs predominantly in the large airways through the accumulation of eosinophils and CD4^+^ T lymphocytes in the submucosa, mucous-gland hyperplasia, thickening of the subepithelial collagen layer, submucosal matrix deposition, mast cell degranulation, and hypertrophy and hyperplasia of the airway smooth muscle (2). Chronic inflammation in asthma typically involves an increase in the number of activated CD4^+^ T cells, predominantly T helper 2 (Th2) cells. Th2 cells secrete cytokines [interleukin (IL)-4, IL-5, IL-9, and IL-13] that promote allergic inflammation and stimulate B cells to produce immunoglobulin E (IgE) (2). The clinical phenotypes of asthma have in common the propensity for acute episodes of airway obstruction and wheezing. Treatment options are not always effective and have side effects (3).
The earliest classification of asthma was extrinsic and intrinsic (4). Clinical asthma is divided into allergic (atopic) and non-allergic (non-atopic) asthma (4–6), but this is an oversimplification (2). Classifications of asthma according to phenotype and endotype have been proposed (7, 8). Based on the Th2-driven inflammatory responses, two major asthma endotypes, Th2 (T2-high) and non-Th2 (non-T2 or T2-low), have been described (9–11). T2-high asthma is characterized by upregulated type 2 immune pathways, specifically involving IL-4 and IL-13 gene expression. This subtype is associated with eosinophilic airway inflammation, airflow limitation, and higher levels of allergy, eosinophils, and bronchial hyperreactivity. This subtype is often associated with allergic conditions and positively responds to inhaled corticosteroid (ICS) treatment (12). Non-T2 or T2-low asthma includes patients with low expression of these type 2 gene markers, lacking a link to atopy and typically exhibiting a weaker short-term or refractory response to ICS. This phenotype does not respond as well to corticosteroids or T2-targeted biologics, indicating a need for alternative treatment approaches (10).
Clinical features and biomarkers that can be used to differentiate between non-T2 and T2-high asthma have been proposed, including an IgE threshold of 100 IU/mL and reactivity of both skin prick test (SPT) and radioallergosorbent test (RAST) (13). Non-T2 individuals generally have normal or low serum levels of total IgE (6, 10, 11, 14–16). Non-T2 asthma is typically defined as asthma in individuals who show no allergic sensitization, through either skin prick tests or in vitro specific IgE tests, to a panel of local allergens, including perennial allergens. However, the mechanism underlying the molecular endotypes of non-T2 and T2-high asthma associated with low total IgE levels and negative sensitization is unclear. The heterogeneity of non-T2 asthma hampers the identification of suitable biomarkers and therapeutic targets (16).
Allergic sensitization is the joint innate and adaptive immune response to allergens that leads to allergen-specific IgE (sIgE) synthesis (17, 18). The allergen bound to the B-cell receptor (BCR) is internalized, processed, and presented as peptides via MHC class II to T cells. This presentation triggers T-cell receptor (TCR) engagement, leading to the upregulation of CD40L on T cells, which binds to CD40 on B cells, initiating IgE class-switch recombination and IgE production in B cells (18). Plasma cells produce allergen-specific IgE that binds to FcϵRI on mast cells (MCs) and basophils. MCs are distributed throughout the body and are key cells of type I hypersensitivity reactions. FcϵRI signaling in mast cells involves a network of signaling molecules and adaptor proteins. However, during desensitization, there is an active turn-off mechanism that reduces the signaling capacity of FcϵRI. The modulation of FcϵRI signaling may modify the allergic response. Disruption of IgE–FcϵRI interactions and FcϵRI desensitization are potential therapeutic strategies (19).
We previously reported that the downregulation of immunoglobulin genes influencing FcϵRI signaling and elevated Th1 and Th17 cytokines may affect the IgE-linked sensitization associated with a non-T2 response (20). In this study, we sought to clarify the mechanisms by which immunoglobulin genes are downregulated in non-T2 asthma and to identify the molecular endotypes and canonical pathways —particularly in genes associated with FcϵRI and BCR signaling—that contribute to low IgE levels and the lack of sensitization in non-T2 asthma.
Methods
2
Asthma patients
2.1
We enrolled asthma children from the Department of Pediatrics, National Taiwan University Hospital (NTUH). Children with clinical features and characteristics suggestive of asthma were diagnosed according to the criteria of the National Asthma Education and Prevention Program Expert Panel Report 3 (EPR-3) (21) and GINA (22) (online supplement). The study was approved by the Institutional Review Board and Research Ethics Committee of the National Taiwan University Hospital (202206025RINC) and adhered to the tenets of good clinical practice and to the principles of the Declaration of Helsinki. Informed consent was obtained from the participants and/or their legal guardians.
Serum levels of total and allergen-specific IgE
2.2
Total IgE levels were measured using the CAP FEIA System (Pharmacia, Uppsala, Sweden) according to the manufacturer’s instructions. The data were calibrated using the World Health Organization standard within the range of 2–5,000 IU/mL. Allergen sensitization was determined using the MAST Optigen test (Hitachi Chemical Diagnostics, Mountain View, CA, USA).
Children were defined as having T2-high asthma when they had a positive allergen-specific IgE level (positive sensitization; allergen-specific IgE > 0.35 IU/mL) in accordance with clinical symptoms (history of cough, recurrent wheezing, recurrent difficulty breathing, and recurrent chest tightness). In contrast, children were defined as having non-T2 asthma when they had no personal or family history of allergic symptoms and in whom allergic sensitization was not identified (via skin prick or in vitro allergen-specific IgE tests with allergen-specific IgE < 0.35 IU/mL) to a panel of local allergens, including dust mites, dander, feathers, molds, grasses/trees, foods, cockroach mix, and latex (20). We enrolled a discovery cohort comprising 11 non-T2 and 17 T2-high asthma patients.
mRNA expression dataset
2.3
mRNA data from peripheral whole blood of non-T2 asthma vs. T2-high asthma using bulk RNA-seq (study dataset) have been described previously (20). We used the publicly available GSE145505 dataset of mRNA expression data (log_2_FC and p-value) was downloaded from the Gene Expression Omnibus (GEO) (BioProject PRJNA607333; series accession GSE145505) (23). Using Ingenuity Pathway Analysis (IPA), we compared the seven gene datasets in GSE145505 with those from our study dataset to identify canonical pathways.
Gene Set Enrichment Analysis
2.4
Gene Set Enrichment Analysis (GSEA) is a computational method used in bioinformatics to determine whether a predefined set of genes shows statistically significant, concordant differences between two biological states (e.g., non-T2 vs. T2-high) (24, 25). We utilized the C2 collection of curated gene sets from the Molecular Signatures Database (MSigDB) (https://www.gsea-msigdb.org/gsea/msigdb/collections.jsp) (online supplement).
Determination of serum levels of cytokines
2.5
From an independent cohort of asthma patients made up of both children (non-T2 asthma, n = 50; T2-high asthma, n = 142) and adults (non-T2 asthma, n = 111; T2-high asthma, n = 103), we collected serum samples to validate whether the cytokine levels are related to children and adults with non-T2 asthma. We conducted simultaneous quantification of IL-2, 4, 5, 6, 9, 10, 13, 17A, 17F, 22, IFN-γ, and TNF-α. We measured these cytokines in serum samples using the Human Th Cytokine Panel (12-plex) with V-bottom Plate V02 (Cat. No. 741028; BioLegend Inc., San Diego, California (CA)). We conducted logistic regression to assess the associations between non-T2 asthma and the serum levels of IgE and 12 cytokines.
We performed univariate logistic regression to evaluate the association of each independent variable, including IgE and cytokines, with non-T2 asthma individually, without adjusting for other variables. Then, we conducted multivariate logistic regression to assess the combined effects of multiple predictors on non-T2 asthma. In one model, we included both the IgE level and the levels of 12 cytokines as continuous variables. In another model, we included IgE as a categorical variable (threshold 100 IU/mL) with the levels of 12 cytokines as continuous variables. We set statistical significance at p < 0.05 and performed the analyses using the SAS software (v. 9.4, SAS Institute, Cary, NC, USA).
Weighted Gene Co-Expression Network Analysis
2.6
Weighted Gene Co-Expression Network Analysis (WGCNA) examines co-expression patterns, revealing functional networks and reducing reliance on arbitrary gene expression thresholds. WGCNA is a systems-level approach for identifying gene modules, offering insight into complex biological processes (26). The R package WGCNA (v. 1.66) was used for co-expression analysis (online supplement).
Ingenuity Pathway Analysis
2.7
We performed Core Analysis with IPA (Qiagen, Redwood City, CA, USA) to identify related biological pathways, upstream regulators, and molecular interactions. We analyzed Reactome pathways to corroborate the findings of the canonical pathway analysis (27). The Reactome Pathway Browser provided an interactive schematic (https://reactome.org/). We performed a comparison analysis of IPA for all datasets (ours and seven GSE145505 datasets). We accessed the canonical pathways of all eight datasets and calculated the z-scores determined via pathway activity analysis. We accessed the Reactome pathway using the IPA platform, where we used purple to highlight genes or nodes included in the dataset analysis results (online supplement).
Functional annotation and pathway enrichment analysis
2.8
To explore the potential biological functions of genes within the selected seven Reactome pathways, we conducted a pathway enrichment analysis using the Database for Annotation, Visualization, and Integrated Discovery (DAVID) (https://david.ncifcrf.gov/). We examined functional annotation charts for all genes included in the selected Reactome pathways.
Results
3
Selection and definition of the mRNA dataset
3.1
To understand the transcriptional differences between non-T2 and T2-high asthma, we conducted a DESeq2 analysis comparing gene expression between the non-T2 (n = 11) vs. T2-high (n = 17) patient groups (Table 1). Initially, we analyzed 44,076 genes. We identified no outliers, with a pre-filter median read count of 20,003 genes. We named this the study dataset. Based on providing a spectrum of severity and phenotypes of GSE145505 datasets, we ranked these seven datasets from the lowest to highest atopy (Table 2). We named the GSE145505.GPL16791.DESeq2R.test27 dataset as the non-atopic dataset, and the GSE145505.GPL16791.DESeq2R.test22 dataset as the high-atopic dataset. Both datasets had pre-filter median read counts of 38,525 genes.
Inhibited reactome pathways in non-T2 asthma identified by IPA core analysis
3.2
We performed canonical pathway analysis to investigate the biological processes distinguishing non-T2 from T2-high asthma. Core Analysis of the study dataset revealed that binding and uptake of ligands by scavenger receptors, complement cascade, cell surface interactions at the vascular wall, TRIM21 intracellular antibody signaling pathway, Fcγ receptor (FCGR)-dependent phagocytosis, Fcϵ receptor (FcϵRI) signaling, immunoregulatory interactions between a lymphoid cell and a non-lymphoid cell, signaling by the BCR, and communication between innate and adaptive immune cells were the top-ranked inhibited canonical pathways (Figure 1A). Seven were Reactome pathways (Table 3); the TRIM21 intracellular antibody signaling pathway and communication between innate and adaptive immune cells were not.
Significance of canonical pathway activity and Reactome pathway enrichment distinguishing non-T2 from T2-high Asthma. (A) Bubble chart illustrates the canonical pathway enrichment analysis of gene dataset derived from RNA-seq of peripheral blood from non-T2 asthma vs. T2-high asthma (study dataset) using Core Analysis of Ingenuity Pathway Analysis (IPA; Qiagen). Each row represents a biological pathway categorized by function, while the x-axis denotes the −log (p-value), indicating the statistical significance of enrichment. Bubble size corresponds to the number of genes overlapping with the pathway, and color indicates the z-score, reflecting pathway activation (orange for positive z-scores) or inhibition (blue for negative z-scores). Gray bubbles signify pathways without a discernible activity pattern. Significant enrichment of pathways is specifically labeled, particularly among highly suppressed pathways (rightmost blue bubbles). (B) Comparative analysis of canonical pathway activity across eight gene datasets (study dataset plus seven gene datasets from GSE145505). The heatmap presents the activation z-scores of key canonical pathways across eight datasets. The color gradient represents pathway activation, ranging from negative z-scores (blue, indicating inhibition) to positive z-scores (orange, indicating activation). The analysis highlights key pathways that show differential activation patterns and exhibit significant variability in activity across datasets. There appears to be a progression from lower (negative) z-scores in the left side (non-T2 or non-atopic) datasets to higher (positive) z-scores in the right side (T2-high or high-atopic) datasets. Signaling by the B-cell receptor (BCR)B-cell receptor (BCR) (C), complement cascade (D), high-affinity immunoglobulin E receptor (FcϵRI) signaling (E), FcγR-dependent phagocytosis (F), immunoregulatory interactions between a lymphoid cell and a non-lymphoid cell (G), binding and uptake of ligands by scavenger receptors (H), and cell surface interactions at the vascular wall (I). Gene Set Enrichment Analysis (GSEA) Reactome gene sets from non-T2 asthma vs. T2-high asthma groups (J). Rows represent individual genes associated with pre-defined GSEA gene set, while columns represent samples within each asthma group. The hierarchical clustering on the left side indicates that the gene expression profiles segregate distinctly between the two groups. Certain distinctive gene clusters (in red rectangle) appear to have the highest variability and differential expression across groups. These clusters may represent key drivers of the pathway’s behavior in each GSEA gene set. Statistical significance was determined with a false discovery rate (FDR) <0.25, with ranked gene lists generated from differential expression analysis. Statistical significance of enrichment [−log (p-value)] for GSEA Reactome pathways distinguishing non-T2 asthma from T2-high asthma groups.
To explore a spectrum of atopy levels, we also performed Core Analysis of the seven GSE145505 datasets. We used hierarchical clustering in the comparison analysis of IPA to group canonical pathways of all eight datasets. The top-ranked canonical pathway identified in the study group was common to all seven GSE145505 datasets (Figure 1B). The activation status (z-score) of these identified pathways exhibited a dose-dependent effect as the degree of atopy progressed from non-atopic to high-atopic (Table 2). The study and non-atopic datasets exhibited predominantly negative z-scores, suggesting widespread pathway inhibition. The middle datasets displayed a mix of activation and inhibition, indicative of a transitional state. The high-atopic datasets showed strong positive z-scores, implying overall pathway activation, with their activity increasing in a dose-dependent manner as atopy increases in severity. These results support the idea that these pathways are linked to the atopic/T2-high phenotype and are suppressed in non-atopic/non-T2 asthma, suggesting that these pathways play a concerted role in determining the degree of atopy.
GSEA reveals distinct pathway enrichment in non-T2 vs. T2-high asthma
3.3
To distinguish between non-T2 and T2-high asthma, GSEA of 11 non-T2 and 17 T2-high patients identified the same seven Reactome pathways identified by IPA (Table 3). The heatmaps reveal that each Reactome pathway displayed a unique expression profile across the two patient groups—non-T2 vs. T2-high—indicating distinct transcriptional states and underlying immune mechanisms for each asthma subtype (Figures 1C–I). The non-Th2-enriched pathways predominantly involve innate immune mechanisms, including complement activation, Fcγ receptor-mediated phagocytosis, and scavenger-receptor pathways (Figure 1J).
Lower Th2 cytokine levels and inverse correlation with total IgE levels in non-T2 asthma confirmed in independent cohort
3.4
To validate the observed transcriptional differences at the protein level, the serum levels of cytokines secreted by Th1, Th2, Th9, Th17, and Th22 cells were determined in the independent cohort of a total of 406 subjects stratified into pediatric and adult (n = 214) cohorts based on age. Within each cohort, patients were further classified into T2-high (n = 192) and non-T2 (n = 161) asthma phenotypes based on their sensitization status. In the pediatric group, 142 patients (74.0%) were classified as T2-high and 50 patients (26.0%) as non-T2. The mean age was comparable between the two groups, with no statistically significant difference observed (T2-high: 9.6 ± 4.4 years vs. non-T2: 8.9 ± 4.1 years; p = 0.34). As expected, total serum IgE levels were markedly elevated in the T2-high group compared to the non-T2 group (650.3 ± 575.0 vs. 85.6 ± 113.0 IU/mL, respectively), representing a statistically significant difference (p < 0.001). In the adult group, 103 patients (48.1%) were classified as T2-high and 111 patients (51.9%) as non-T2. Unlike the pediatric cohort, there was a significant difference in age between the phenotypes; the T2-high adults were significantly younger (36.1 ± 10.9 years) compared to the non-T2 adults (45.0 ± 11.9 years; p < 0.001). Consistent with the pediatric findings, the adult T2-high group exhibited significantly higher total serum IgE levels compared to the non-T2 group (483.3 ± 492.5 vs. 54.0 ± 74.8 IU/mL; p < 0.001).
Next, systemic cytokine profiles were compared between T2-high and non-T2 asthma across the combined pediatric and adult cohorts (Figures 2A–G). When all 406 subjects were analyzed together (non-T2, n = 161; T2-high, n = 245), the serum concentrations of the canonical T2 cytokines IL-4 and IL-9 were significantly lower in the non-T2 group than in T2-high patients (Figures 2A, B; p < 0.05 for both comparisons), whereas TNF-α was also modestly but significantly enriched in T2-high asthma (Figure 2E; p < 0.05). In contrast, the circulating levels of IL-2, IFN-γ, IL-6, and IL-17A did not differ significantly between T2-high and non-T2 asthma when the cohorts were pooled (Figures 2C, D, F, G).
*Serum cytokine profiles differentiate T2-high from non-T2 asthma phenotypes across pediatric and adult cohorts. (A–G) Serum concentrations of key inflammatory cytokines were quantified by multiplex immunoassay in pediatric (n = 192) and adult (n = 214) asthma cohorts. Patients were stratified into T2-high and non-T2 endotypes based on the Methods section. (A, B) Type 2 cytokines (A) IL-4 and (B) IL-9 were significantly elevated in the T2-high groups compared to non-T2 counterparts in both age cohorts, confirming the T2-high stratification. (C–E) Th1-associated cytokines (C) IL-2, (D) IFN-γ, and (E) TNF-α showed distinct patterns, with TNF-α notably elevated in the adult non-T2 group. (F, G) Pro-inflammatory and Th17-associated cytokines (F) IL-6 and (G) IL-17A were analyzed to assess non-type 2 inflammation. (H–L) Analysis of serum cytokine levels in the pediatric (n = 142 T2-high, n = 50 non-T2) and adult (n = 103 T2-high, n = 111 non-T2) cohorts. Patients were stratified into T2-high and non-T2 groups based on IgE levels (high IgE, ≥100 IU/mL; low IgE, <100). (H–K) Comparison of serum concentrations for (H) IL-4, (I) IL-9, (J) IL-2, and (K) IFN-γ. (L) Serum cytokine-based odds ratios (ORs) for T2-high versus Non-T2 asthma in pediatric and adult cohorts. Serum concentrations of T2-related and non-T2 cytokines were measured at baseline in a pediatric asthma cohort and an adult asthma cohort, and their associations with T2 inflammatory status were evaluated by logistic regression. The forest plot displays ORs for T2-high versus non-T2 asthma for each analyte (IgE, IL-5, IL-13, IL-2, IL-6, IL-9, IL-10, IFN-γ, TNF-α, IL-17A, IL-17F, IL-4, and IL-22), and the multivariable terms IL-2 (multivariate) and IgE (multivariate), plotted on a linear scale from 0.9 to 1.1. Filled circles indicate estimated ORs, horizontal lines represent 95% confidence intervals, and the vertical dotted line denotes an OR of 1.0 (no association). Across both cohorts, ORs for individual cytokines clustered closely around 1.0, indicating only modest differences in circulating cytokine levels between T2-high and non-T2 patients. Data are presented as dot plots representing individual patient values, with horizontal bars indicating the geometric mean. Statistical significance was determined using the Mann–Whitney U test (p-values as indicated in the main text). T2-high, type 2-high inflammation; non-T2, non-type 2 inflammation. ns, not significant. * p < 0.05, ** p < 0.01, and **p < 0.001.
Stratification by age revealed distinct, cohort-specific patterns. In the pediatric cohort, children with non-T2 asthma displayed a prominent non-T2 inflammatory signature, with significantly higher serum IL-2, IFN-γ, IL-6, and IL-17A compared with T2-high children (Figures 2C, D, F, G; p < 0.05 for all indicated comparisons). Pediatric IL-4 and IL-9 concentrations were numerically higher than in adults but showed no consistent differences between T2 strata. In the adult cohort, the levels of IL-2, IFN-γ, IL-6, and IL-17A were uniformly low and did not differ by T2 status, whereas IL-9 was selectively increased in T2-high adults relative to non-T2 adults (Figure 2B; p < 0.05). Together, these data indicate that systemic IL-4, IL-9, and TNF-α skewing characterizes T2-high asthma overall, while non-T2 pediatric asthma is marked by elevated Th1/Th17-associated and pro-inflammatory cytokines that are largely absent in adults.
To disentangle the contributions of allergic sensitization from T2-inflammatory status on serum total IgE levels, we next stratified all asthma patients by total serum IgE (high IgE, ≥100 IU/mL; low IgE, <100 IU/mL), generating four groups: non-T2_low IgE (n = 134), T2-high_low IgE (n = 23), non-T2_high IgE (n = 27), and T2-high_high IgE (n = 222) (Figures 2H–K). IL-4 and IL-9 concentrations were uniformly low and comparable between the two low-IgE subgroups, whereas both cytokines were substantially higher in patients with high IgE, with the greatest dispersion observed in the T2-high_high IgE group; however, IL-4 and IL-9 levels did not differ significantly between the non-T2_high and T2-high_high IgE subgroups (ns), indicating that elevated IgE rather than T2 status primarily tracked with systemic IL-4 and IL-9 abundance (Figures 2H, I). In contrast, IL-2 showed a distinct pattern: within the high-IgE stratum, IL-2 concentrations were significantly higher in non-T2_high IgE patients compared with T2-high_high IgE patients (p < 0.05), while both low-IgE subgroups exhibited similarly low IL-2 levels (Figure 2J). IFN-γ concentrations tended to be higher in the non-T2_high IgE subjects than in T2-high_high IgE subjects, but this difference did not reach statistical significance (ns) (Figure 2K). These findings suggest that high IgE is associated with increased circulating IL-4 and IL-9 irrespective of T2 classification, whereas non-T2_high IgE asthma preferentially retains a Th1/IL-2-skewed cytokine profile.
In univariate analysis, higher IgE levels, whether continuous (OR: 0.986, 95% CI: 0.983–0.989, p < 0.0001) or categorical (OR: 0.019, 95% CI: 0.010–0.035, p < 0.0001), were inversely associated with non-T2 asthma, while higher IL-2 levels (OR: 1.032, 95% CI: 1.007–1.058, p = 0.0119) were positively associated. In multivariate analysis, IgE, whether continuous (OR: 0.992, 95% CI: 0.988–0.995, p < 0.0001) or categorical (OR: 0.019, 95% CI: 0.009–0.041, p < 0.0001), was independently inversely associated with non-T2 asthma; IL-2 was independently positively associated, regardless of whether IgE was continuous (OR: 1.030, 95% CI: 1.003–1.057, p = 0.027) or categorical (OR: 1.029, 95% CI: 1.002–1.056, p = 0.035) (Figure 2L). These findings demonstrated lower Th2 cytokine levels and an inverse relationship between IgE, alongside a positive association with IL-2 in non-T2 asthma.
WGCNA highlights downregulation of total IgE and IL-4-associated gene module in non-T2 asthma
3.5
To explore the relationships between gene co-expression with total IgE levels, WGCNA was employed, and module eigengenes (MEs) were compared between our 11 non-T2 and 17 T2-high patients. Total IgE levels clustered with the ME of the blue module, the ME of the greenyellow module, and the ME of the lightgreen module (Figure 3A). Genes within the lightgreen module exhibited a positive correlation with total IgE levels (Figures 3B–D, Supplementary Table 1). The ME value of the lightgreen module was significantly lower in the non-T2 group than in the T2-high group, suggesting that total IgE was downregulated in non-T2 asthma (Figure 3E). Notably, IL-4, a key Th2 cytokine, was identified in the lightgreen module, and its mRNA levels were lower in the non-T2 group (Figure 3F). WGCNA revealed a total IgE-associated gene module, suggesting downregulated IgE and IL-4 mRNA in non-T2 asthma.
*Weighted Gene Co-expression Network Analysis (WGCNA) identifies IgE-associated modules showing lower eigengene expression in non-T2 asthma. (A) Eigengene–trait dendrogram heatmap of module–trait relationships. This heatmap represents the hierarchical clustering of module eigengenes and their correlation with clinical traits. Modules, identified by their distinct colors, are hierarchically clustered based on eigengene similarity, with correlation values shown in a gradient from blue (negative correlation) to red (positive correlation). Key relationships highlight significant associations between specific modules and clinical traits. (B) Heatmap of module–trait relationships. This matrix displays Pearson’s correlation coefficients and p-values (in parentheses) between module eigengenes and clinical traits. (C) Gene significance across WGCNA modules for total IgE. The boxplot displays the distribution of gene significance values for total IgE across different WGCNA modules, each represented by a unique module color. Gene significance reflects the correlation between individual genes within each module and total IgE levels. Modules with higher median gene significance values indicate a stronger association with total IgE. Each box represents the interquartile range (IQR), with the horizontal line marking the median, whiskers extending to 1.5× the IQR, and dots representing outliers. The module colors are labeled on the x-axis, and gene significance values are plotted on the y-axis. (D) Correlation between lightgreen module eigengene (ME) and total IgE levels. A scatter plot illustrating the linear relationship between the lightgreen ME and serum total IgE levels across the study population. The positive correlation (r = 0.83, p < 0.001) supports the association of this module with total IgE. (E) ME of lightgreen module comparison between non-T2 and T2-high asthma. Box plot comparing the ME between non-T2 (n = 11) and T2-high (n = 17) asthma groups. The significant difference (p < 0.05) suggests a lower activity of lightgreen module in non-T2 asthma, consistent with its association with IgE. (F) IL-4 mRNA expression levels in non-T2 versus T2-high asthma. Bar plot showing log2-transformed fold changes of IL-4 mRNA expression in non-T2 (n = 11) and T2-high (n = 17) groups. No significant difference was observed (ns). (G) Differential expression of SLC7A8 and SIGLEC8 across datasets and patient groups. The left panel shows log2 fold change of SLC7A8 and SIGLEC8 in the study dataset (orange), non-atopic dataset (green), and high-atopic dataset (blue). The right panel displays the mean normalized counts of SLC7A8 and SIGLEC8 between non-T2 (n = 11, orange) and T2-high (n = 17, green) groups. P < 0.05; ns, not significant.
In the overlapped lightgreen module genes with genes from all seven GSEA gene sets, we identified SLC7A8 and SIGLEC8. SLC7A8 was downregulated in our study dataset and in the non-T2 group. SIGLEC8 was downregulated in the study dataset and in the non-atopic dataset. It also showed lower expression in the non-T2 group (Figure 3G). SLC7A8 plays a crucial role in type 2 innate lymphoid cells (ILC2) differentiation and activation (28). SIGLEC8 is highly expressed on eosinophils and mast cells in the airways of patients with asthma, particularly in T2-high disease (29). Our findings implied impaired Th2 differentiation and activation in non-T2 asthma.
Differential activation status of the FcϵRI and BCR reactome pathways in non-T2 dataset
3.6
Given their central role in allergic sensitization, we next focused on the pathway activities of signaling by BCR (R-HSA-983705) and FcϵRI signaling (R-HSA-2454202) among the study, non-atopic, and high-atopic datasets (19, 30–32). The pathway activity of the high-atopic dataset was predicted to be activated (FcϵRI signaling: z-score = 5.234, p = 5.84 × 10^−6^; signaling by BCR: z-score = 4.098, p = 7.97 × 10^−5^), while the pathway activity of the study and non-atopic datasets was predicted to be inhibited (FcϵRI signaling: z-score = −6.856, p = 9.83 × 10^−50^; signaling of BCR: z-score = −6.091, p = 6.35 × 10^−42^; and FcϵRI signaling: z-score = −3.024, p = 2.88 × 10^−3^; signaling of BCR: z-score = −2.60, p = 9.24 × 10^−3^, respectively) in FcϵRI (Figures 4A–C) and BCR pathways (Figures 4D–F). IP3R-mediated Ca^2+^ release from the endoplasmic reticulum and nuclear translocation of the CaN: CaM : NFAT complex were predicted to be upregulated in the high-atopic dataset and downregulated in the study and non-atopic datasets (Supplementary Figure 4: FcϵRI-mediated Ca^2+^ mobilization). Although IP3-mediated calcium release, TRPC1-mediated calcium influx, and CRAC channel-mediated calcium influx were predicted to be inhibited in the study and non-atopic datasets, they were predicted to be activated in the high-atopic dataset (Figures 4D–F: Cytosolic Ca^2+^ in BCR signaling).
Dataset-specific modulation of high-affinity immunoglobulin E receptor (FcϵRI) and B-cell receptor (BCR) signaling Reactome pathways reveals differential activation status and common gene overlap. This figure illustrates the Reactome pathway analysis results for the high-affinity immunoglobulin E receptor (FcϵRI) signaling pathway across three datasets: study dataset, non-atopic dataset, and high-atopic dataset. Each diagram maps the activation and inhibition of key molecular components and interactions within the pathway derived from each dataset. Nodes are color-coded to represent expression changes, with red denoting more extreme upregulation and green denoting more extreme downregulation, transitioning to lighter shades for less intense regulation. Predicted activation is represented in orange, while predicted inhibition is shown in blue, with gradient intensities reflecting confidence levels in these predictions. Connecting arrows illustrate predicted relationships, with orange arrows indicating activation, blue arrows indicating inhibition, yellow lines representing findings inconsistent with the predicted state of the downstream molecule, and gray lines indicating effects that are not predicted. (A) FcϵRI signaling Reactome pathway analysis for the study dataset. (B) FcϵRI signaling Reactome pathway analysis for the non-atopic dataset. (C) FcϵRI signaling Reactome pathway analysis for the high-atopic dataset. The study dataset demonstrates robust activation of upstream and downstream components in FcϵRI signaling, as indicated by widespread red nodes (upregulated molecules) and orange arrows (predicted activation). Compared to high-atopic dataset, the non-atopic dataset exhibits partial attenuation of the pathway, with green nodes indicating downregulation or inhibition of IgE and IgE receptor components and some blue nodes showing predicted inhibition of downstream molecules. (D) BCR signaling pathway in the study dataset. (E) BCR signaling pathway in the non-atopic dataset. (F) BCR signaling pathway in the high-atopic dataset. In both the study dataset and non-atopic dataset, the BCR signaling pathway shows a reduction in activation of upstream molecules (green nodes), particularly in antigen recognition and early signaling events. The effector responses, such as calcium mobilization, were all predicted to be inhibited in both non-atopic dataset (blue nodes and arrows) but predicted to be activated in high-atopic dataset (orange nodes and arrows). (G) Gene overlap in the FcϵRI signaling pathway visualized using a Venn diagram. Datasets include study, non-atopic, and high-atopic. Numbers represent the count of shared genes between datasets. (H) Gene overlap in the BCR signaling pathway depicted using a Venn diagram. Datasets include study dataset, non-atopic dataset, and high-atopic dataset. Numbers within each section represent the number of genes shared between the respective datasets. (I) Comparison of gene expression (mean normalized counts) from nine overlapped genes between non-T2 (n = 11) and T2-high (n = 17) groups. Error bars indicate standard deviation.
Through IPA canonical pathway analysis, we identified 49, 31, and 30 molecules associated with FcϵRI signaling within the study, non-atopic, and high-atopic datasets, respectively (Figure 4G). We also identified 41, 25, and 24 molecules associated with BCR signaling within the study, non-atopic, and high-atopic datasets, respectively (Figure 4H). The Venn diagram revealed that nine gene symbols (IGHV3-11, IGHV3-23, IGHV3-48, IGHV3-7, IGKV3-11, IGKV3-15, IGKV3-20, IGLV2-14, and IGLV2-23) were common to all three datasets and identical in both the BCR and FcϵRI signaling. The expression of these nine genes from the high-atopic dataset was upregulated, while that from both the study and non-atopic datasets was downregulated (Figure 4I).
Downregulation of CDR-related IGHV, IGKV, and IGLV gene segments in non-T2 asthma
3.7
To investigate the molecular mechanisms underlying the lack of allergic sensitization (absence of allergen-specific IgE) in non-T2 asthma, we assessed the expression of immunoglobulin gene segments involved in immune response. BCRs and IgE antibodies share the same pool of V, D, and J gene segments to create their variable regions (and thus can have the same antigen specificity). Thus, we searched the component molecules of the IgE molecule within the FcϵRI signaling Reactome pathway and found 74 molecules (Supplementary Table 2). Sixty gene segments corresponded to complementarity-determining regions (CDRs) of immunoglobulin, including 16 immunoglobulin heavy chain variable (IGHV) gene segments, 20 immunoglobulin kappa chain variable (IGKV) gene segments, and 24 immunoglobulin lambda chain variable (IGLV) gene segments, which contributed to the antigen-binding sites (Supplementary Table 3). We analyzed the gene expression profiles of component molecules of IgE across three datasets and between patient groups (Figure 5). We compared the expression of CDR-related IGHV, IGKV, and IGLV gene segments associated with the IgE molecule across the three datasets (Figure 5A). The study dataset showed uniform downregulation (log2 fold change) of CDR-related IGHV, IGKV, and IGLV gene segments. In the non-atopic dataset, most of these gene segments were markedly downregulated. Conversely, the high-atopic dataset showed considerable upregulation of CDR-related IGHV, IGKV, and IGLV gene segments. When comparing our non-T2 and T2-high patient groups, the normalized mean expression of the CDR-related IGHV, IGKV, and IGLV gene segments was higher in the T2-high group than in the non-T2 group (Figure 5B). Therefore, the differential abundance of transcripts for variable region-specific gene segments reflects a distinct expression pattern of CDR-related IGHV, IGKV, and IGLV gene segments in non-T2 vs. T2-high asthma.
Reduced expression in IgE complementarity-determining regions (CDRs) related to IGHV, IGKV, and IGLV gene segments in non-T2 asthma reveals modulated functional involvement in high-affinity immunoglobulin E receptor (FcϵRI) signaling pathway. (A) IgE molecule CDR-related IGHV, IGKV, and IGLV gene expression among three datasets. The high-atopic dataset exhibits the strongest upregulation of FcϵRI-related CDR genes, including IGHV1–2 and IGHV3-33, suggesting a robust activation of IgE-mediated immune pathways. The non-atopic dataset shows a mixed pattern, with both upregulated (e.g., IGKV3-20) and downregulated (e.g., IGKV1-5) genes, indicating variability in immune signaling responses. The study dataset predominantly displays downregulation of CDR genes, reflecting a more subdued FcϵRI signaling profile compared to the other datasets. (B) IgE molecule CDR-related IGHV, IGKV, and IGLV gene expression between non-T2 and T2-high groups. The T2-high group shows significantly higher expression of FcϵRI-related CDR genes, such as IGKV3–20 and IGHV3-33, indicating a stronger IgE-mediated immune response. The non-T2 group has consistently lower expression of these genes, reflecting reduced activation of FcϵRI signaling. (C) Database for Annotation, Visualization, and Integrated Discovery (DAVID) for functional annotation clustering of IgE component molecules within the FcϵRI signaling Reactome pathway. The y-axis displays enriched Gene Ontology (GO), KEGG Pathway (KW), InterPro (IPR), SMART domain (SM), and protein region terms. The x-axis represents the statistical significance of enrichment, expressed as −log10(p-value). Higher values on the x-axis indicate greater enrichment and statistical significance. The analysis reveals an enrichment for terms related to immunoglobulin structure and function, including Immunoglobulin, Ig_V-set, Ig-like_dom, and Complementarity-determining region.
These CDR-related IGHV, IGKV, and IGLV gene segments represent specific functional annotations (Figure 5C). Reduced function of REGION: Framework-1-, REGION: Framework-2-, REGION: Framework-3-, KW-0393-Immunoglobulin domain, and GO:0002377~immunoglobulin production may be associated with decreased IgE stability or expression in non-T2 asthma. Reduced function of GO:0003823~antigen binding, REGION: Complementarity-determining-1-, REGION: Complementarity-determining-2-, and REGION: Complementarity-determining-3-, and GO:0006955~immune response may imply altered affinity of CDRs for allergens, leading to minimal or no allergen-specific IgE production (negative sensitization) observed in non-T2 asthma. Our findings provided a potential molecular explanation for the absence of allergen-specific IgE, implying limited antigen specificity of IgE in allergic response in non-T2 asthma.
Discussion
4
Pathway analysis reveals that Reactome pathways involving the FcϵRI complex and the BCR complex were inhibited. GSEA consistently demonstrated broad suppression of downstream signaling pathways critical for humoral immune activation, including Fcγ receptor-dependent phagocytosis, FcϵRI signaling, and BCR signaling. Dendritic cells (DCs) are known to express a range of receptors associated with scavenger receptors, the complement cascade, Fcγ receptor-mediated phagocytosis, Fcϵ receptor signaling, and innate-adaptive communication (33). During allergen sensitization, tissue-resident DCs capture and process antigens, initiating a cascade of events that culminates in T helper cell polarization (2). We propose that attenuated receptor-mediated signaling in DCs was linked to altered activation states, potentially impacting the differentiation of Th2 cells and follicular helper T (Tfh) cells.
In the non-T2 dataset and patient group, CDR-related IGHV, IGKV, and IGLV genes were downregulated compared to the T2-high dataset and patient group. These CDR-related genes are determinants of the antigen-binding specificity and affinity of IgE. The differential expression of the IGHV, IGKV, and IGLV genes reflects quantitative changes in the transcripts of specific variable gene segments. The frequencies of IGHV, IGKV, or IGLV gene usage in IgE-expressing B cells can provide insight into the immune mechanisms underlying allergic diseases. Kerzel et al. reported that IgE transcripts from preschool children with atopic dermatitis (AD) displayed a preferred dominance other than asthma, suggesting a biased usage of the variable gene segment of the immunoglobulin genes (34). A disproportionate usage of certain IGHV, IGKV, and IGLV genes in IgE-expressing B cells suggests clonality or preferential selection driven by allergen-specific stimulation. IGLV1–51 participates in antigen recognition, influencing antibody specificity and affinity. IGLV1-51 may encode light chains that pair with the heavy chains of IgE molecules, forming high-affinity IgE antibodies that target specific allergens, such as peanuts (35). These observed expression changes likely reflect critical immunological processes, including i) increased transcription of IgE-specific IGHV, IGKV, and IGLV genes, suggesting the expansion of particular IgE-producing B cells; ii) preferential gene usage, characterized by biased utilization of specific IGHV, IGKV, and IGLV genes; and iii) downregulation of IgE production.
BCRs on allergen-specific naïve B cells recognize and process antigens. This triggers TCR engagement and CD40–CD40L interaction, essential for B-cell maturation. Together with IL-4/IL-13 signaling, these processes lead to class-switch recombination (CSR) and IgE production (18). The downregulation of IGHV, IGKV, and IGLV genes in non-T2 asthma patients and the significantly lower IL-4 mRNA level in the non-T2 asthma than the T2-high asthma group suggest suppression of the germinal center reactions and signaling cascades driving CSR to IgE. IL-9 promotes mast cell growth and survival, bronchial hyperresponsiveness (BHR), mucus cell metaplasia, and airway wall remodeling (36). Decreased pro-inflammatory cytokines (e.g., IL-6, IL-1β, and TNF-α) are associated with mitigated T2 inflammation (37).Our study compared cytokine expression profiles between patients with non-type 2 (non-T2) and T2-high asthma, stratified by age, to elucidate the immunologic mechanisms underlying these distinct endotypes. Our results demonstrate that non-T2 asthma, particularly among children, is characterized by an active and heterogeneous cytokine environment involving overlapping Th2, Th1, and Th17 pathway activation. Elevated IL-4, IL-9, and TNF-α were observed in non-T2 asthma compared with T2-high asthma, while children exhibited higher levels of IL-2, IL-6, IFN-γ, and IL-17A than adults. These findings indicate that non-T2 asthma is not immunologically quiescent but instead represents a dynamic inflammatory state with mixed immune activation. Non-T2 asthma has traditionally been defined by the absence of eosinophilic inflammation and the low expression of canonical Th2 cytokines, yet recent evidence and our current data challenge this dichotomous framework. Mechanistic studies have established that non-T2 asthma involves prominent activation of Th1 and Th17 responses, with key roles for IL-6, IL-17A, and TNF-α in driving neutrophilic inflammation and airway hyperresponsiveness (38). The increased expression of IL-4, IL-9, and IL-13 in our non-T2 children may appear paradoxical but likely reflects that children with severe asthma have elevated ILC2s even when they are non-T2 (low eosinophils) (39). Notably, non-atopic T2-high variants have been described in children, primarily driven by ILC2 activation, underscoring the cellular diversity within this endotype (40).
Our IgE-stratified analysis indicates that the systemic cytokine milieu exerts a differential influence on whether patients fall into a high- versus low-IgE state. IL-4 and IL-9 concentrations closely tracked with total IgE, being uniformly low in both low-IgE subgroups and substantially higher in patients with high IgE, irrespective of T2 classification. This pattern is consistent with the canonical role of IL-4 (and IL-13) as the key “first signal” driving class-switch recombination to IgE in human B cells (41) and with data showing that IL-9 further amplifies IL-4-dependent IgE and IgG production by B cells and promotes mast cell expansion in IgE-driven allergic disease (42). Thus, in our cohort, high serum IL-4/IL-9 appears to reflect an established type 2 cytokine environment that favors sustained IgE production, whereas low concentrations of these cytokines are associated with maintenance of a low-IgE phenotype, even in individuals categorized as T2-high by clinical or biomarker criteria. In contrast, IL-2 and IFN-γ showed a more complex and partially antagonistic relationship with IgE. IL-2 levels were selectively elevated in the non-T2_high IgE subgroup compared with T2-high_high IgE patients, and IFN-γ displayed a similar, albeit non-significant, trend. Th1-associated cytokines such as IL-2 and IFN-γ are known to counter-regulate Th2 responses and to inhibit IL-4-driven IgE synthesis by human B cells (43, 44). Our data suggest that, even within a high-IgE background, the presence of higher IL-2 (and potentially IFN-γ) identifies a subgroup in which IgE production may be at least partially constrained by ongoing Th1-skewed inflammation, whereas T2-high_high IgE patients exhibit a cytokine profile dominated by IL-4/IL-9 with less Th1 counter-regulation. Collectively, these findings support a model in which the absolute IgE level is not determined by T2 status alone but by the net balance between IgE-promoting Th2/type 2 cytokines (IL-4 and IL-9) and IgE-antagonistic Th1 cytokines (IL-2 and IFN-γ), and they highlight serum cytokine profiling as a potential tool to distinguish qualitatively different high-IgE states in asthma.
A particularly notable observation from our study is the pronounced age-related difference in cytokine patterns. Children with non-T2 asthma exhibited markedly higher levels of IL-6, IFN-γ, and IL-17A than adults, consistent with a Th1/Th17-dominant immune phenotype. This finding aligns with evidence that pediatric airways demonstrate heightened epithelial responsiveness to IL-17A, which contributes to airway inflammation even in well-controlled asthma (45). Our cytokine analysis revealed that pediatric non-T2 asthma is characterized by elevated Th1 and Th17 cytokines, including IL-2, IL-6, IFN-γ, and IL-17A, accompanied by the downregulation of immunoglobulin-associated genes, indicating an attenuated Th2 signature and reduced atopy (20). These cytokine patterns suggest a dominance of innate and Th17-driven inflammation, often triggered by infection or environmental stimuli such as pollution. The elevation of IL-6 and IFN-γ in children suggests that non-T2 asthma in this population is a more inflammatory phenotype, potentially predisposing to frequent exacerbations, accelerated airway remodeling, and corticosteroid resistance. Mechanistically, IL-6-driven STAT3 signaling has been implicated in steroid resistance and persistent airway inflammation in Th17-skewed asthma models (46), reinforcing the clinical importance of these cytokine patterns. Our findings are consistent with multiple recent investigations emphasizing the complexity of non-T2 asthma. Studies have shown that Th17-associated cytokines, including IL-17A and IL-21, are upregulated in neutrophilic and corticosteroid-resistant asthma (47). These insights underscore that non-T2 asthma is driven by multiple overlapping immune pathways rather than a lack of inflammation. Together with our findings, these studies support a view of asthma as a continuous immunologic spectrum rather than discrete Th2-high and Th2-low categories. In adults, non-T2 asthma typically presents as a chronic, neutrophilic, or mixed inflammatory phenotype associated with obesity, smoking, or recurrent infection (11, 48). Elevated IL-6, IL-8, IL-17, and TNF-α suggest sustained activation of Th1/Th17 and inflammasome pathways. Unlike the pediatric form, which reflects immune immaturity and transient environmental influence, adult non-T2 asthma often develops secondary to metabolic dysregulation and prolonged corticosteroid exposure. This phenotype exhibits poor corticosteroid responsiveness and greater comorbidity burden (49). In contrast, adult T2-high asthma remains dominated by Th2 cytokines (IL-4, IL-5, and IL-13) and eosinophilia, showing robust response to biologics and corticosteroids (50). Despite these apparent differences, both the pediatric and adult non-T2 groups exhibited similar clinical severity and exacerbation frequency, suggesting that non-T2 inflammation can be equally pathogenic even without T2 biomarker elevation (51).
Age-stratified analyses revealed that the immunologic correlates of T2 status are fundamentally different in children and adults. In the pediatric cohort, non-T2 asthma was characterized by higher circulating IL-2, IFN-γ, IL-6, and IL-17A compared with T2-high disease, whereas these same Th1/Th17-associated and pro-inflammatory cytokines were uniformly low and non-discriminatory in adults. This pattern is consistent with the emerging view that pediatric non-T2 asthma often reflects a Th1/Th17-skewed, neutrophil-predominant endotype, in contrast to the classic Th2/IL-4/IL-5/IL-13-driven phenotype that dominates many adult cohorts (36). The observation that systemic Th1/Th17 cytokines segregated with non-T2 status only in children suggests that age-related factors—such as developmental immunology, infection burden, obesity, or epigenetic programming—may amplify non-T2 pathways earlier in life and become less prominent or more compartmentalized to the airways with aging (52). In contrast, adult T2-high asthma was distinguished primarily by increased IL-9, with relatively modest differences in other serum cytokines, aligning with reports that a subset of adult T2 asthma is dominated by epithelial–ILC2–B-cell crosstalk and mast cell activation rather than broad systemic Th2 polarization (53). Together, these findings highlight that the same T2/non-T2 classification captures biologically distinct endotypes across the life course and underscore the need for age-specific biomarker cut-offs and therapeutic strategies.
The differential activities of the FcϵRI and BCR Reactome pathways between the non-T2 and T2-high phenotypes correlated with the differential expression of CDR-related IGHV, IGKV, and IGLV genes. The top-ranked canonical pathway identified in the non-T2 study dataset was consistently observed across all subsequent datasets of GSE145505. This universality suggests that these pathways are fundamental to the core immunological framework spanning diverse atopic phenotypes, from non-atopic (non-T2) states to highly atopic (T2-high) conditions. We speculate that a unified regulatory network made up of these Reactome pathways is a key driver of allergic responses, as evidenced by their consistent involvement and dose-dependent regulation across all datasets.
The clinical implications of these results are substantial. First, they highlight the inadequacy of the current binary T2-high/T2-low framework, suggesting that a more nuanced classification incorporating Th1 and Th17 activity is necessary for accurate endotyping and therapy selection. Second, the lack of targeted therapies for non-T2 asthma remains a major unmet need. Unlike T2-high asthma, which benefits from anti-IgE, anti-IL-5, and anti-IL-4Rα biologics, non-T2 asthma lacks effective biologics and is often refractory to corticosteroids (54). The increased Th17 and IL-6/STAT3 signaling observed in our study suggests that inhibitors targeting these pathways, such as IL-17 blockers, JAK inhibitors, or anti-IL-6 agents, could provide novel therapeutic options. Indeed, ruxolitinib, a JAK inhibitor, has shown efficacy in reducing airway hyperresponsiveness and inflammation in corticosteroid-resistant, Th1/Th17-driven asthma models (55).
Conclusion
5
Our findings elucidated the inflammatory endotype associated with low total IgE levels and negative sensitization in non-T2 asthma. Non-T2 asthma is characterized by inhibited profiles of canonical pathways related to receptor-mediated pathways. The downregulation of immunoglobulin gene segments like IGHV, IGKV, and IGLV reflects quantitative changes in the abundance of transcripts for specific variable gene segments. The reduced levels of IL-4 and IL-9 in the non-T2 asthma imply diminished Th2 and Tfh cell support for IgE class-switch and allergic response.
Limitation
6
There were several limitations that should be acknowledged. First, although future studies will aim to expand the primary sample size, the alignments with empirical benchmarks for bulk RNA-seq indicate that six to 12 biological replicates are typically sufficient to detect differential expression, and employment of the statistical method DESeq2 optimized for smaller datasets, alongside systems-level pathway analyses, supports the reproducibility and generalizability of the reported results. Second, the cytokine analysis relied on their spontaneous serum levels, which may not fully reflect local airway inflammation dynamics. Third, using public GEO datasets for validation is a best practice in systems transcriptomics because it enhances reproducibility, generalizability, and transparency. However, researchers must carefully control for heterogeneity, batch effects, and metadata inconsistencies to ensure reliable validation. Fourth, while we identified several inhibited canonical pathways and differentially expressed genes, IPA provides inferences, not direct measurements. The functional validation of these findings in experimental models was not performed, limiting causal interpretation of the results.
The reference list from the paper itself. Each links out to its DOI / PubMed record.
- 1Fahy JV . Type 2 inflammation in asthma--present in most, absent in many. Nat Rev Immunol. (2015) 15:57–65. doi: 10.1038/nri 3786, PMID: 25534623 PMC 4390063 · doi ↗ · pubmed ↗
- 2Hammad H Lambrecht BN . The basic immunology of asthma. Cell. (2021) 184:1469–85. doi: 10.1016/j.cell.2021.02.016, PMID: 33711259 · doi ↗ · pubmed ↗
- 3Reddel HK Bateman ED Schatz M Krishnan JA Cloutier MM . A practical guide to implementing SMART in asthma management. J Allergy Clin Immunology: In Practice. (2022) 10:S 31–S 8. doi: 10.1016/j.jaip.2021.10.011, PMID: 34666208 · doi ↗ · pubmed ↗
- 4Rackemann FM . A working classification of asthma. Am J Med. (1947) 3:601–6. doi: 10.1016/0002-9343(47)90204-0, PMID: 20269240 · doi ↗ · pubmed ↗
- 5Romanet-Manent S Charpin D Magnan A Lanteaume A Vervloet D . Allergic vs nonallergic asthma: what makes the difference? Allergy. (2002) 57:607–13. doi: 10.1034/j.1398-9995.2002.23504.x, PMID: 12100301 · doi ↗ · pubmed ↗
- 6Novak N Bieber T . Allergic and nonallergic forms of atopic diseases. J Allergy Clin Immunol. (2003) 112:252–62. doi: 10.1067/mai.2003.1595, PMID: 12897728 · doi ↗ · pubmed ↗
- 7Mc Intyre AP Viswanathan RK . Phenotypes and endotypes in asthma. In: Precision Approaches to Heterogeneity in Asthma. Cham, Switzerland: Springer (2023). p. 119–42., PMID: 10.1007/978-3-031-32259-4_637464119 · doi ↗ · pubmed ↗
- 8Foppiano F Schaub B . Childhood asthma phenotypes and endotypes: a glance into the mosaic. Mol Cell Pediatr. (2023) 10:9. doi: 10.1186/s 40348-023-00159-1, PMID: 37646843 PMC 10469115 · doi ↗ · pubmed ↗