Identification and validation of HOXB3 hypomethylation as a novel prognostically epigenetic biomarker in acute myeloid leukemia
Ting-juan Zhang, Ran Chang, Fei Xie, Zi-jun Xu, Ming-qiang Chu, Xiao-chi Wu, Jun Qian, Jing-dong Zhou

TL;DR
This study identifies HOXB3 hypomethylation as a new epigenetic marker that predicts poor outcomes in acute myeloid leukemia.
Contribution
HOXB3 hypomethylation is newly identified as an independent prognostic biomarker in AML.
Findings
HOXB3 hypomethylation is linked to adverse prognosis in AML patients.
AML patients with HOXB3 hypomethylation show specific genetic patterns like normal karyotype and FLT3-ITD mutations.
HOXB3 hypomethylation is associated with overexpression and several leukemia-related genes.
Abstract
Aberrant expression of Homeobox (HOX) genes has been observed in acute myeloid leukemia (AML), but their epigenetic regulatory mechanisms remain largely elusive. Previously, we identified HOXA9 hypomethylation, among HOXA family genes as an epigenetic biomarker for predicting clinical outcomes and guiding treatment choices in AML. Herein, we further investigated the methylation of HOXB family members in AML and determined its clinical implications. We first systematically analyzed the association of HOXB methylation with expression and clinical outcomes in AML from The Cancer Genome Atlas (TCGA) database. Next, the candidate prognosis-related gene HOXB3 was selected for clinical relevance analysis and further verified in another independent cohort from our hospital. Hypomethylation of HOXB3, which was negatively associated with its expression, was correlated with adverse prognosis…
Genes, proteins, chemicals, diseases, species, mutations and cell lines named across the full text — each resolved to its canonical identifier and authoritative record.
Click any figure to enlarge with its caption.
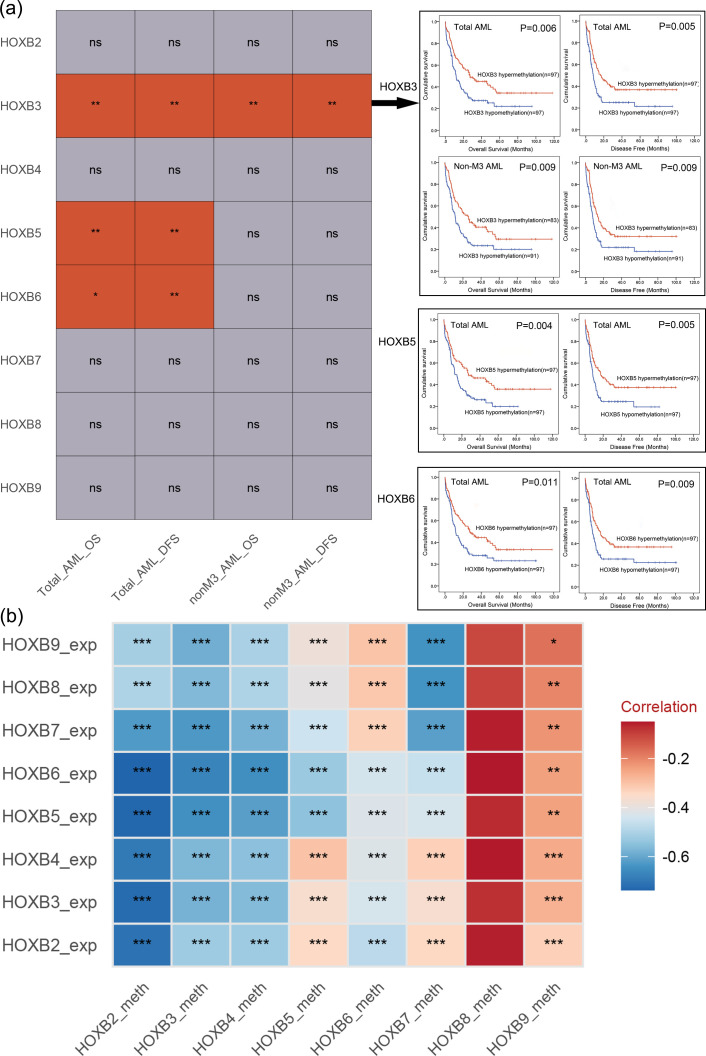 Figure 1
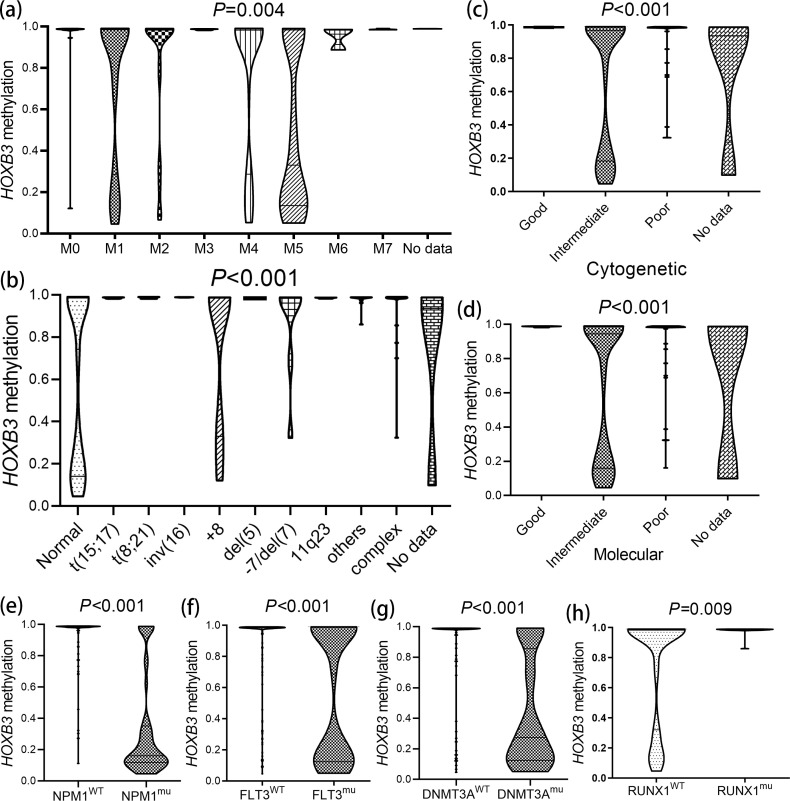 Figure 2
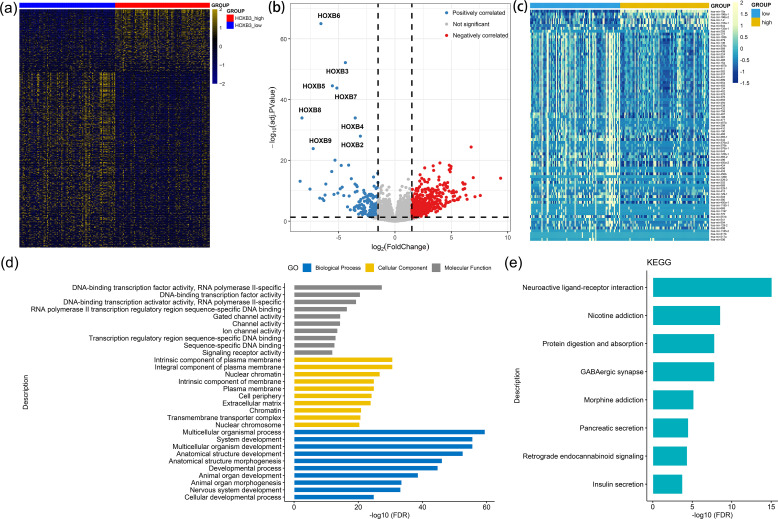 Figure 3
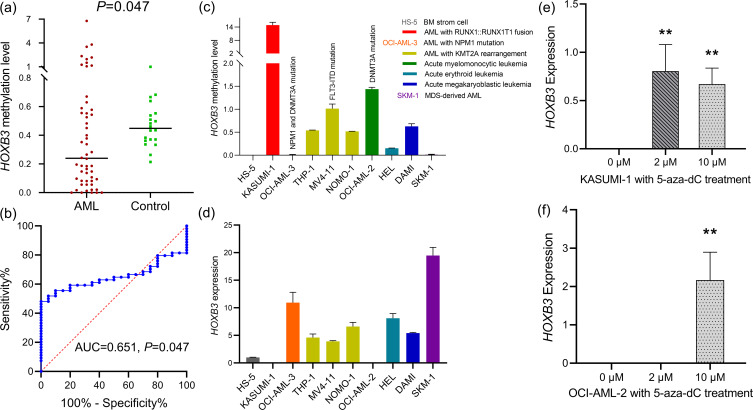 Figure 4
| Variables | Total AML | Non-M3 AML | ||||||
|---|---|---|---|---|---|---|---|---|
| Univariate analysis | Multivariate analysis | Univariate analysis | Multivariate analysis | |||||
| HR (95% CI) |
| HR (95% CI) |
| HR (95% CI) |
| HR (95% CI) |
| |
| Overall Survival | ||||||||
| 0.869 (0.615-1.229) | 0.428 | 1.003 (0.703-1.432) | 0.986 | |||||
| 0.613 (0.432-0.869) | 0.006 | 0.719 (0.487-1.064) | 0.099 | 0.620 (0.433-0.890) | 0.009 | 0.620 (0.433-0.890) | 0.009 | |
| 0.929 (0.658-1.313) | 0.676 | 0.999 (0.700-1.425) | 0.995 | |||||
| 0.603 (0.425-0.857) | 0.005 | 0.700 (0.473-1.037) | 0.075 | 0.746 (0.521-1.070) | 0.112 | 0.965 (0.626-1.487) | 0.872 | |
| 0.639 (0.451-0.906) | 0.012 | 0.821 (0.542-1.244) | 0.352 | 0.706 (0.493-1.012) | 0.058 | 0.838 (0.563-1.247) | 0.384 | |
| 0.813 (0.575-1.149) | 0.241 | 0.844 (0.591-1.206) | 0.352 | |||||
| 0.992 (0.702-1.402) | 0.966 | 1.138 (0.797-1.624) | 0.477 | |||||
| 0.943 (0.667-1.334) | 0.741 | 0.817 (0.731-1.488) | 0.817 | |||||
| Disease-free Survival | ||||||||
| 0.855 (0.605-1.208) | 0.375 | 0.983 (0.689-1.403) | 0.925 | |||||
| 0.608 (0.429-0.802) | 0.005 | 0.698 (0.477-1.022) | 0.064 | 0.621 (0.433-0.890) | 0.009 | 0.621 (0.433-0.890) | 0.009 | |
| 0.939 (0.665-1.326) | 0.720 | 1.000 (0.701-1.427) | 0.998 | |||||
| 0.613 (0.432-0.869) | 0.006 | 0.708 (0.483-1.036) | 0.076 | 0.774 (0.541-1.109) | 0.162 | 0.992 (0.649-1.516) | 0.970 | |
| 0.633 (0.447-0.898) | 0.010 | 0.803 (0.532-1.211) | 0.295 | 0.713 (0.498-1.022) | 0.065 | 0.837 (0.566-1.236) | 0.371 | |
| 0.771 (0.546-1.090) | 0.142 | 1.124 (0.736-1.717) | 0.589 | 0.811 (0.568-1.158) | 0.249 | |||
| 0.980 (0.694-1.385) | 0.910 | 1.127 (0.790-1.609) | 0.509 | |||||
| 0.991 (0.702-1.400) | 0.959 | 1.085 (0.761-1.548) | 0.652 | |||||
| Patient’s parameters | Total | Hypo- (n=97) | Hyper- (n=97) | |
|---|---|---|---|---|
| Sex, male/female | 104/90 | 46/51 | 58/39 | 0.113 |
| Median age, years (range) | 57 (18-88) | 60 (21-88) | 55 (18-83) | 0.100 |
| Median WBC, ×109/L (range) | 16.6 (0.4-298.4) | 19.9 (0.5-298.4) | 16.0 (0.4-223.8) | 0.071 |
| Median PB blasts, % (range) | 36 (0-98) | 22 (0-98) | 40.50 (0-97) | 0.522 |
| Median BM blasts, % (range) | 73.5 (30-100) | 75 (30-100) | 71.5 (30-100) | 0.283 |
| FAB classifications | 0.009 | |||
| M0 | 19 | 5 | 14 | 0.051 |
| M1 | 44 | 21 | 23 | 0.864 |
| M2 | 42 | 24 | 18 | 0.384 |
| M3 | 18 | 6 | 12 | 0.215 |
| M4 | 41 | 22 | 19 | 0.725 |
| M5 | 22 | 17 | 5 | 0.011 |
| M6 | 3 | 2 | 1 | >0.999 |
| M7 | 3 | 0 | 3 | 0.246 |
| No data | 2 | 0 | 2 | 0.497 |
| Karyotypes | <0.001 | |||
| normal | 91 | 63 | 28 | <0.001 |
| t(15;17) | 16 | 6 | 10 | 0.435 |
| t(8;21) | 7 | 2 | 5 | 0.444 |
| inv(16) | 12 | 0 | 12 | <0.001 |
| +8 | 9 | 4 | 5 | >0.999 |
| del(5) | 1 | 0 | 1 | >0.999 |
| -7/del(7) | 8 | 4 | 4 | >0.999 |
| 11q23 | 4 | 1 | 3 | 0.621 |
| others | 14 | 4 | 10 | 0.163 |
| complex | 28 | 11 | 17 | 0.307 |
| No data | 4 | 2 | 2 | >0.999 |
| Risks (cytogenetic) | <0.001 | |||
| Good | 35 | 8 | 27 | 0.001 |
| Intermediate | 112 | 70 | 42 | <0.001 |
| Poor | 43 | 17 | 26 | 0.166 |
| No data | 4 | 2 | 2 | >0.999 |
| Risks (molecular) | <0.001 | |||
| Good | 37 | 8 | 29 | <0.001 |
| Intermediate | 103 | 68 | 35 | <0.001 |
| Poor | 51 | 20 | 31 | 0.102 |
| No data | 3 | 1 | 2 | >0.999 |
| Gene mutations | ||||
| | 55/139 (28.4%) | 36/61 (37.1%) | 19/78 (19.6%) | 0.010 |
| | 53/141 (27.3%) | 47/50 (48.5%) | 6/91 (6.2%) | <0.001 |
| | 47/147 (24.2%) | 40/57 (41.2%) | 7/90 (7.2%) | <0.001 |
| | 18/176 (9.3%) | 8/89 (8.2%) | 10/87 (10.3%) | 0.805 |
| | 19/175 (9.8%) | 11/86 (11.3%) | 8/89 (8.3%) | 0.630 |
| | 16/178 (8.2%) | 10/87 (10.3%) | 6/91 (6.2%) | 0.435 |
| | 15/179 (8.2%) | 4/93 (4.1%) | 11/86 (11.3%) | 0.104 |
| | 16/178 (8.2%) | 7/90 (7.2%) | 9/88 (9.3%) | 0.795 |
| | 15/179 (8.2%) | 7/90 (7.2%) | 8/89 (8.2%) | >0.999 |
| | 13/181 (6.7%) | 5/92 (5.2%) | 8/89 (8.2%) | 0.568 |
| | 11/183 (5.7%) | 5/92 (5.2%) | 6/91 (6.2%) | >0.999 |
| | 9/185 (4.6%) | 6/91 (6.2%) | 3/94 (3.1%) | 0.497 |
| | 8/186 (4.1%) | 3/94 (3.1%) | 5/92 (5.2%) | 0.721 |
| | 8/186 (4.1%) | 3/94 (3.1%) | 5/92 (5.2%) | 0.721 |
| | 6/188 (3.1%) | 4/93 (4.1%) | 2/95 (2.1%) | 0.683 |
| Variables | Total AML | Non-M3 AML | ||||||
|---|---|---|---|---|---|---|---|---|
| Univariate analysis | Multivariate analysis | Univariate analysis | Multivariate analysis | |||||
| HR (95% CI) |
| HR (95% CI) |
| HR (95% CI) |
| HR (95% CI) |
| |
| Overall survival | ||||||||
| Age | 1.039 (1.026-1.053) | <0.001 | 1.026 (1.012-1.040) | <0.001 | 1.032 (1.018-1.046) | <0.001 | 1.020 (1.005-1.035) | 0.007 |
| WBC | 1.003 (0.999-1.006) | 0.119 | 1.002 (0.999-1.006) | 0.150 | 1.001 (0.997-1.005) | 0.558 | ||
| Molecular risks | 1.870 (1.474-2.371) | <0.001 | 2.246 (1.704-2.962) | <0.001 | 1.701 (1.303-2.222) | <0.001 | 2.173 (1.610-2.934) | <0.001 |
| Treatment regimen | 0.540 (0.380-0.767) | 0.001 | 0.479 (0.319-0.720) | <0.001 | 0.446 (0.311-0.639) | <0.001 | 0.432 (0.286-0.654) | <0.001 |
| 1.271 (0.870-1.858) | 0.215 | 1.352 (0.915-2.000) | 0.130 | 1.423 (0.932-2.174) | 0.102 | |||
| 1.220 (0.836-1.780) | 0.302 | 1.063 (0.725-1.557) | 0.756 | |||||
| 1.615 (1.100-2.373) | 0.015 | 1.153 (0.751-1.771) | 0.514 | 1.431 (0.971-2.109) | 0.070 | 1.147 (0.749-1.756) | 0.528 | |
| 0.613 (0.432-0.869) | 0.006 | 0.664 (0.467-0.945) | 0.023 | 0.620 (0.433-0.890) | 0.009 | 0.656 (0.455-0.946) | 0.024 | |
| Disease-free survival | ||||||||
| Age | 1.034 (1.021-1.047) | <0.001 | 1.024 (1.010-1.038) | 0.001 | 1.027 (1.013-1.040) | <0.001 | 1.021 (1.007-1.036) | 0.004 |
| WBC | 1.003 (1.000-1.006) | 0.094 | 1.002 (0.999-1.006) | 0.139 | 1.001 (0.998-1.005) | 0.422 | ||
| Molecular risks | 1.796 (1.424-2.265) | <0.001 | 2.040 (1.563-2.661) | <0.001 | 1.625 (1.253-2.109) | <0.001 | 2.005 (1.503-2.675) | <0.001 |
| Treatment regimen | 0.607 (0.427-0.862) | 0.005 | 0.565 (0.380-0.839) | 0.005 | 0.522 (0.365-0.748) | <0.001 | 0.532 (0.357-0.792) | 0.002 |
| 1.252 (0.857-1.829) | 0.245 | 1.343 (0.909-1.983) | 0.139 | 1.442 (0.944-2.201) | 0.090 | |||
| 1.263 (0.865-1.843) | 0.227 | 1.107 (0.755-1.622) | 0.604 | |||||
| 1.524 (1.040-2.235) | 0.031 | 1.059 (0.691-1.624) | 0.792 | 1.360 (0.924-2.001) | 0.119 | 1.059 (0.692-1.620) | 0.793 | |
| 0.608 (0.429-0.862) | 0.005 | 0.627 (1.563-2.661) | 0.009 | 0.621 (0.433-0.890) | 0.009 | 0.671 (0.460-0.980) | 0.039 | |
Peer Reviews
No public reviews on file for this paper yet. If you reviewed it on a platform where reviews are public (OpenReview, ICLR, NeurIPS, ICML), you can paste yours below so the community can read it here.
Videos
No videos yet. Explain this paper in a talk, walkthrough, or lecture? Add one.
Taxonomy
TopicsAcute Myeloid Leukemia Research · Epigenetics and DNA Methylation · Developmental Biology and Gene Regulation
Introduction
Acute myeloid leukemia (AML) is a heterogeneous aggressive blood cancer with an unsatisfactory prognosis and 5-year overall survival (OS) rate of less than 50% (1). Genetic alterations and epigenetic modifications lead to abrogated differentiation, blocked apoptosis, and uncontrolled proliferation of hematopoietic stem cells (1). Over the past two decades, we have gained deeper insights into the roles of cytogenetics and molecular biology in the pathogenesis and progression of AML (1, 2). In recent years, epigenetic modifications, such as aberrant DNA methylation, a major biological process in silencing the transcription of tumor suppressor genes, have contributed to the pathophysiology of myeloid malignancies and hypomethylating agents are commonly used to treat AML and myelodysplastic syndromes/neoplasm (MDS) (3).
Homeobox (HOX) genes belong to a family of homeodomain containing transcription factors that are mainly involved in early development and hematopoiesis (4). A total of 39 members have been identified in the human HOX gene family, which is divided into four families: HOXA, HOXB, HOXC, and HOXD (4). HOXA family genes, particularly HOXA9 have been thoroughly studied in AML (5). Aberrant methylation was preferentially found in HOXA gene sequences, including HOXA1, HOXA4, HOXA5, HOXA9, HOXA10, and HOXA11 which affect their expression (6). Moreover, our previous study also identified HOXA9 hypomethylation in HOXA family as an epigenetic biomarker for predicting prognosis and guiding treatment choice in AML (7). Among HOXB family, although some studies have suggested that several HOXB genes are upregulated in certain types of AML (8–10), their epigenetic dysregulation in AML has not yet been elucidated. Following our previous study, we systematically investigated methylation of HOXB family members in AML and determined their clinical significance.
Materials and methods
Public datasets
This study included a cohort of 200 AML patients from The Cancer Genome Atlas (TCGA) public databases (11). Clinical data and laboratory findings of AML patients were downloaded from the cBioPortal (https://www.cbioportal.org/) (12). HOXB family gene expression data was available for 173 patients, whereas HOXB family gene methylation data was available for 194 patients (170 overlapping patients with both HOXB expression and methylation).
Patients
A total of 54 de novo AML patients were also included in this research as the validation cohort. Clinico-pathological features of the patients were presented in Supplementary Table S1. After informed consents were obtained from all participants, bone marrow (BM) samples were collected and were prepared for BM mononuclear cells (BMMNCs) as reported (13, 14). Twenty healthy individuals served as the controls.
Cell lines and cell culture
Human leukemic cell lines (KASUMI-1, OCI-AML-2, OCI-AML-3, THP-1, MV4-11, SKM-1, NOMO-1, HEL and DAMI) and BM stoma cell line (HS-5) were used in this study. Cell culture was performed as previous described (7).
Hypomethylation agent and demethylation studies
The KASUMI-1 and OCI-AML-2 cells in 4 mL (5×10^5^ cells/mL) were treated with the hypomethylation agent 5-aza-2’-deoxycytidine (5-aza-dC) at a final concentration of 0 μM (control), 2 μM, 4 μM, and 10 μM for 3 days. All the cell lines were cultured until they are harvested for RNA and DNA extraction.
RNA isolation, reverse transcription and RQ-PCR
Total RNA was isolated from cells using TRIzol reagent, followed by reverse transcription for cDNA synthesis as previously reported (13, 14). Real-time quantitative PCR (RQ-PCR) was conducted to examine the expression levels of HOXB3 by the usage of TB Green^®^ Premix Ex Taq™ II (Tli RNaseH Plus) (RR820A, TaKaRa, Tokyo, Japan). The primers used for the detection of HOXB3 expression were 5’-CTTGGACCGGCTGTTGG-3’ (Forward) and 5’-TTGTCGTAGTAGGTGGCTTT-3’ (Reverse). The RQ-PCR conditions were as follows: 95°C for 5 min, 40 cycles for 10 s at 95°C, 30 s at 56°C, 1 min at 72°C. The reference gene GAPDH was used as our previous literature (7). The relative HOXB3 expression levels were measured using 2^-ΔΔCt^ method.
DNA isolation, bisulfite modification, and RQ-MSP
Genomic DNA was extracted from the cells using a Puregene Blood Kit (158023, QIAGEN, Duesseldorf, Germany), followed by bisulfite modification with the usage of EZ DNA Methylation-Gold^™^ Kit (D5002, ZYMO RESEARCH, Orange County, California). Real-time quantitative methylation-specific PCR (RQ-MSP) was performed to detect the methylation level of HOXB3 by the usage of TB Green^®^ Premix Ex Taq™ II (Tli RNaseH Plus) (RR820A, TaKaRa, Tokyo, Japan). The primers utilized for the detection of HOXB3 methylation were 5’-TTTCGGATCGTTTATACGC-3’ (Methylation Forward) and 5’-CACTTCATACGCCGATTCTA-3’ (Methylation Reverse) as well as 5’-GTTTTTGGATTGTTTATATGT-3’ (Unmethylation Forward) and 5’-CCACTTCATACACCAATTCTAA-3’ (Unmethylation Reverse). The conditions of RQ-MSP program were 95°C for 5 min, 40 cycles for 10 s at 95°C, 30 s at 56°C (Methylation primers) or 54 °C (Unmethylation primers), 30 s at 72°C, 30s at 75 °C. The reference gene ALU was detected as our previous literature (7). The Relative HOXB3 methylation levels were calculated using the 2^-ΔΔCT^ method.
Bioinformatics analysis
The detailed bioinformatics analysis referred to our previous article (7).
Statistical analysis
SPSS 22.0 and GraphPad 8.0 software were used for the statistical analysis. The Mann-Whitney U-test/Kruskal-Wallis test/Student’s T-test and Pearson’s χ^2^-test/Fisher’s exact test were used to compare the continuous and categorical variables, respectively. Kaplan-Meier method (log-rank test) and Cox regression analysis (proportional hazards) were performed to determine the prognostic impact of HOXB family genes methylation on OS and disease-free survival (DFS). The receiver operating characteristic (ROC) curve and area under the ROC curve (AUC) were conducted to evaluate the ability of HOXB3 methylation to distinguish patients with AML from controls. A two-sided P value less than 0.05 was considered statistically significant.
Results
Identification of HOXB3 hypomethylation among HOXB family genes associated with prognosis with expression in AML
To identify the crucial epigenetic markers in HOXB family in AML, we first analyzed the prognostic value of HOXB members methylation with available data (HOXB2/HOXB3/HOXB4/HOXB5/HOXB6/HOXB7/HOXB8/HOXB9) using TCGA databases. The patients were divided into two groups (hyper- and hypo- methylation) based on the median methylation level of each gene. In total AML patients, hypo-methylation of HOXB3, HOXB5 and HOXB6 was markedly correlated with shorter OS (P = 0.006, 0.004 and 0.011, respectively) and DFS (P = 0.005, 0.005, and 0.009, respectively), whereas the other members did not affect survival (both P>0.05, Figure 1a). As patients with AML-M3 have extremely favorable outcomes, we further explored the prognostic impact of these members in non-M3 AML. Notably, only HOXB3 hypo-methylation had a significant prognostic effect on OS and LFS (both P = 0.009, Figure 1a).
*Identification of HOXB family genes methylation correlated with prognosis and expression in AML. (a) The statistical value of the prognostic significance of each HOXB family gene methylation on survival in AML patients (determined by Kaplan-Meier analysis). Moreover, the survival curve of the impact of HOXB3, HOXB5 and HOXB6 methylation on overall/disease-free survival in total/non-M3 AML patients with significant difference were also presented. Total_AML_OS: The prognostic effect of each HOXB family gene methylation on overall survival among total AML; Total_AML_DFS: The prognostic effect of each HOXB family gene methylation on disease free survival among total AML; nonM3_AML_OS: The prognostic effect of each HOXB family gene methylation on overall survival among non-M3 AML; nonM3_AML_DFS: The prognostic effect of each HOXB family gene methylation on disease free survival among non-M3 AML. NS, no significant; *P < 0.05; **P < 0.01. (b) The statistical value of the correlation analysis between each HOXB gene expression and methylation in AML patients (determined by Spearman test). The depth of color differences represents correlation coefficients. *P < 0.05; **P < 0.01; **P < 0.001.
We further tested the prognostic effect of HOXB expression on OS and LFS in AML patients using Cox regression analysis. In all AML patients, none of the HOXB members had prognostic effects on OS or DFS (all P>0.05, Table 1). However, among non-M3 AML patients, HOXB3 hypo-methylation significantly affected the OS and DFS (both P = 0.009, Table 1).
Promoter-associated DNA methylation is a major mechanism regulating gene expression. We analyzed the association between HOXB methylation and expression in patients with AML. A significant negative correlation was observed for HOX2/HOXB3/HOXB4/HOXB5/HOXB6/HOXB7 but not for HOXB8/HOXB9 (Figure 1b).
Taken together, these results suggest that HOXB3 hypo-methylation may be the most valuable prognostic biomarker among the HOXB genes in AML, especially in non-M3 AML, and was selected for further analysis.
HOXB3 hypomethylation associated with specific subtypes of AML
To evaluate the clinical implications of HOXB3 methylation in AML, we compared the clinico-pathological characteristics between HOXB3 hypo- and hyper-methylation groups. There were no significant differences between the two groups in sex, age, white blood cell count, and peripheral blood (PB)/BM blast ratio (all P>0.05, Table 2). However, marked differences were observed between the two groups in the distribution of the French-American-British (FAB) classification (P = 0.009), karyotypic classification (P < 0.001), and molecular/cytogenetic risk classifications (all P < 0.001) (Table 2). Hypomethylation of HOXB3 was significantly occurred in FAB-M5 (P = 0.011, Table 2). Among the karyotypic classification, HOXB3 hypomethylation was more likely to occur in normal karyotype (P < 0.001), and rarely occurred in inv(16) (P < 0.001) (Table 2). As expected, hypomethylation of HOXB3 was occurred markedly in intermediate karyotype and rarely occurred in good karyotype among both cytogenetic and molecular risk classifications (all P ≤ 0.001, Table 2). Among common gene mutations, hypomethylation of HOXB3 was associated with FLT3 (P = 0.010), NPM1 (P < 0.001), DNMT3A mutations (P < 0.001) (Table 2).
Based on the dramatical clinical relations, we further investigated the HOXB3 methylation level in AML patients among different FAB subtypes, karyotypic classifications, and molecular/cytogenetic risks. Expectedly, significant differences were confirmed in the FAB subtypes (P = 0.004), karyotypic classifications (P < 0.001), and molecular/cytogenetic risks (both P < 0.001) (Figures 2a–d). Next, we explored HOXB3 methylation levels in AML patients with and without NPM1/FLT3/DNMT3A/RUNX1 gene mutations. Similar results were observed in NPM1 (P < 0.001), FLT3 (P < 0.001), DNMT3A (P < 0.001) mutation and RUNX1 wild-type (P = 0.009) (Figures 2e–h).
The associations of HOXB3 methylation with specific subtypes of AML. (a)HOXB3 methylation level among different French-American-British (FAB) subtypes of AML. (b)HOXB3 methylation level among different cytogenetic risk subgroups of AML. (c)HOXB3 methylation level among different karyotypic subgroups of AML. (d)HOXB3 methylation level among different molecular risk subgroups of AML. (e)HOXB3 methylation level in groups of AML patients with and without NPM1 mutations. (f)HOXB3 methylation level in groups of AML patients with and without FLT3 mutations. (g)HOXB3 methylation level in groups of AML patients with and without DNMT3A mutations. (h)HOXB3 methylation level in groups of AML patients with and without RUNX1 mutations. The differences between groups were determined by Mann-Whitney U test/Kruskal-Wallis test.
The independent prognostic value of HOXB3 hypomethylation in AML
Since a close correlation was found between HOXB3 hypo-methylation and common prognostic factor karyotypic classifications, we further performed multivariate Cox regression to confirm the independent prognostic impact of HOXB3 hypo-methylation in AML after adjusting for prognosis-related factors. Cox regression multivariate analysis indicated that HOXB3 expression was an independent risk factor affecting OS and DFS in both total AML (P = 0.023 and 0.009, respectively) and non-M3 AML (P = 0.024 and 0.039, respectively) patients (Table 3).
Molecular alterations correlated with HOXB3 dysregulation in AML
To investigate the biological network correlated with HOXB3 dysregulation in AML, we studied the transcriptomes of AML samples with low and high HOXB3 expression from TCGA database. A total of 784 differentially expressed genes (DEGs, including mRNAs and long noncoding RNAs) (208 positively correlated and 576 negatively correlated) and 81 differentially expressed miRNAs (DEmiRs) (8 positively correlated and 73 negatively correlated) were identified between the two groups (Figures 3a–c; Supplementary Table S2). The positively correlated DEGs (Top 10) were HOXB family members, which were reported to have pro-leukemic effects and were associated with clinical outcomes of AML (8–10, 15). Moreover, positively correlated DEmiRs (top 5) such as miR-10, miR-196a and miR-1 were reported to have pro-leukemic effects (16–18), whereas negatively correlated DEmiRs (top 5) such as miR-193b and miR-379 were reported to have anti-leukemic effects in AML (19, 20). Moreover, Gene Ontology (GO) analysis demonstrated that these DEGs were involved in multiple biological processes such as development (Figure 3d).
Molecular signatures associated with HOXB3 expression in AML. (a) Expression heatmap of differentially expressed genes including mRNAs/lncRNAs (DEGs) between low and high HOXB3 expression groups in AML (|log2 FC|>1.5, FDR<0.05 and P < 0.05). (b) Volcano plot of DEGs between low and high HOXB3 expression groups in AML. (c) Expression heatmap of differentially expressed miRNAs between low and high HOXB3 expression groups in AML (|log2 FC|>1.5, FDR<0.05 and P < 0.05). (d) Gene Ontology (GO) and Kyoto Encyclopedia of Genes and Genomes (KEGG) analysis of above DEGs.
Validation of HOXB3 hypomethylation and its epigenetically regulatory role in AML
To validate epigenetic dysregulation of HOXB3 during leukemogenesis, we first determined HOXB3 methylation levels in de novo AML and controls from the validation cohort. HOXB3 methylation levels in AML patients were markedly reduced compared with those in the controls (P = 0.047, Figure 4a). ROC curve analysis indicated that HOXB3 methylation might act as a potential biomarker for distinguishing AML patients from controls, with an AUC of 0.651 (95% CI: 0.532-0.770, P = 0.047) (Figure 4b). Next, we detected the methylation and expression of HOXB3 in nine AML cell lines and one BM stoma cell line. KASUMI-1 and OCI-AML-2 showed the highest HOXB3 methylation levels with a relatively low HOXB3 expression levels, whereas OCI-AML-3 and SKM-1 presented the lowest HOXB3 methylation levels with a relatively high HOXB3 expression levels (Figure 4c-d). HOXB3 expression showed a nearly negative correlation with HOXB3 methylation in nine AML cell lines and one BM stoma cell line (R=-0.612, P = 0.067), indicating that HOXB3 methylation plays a vital role in regulating HOXB3 expression. To confirm the epigenetic regulatory role, KASUMI-1 and OCI-AML-2 cell lines were treated with the hypomethylation agent 5-aza-dC. Expectedly, HOXB3 expression levels were markedly increased after 5-aza-dC treatment (Figures 4e-f).
*Validation of aberrant HOXB3 hypomethylation and its epigenetically regulatory role in AML. (a)HOXB3 methylation in AML patients from our hospital. (b) Receiver operating characteristic curve analysis of HOXB3 methylation in distinguishing AML patients from controls. (c)HOXB3 methylation in AML cell lines. (d)HOXB3 expression in AML cell lines. (e)HOXB3 expression in KASUMI-1 cell-line after 5-aza-dC treatment at different dose. (f)HOXB3 expression in OCI-AML-2 cell-line after 5-aza-dC treatment at different dose. The differences between groups were determined by Mann-Whitney U test and Student T test. *P < 0.05; **P < 0.01; **P < 0.001; ns: no significant.
Discussion
Accumulating evidence has demonstrated aberrant HOX gene expression in diverse blood cancers, especially AML, but the epigenetic regulatory mechanism in AML remains largely elusive (5). Previously, we systematically identified the prognostic value of HOXA family gene methylation in AML, and revealed HOXA9 hypomethylation is an epigenetic biomarker for predicting clinical outcomes and guiding treatment choice in AML (7). Herein, we further determined HOXB family genes methylation in AML, and revealed HOXB3 hypomethylation as an epigenetic biomarker independently affects clinical outcome in AML. Similarly, Lindblad et al. reported that HOXB2 and HOXB3 expressions are independent prognostic markers in AML (9). As we have also demonstrated the epigenetic regulatory role of HOXB3 methylation in AML, we propose that the prognostic value and functional role of HOXB3 hypomethylation in AML mainly depends on its expression. In accordance with our study, Qu et al. showed that decreased methylation of HOXB3 and HOXB4 is associated with increased expression of both HOXB genes specific to mid-risk AML (21). These results suggest HOXB3 methylation and expression are potential biomarkers for AML in clinical use.
Distinct patterns of HOX family gene expression have been described in defined cytogenetic and molecular subsets of patients with AML. Drabkin et al. reported that favorable and poor prognostic chromosomal rearrangements in AML were associated with distinct levels of HOX expression (22). Moreover, HOX overexpression may be correlated with a distinct biologic subset of AML with intermediate cytogenetics (23). Consistently, we observed a marked associations of HOXB3 hypomethylation with FAB subtypes (M5), different karyotypes (normal karyotype), and molecular/cytogenetic risk classifications (intermediate risk). Moreover, we also found that HOXB3 hypomethylation correlated with NPM1, FLT3, and DNMT3A mutations. Similarly, previous studies have indicated that the high expression of several HOX genes is associated with NPM1, FLT3 and DNMT3A mutations (23–26). Moreover, several studies also addressed the closely associations of aberrant HOXB expression/methylation with NPM1, FLT3, and DNMT3A mutations in AML (10, 21, 27). These results indicated that HOXB3 is correlated with certain genetic contexts in AML and may be a common downstream gene with potential targets in these specific AML subtypes.
HOX family members have been identified as transcription factors that activate their own expression or cross-regulate their family members or their cofactors (4). In our study, we also observed that HOXB3 is closely related to the expression of other HOX family genes enriched in the same AML-related function. Moreover, several leukemia-related miRNAs, such as miR-10, miR-196a, miR-1, miR-193b and miR-379, have also been found to be associated with HOXB3 dysregulation (16–20). Consistently, Chen et al. found that HOXB5 is closely associated with the expression of other HOX family genes (10), which supports our results.
Although our study yielded significant results, it has some limitations in the current research. First, the clinical implications of HOXB3 hypomethylation in AML were drawn from public databases and validated using only a small cohort of AML patients from our hospital. These results need to be verified in a larger cohort of AML patients. Second, few functional and mechanical studies have determined the underlying role of HOXB3 hypomethylation in AML. Future studies should incorporate these experiments in order to further corroborate our research findings.
Conclusion
Taken together, HOXB3 hypomethylation, which is associated with HOXB3 overexpression, is a frequent event in AML. AML with HOXB3 hypomethylation usually has unique genetic patterns such as a normal karyotype, cytogenetic/molecular-intermediate risk, and mutations in FLT3-ITD, NPM1 and DNMT3A. Despite these associations, HOXB3 hypomethylation may serve as an independent prognostic biomarker for AML.
The reference list from the paper itself. Each links out to its DOI / PubMed record.
- 1Di Nardo CD Erba HP Freeman SD Wei AH . Acute myeloid leukaemia. Lancet. (2023) 401:2073–86. doi: 10.1016/S 0140-6736(23)00108-3, PMID: 37068505 · doi ↗ · pubmed ↗
- 2Snaith O Poveda-Rogers C Laczko D Yang G Morrissette JJD . Cytogenetics and genomics of acute myeloid leukemia. Best Pract Res Clin Haematol. (2024) 37:101533. doi: 10.1016/j.beha.2023.101533, PMID: 38490763 · doi ↗ · pubmed ↗
- 3Estey EH . Epigenetics in clinical practice: the examples of azacitidine and decitabine in myelodysplasia and acute myeloid leukemia. Leukemia. (2013) 27:1803–12. doi: 10.1038/leu.2013.173, PMID: 23757301 · doi ↗ · pubmed ↗
- 4Alharbi RA Pettengell R Pandha HS Morgan R . The role of HOX genes in normal hematopoiesis and acute leukemia. Leukemia. (2013) 27:1000–8. doi: 10.1038/leu.2012.356, PMID: 23212154 · doi ↗ · pubmed ↗
- 5Collins CT Hess JL . Role of HOXA 9 in leukemia: dysregulation, cofactors and essential targets. Oncogene. (2016) 35:1090–8. doi: 10.1038/onc.2015.174, PMID: 26028034 PMC 4666810 · doi ↗ · pubmed ↗
- 6Roux B Picou F Debeissat C Koubi M Gallay N Hirsch P . Aberrant DNA methylation impacts HOX genes expression in bone marrow mesenchymal stromal cells of myelodysplastic syndromes and de novo acute myeloid leukemia. Cancer Gene Ther. (2022) 29:1263–75. doi: 10.1038/s 41417-022-00441-w, PMID: 35194200 · doi ↗ · pubmed ↗
- 7Xie F Zhang TJ Zhang XL Xu ZJ Qiao L Wang Y . Identification of HOXA 9 methylation as an epigenetic biomarker predicting prognosis and guiding treatment choice in acute myeloid leukemia. BMC Cancer. (2025) 25:215. doi: 10.1186/s 12885-025-13633-y, PMID: 39920624 PMC 11806540 · doi ↗ · pubmed ↗
- 8Umeda S Yamamoto K Murayama T Hidaka M Kurata M Ohshima T . Prognostic significance of HOXB 4 in de novo acute myeloid leukemia. Hematology. (2012) 17:125–31. doi: 10.1179/102453312 X 13376952196250, PMID: 22664110 · doi ↗ · pubmed ↗