Relationship between fibula free flap complications and dental implant outcomes: a retrospective cohort study
Sameh Attia, Michael Knitschke, Abanoub Riad, Mohamed Mekhemar, Kim Natalie Stolte

TL;DR
This study examines how complications from fibula free flap surgery affect dental implant outcomes and patient function.
Contribution
The study identifies specific surgical factors linked to complications and their impact on implant success and patient outcomes.
Findings
Multisegment osteotomies and longer surgery increase wound-healing defects.
Implant failure correlates with worse speech and aesthetics.
Most patients achieved good functional and aesthetic outcomes despite complications.
Abstract
To clarify how fibula free flap (FFF) complications influence clinical and functional outcomes after implant-supported oral rehabilitation. A single-center retrospective cohort of 29 patients (56.41 ± 12.74 years; 31% female, 69% male) who underwent segmental jaw resection, FFF reconstruction and subsequent implant placement (2002–2010) was analyzed. Demographic, oncologic, flap, implant-related and patient-centered functional variables were extracted; associations were tested with exact, rank and regression statistics (⍺ = 0.05). Patients received 7.14 ± 3.06 implants each and 72% were restored with telescopic overdentures. Recipient-site wound-healing defects (WHD) occurred in 31% and were independently associated with multisegment osteotomies (p = 0.012) and longer operative time (p = 0.026); partial flap loss (PFL) was infrequent (6.9%). WHD reduced maximum inter-incisal opening…
Genes, proteins, chemicals, diseases, species, mutations and cell lines named across the full text — each resolved to its canonical identifier and authoritative record.
Click any figure to enlarge with its caption.
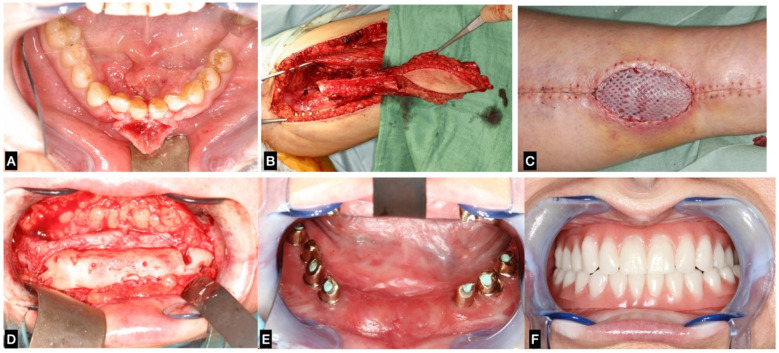 Figure 1
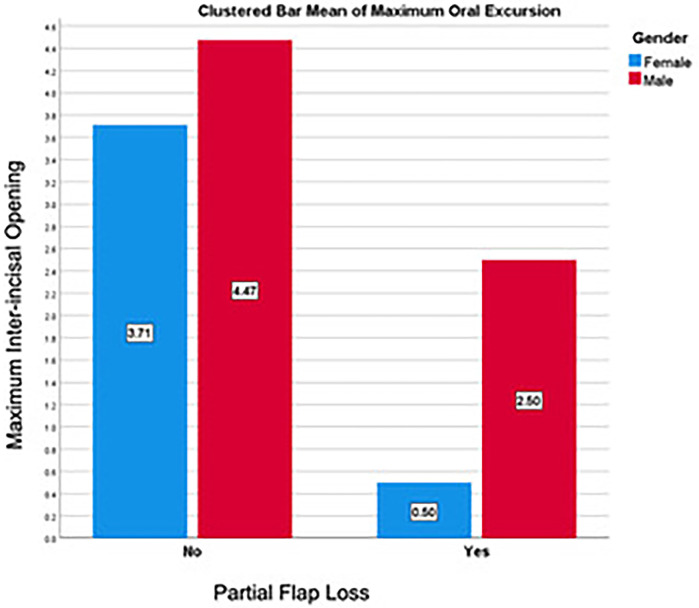 Figure 2
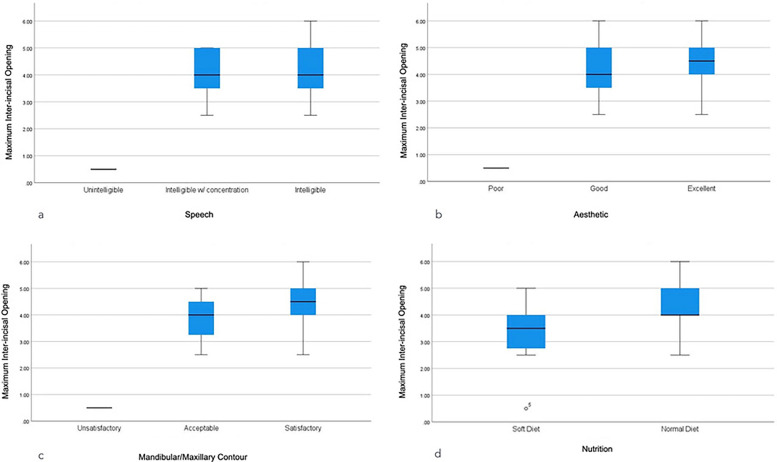 Figure 3
| Variable | Outcome | Female ( | Male ( | Total ( |
|
|---|---|---|---|---|---|
| Age | Years: µ ± SD (Min-Max) | 58.81 ± 10.75 (40.67–68.83) | 55.33 ± 13.66 (17.25–79.08) | 56.41 ± 12.74 (17.25–79.08) | 0.253 |
| Months: µ ± SD (Min-Max) | 705.78 ± 129.04 (488–826) | 664.00 ± 163.97 (207–949) | 676.97 ± 152.93 (207–949) | 0.253 | |
| Body Mass Index | BMI: µ ± SD (Min-Max) | 28.17 ± 3.96 (23.44–35.86) | 25.21 ± 3.29 (18.61–30.86) | 26.13 ± 3.71 (18.61–35.86) |
|
| Tobacco Smoking | Yes ( | 3 (33.3%) | 7 (35.0%) | 10 (34.5%) | 1.000 |
| Alcohol Drinking | Yes ( | 0 (0%) | 2 (10%) | 2 (6.9%) | 1.000 |
| Arterial Hypertension | Yes ( | 2 (22.2%) | 9 (45.0%) | 11 (37.9%) | 0.412 |
| Coronary Heart Disease | Yes ( | 0 (0%) | 3 (15.0%) | 3 (10.3%) | 0.532 |
| COPD | Yes ( | 1 (11.1%) | 7 (35.0%) | 8 (27.6%) | 0.371 |
| Diabetes Mellitus | Yes ( | 0 (0%) | 2 (10.0%) | 2 (6.9%) | 1.000 |
| Thyroid Gland Disorder | Yes ( | 1 (11.1%) | 1 (5.0%) | 2 (6.9%) | 0.532 |
| Variable | Outcome | Female ( | Male ( | Total ( |
|
|---|---|---|---|---|---|
| Tumor Type | Squamous Cell Carcinoma | 6 (66.7%) | 15 (75.0%) | 21 (72.4%) | 0.527 |
| Adenosquamous Carcinoma | 1 (11.1%) | 1 (5.0%) | 2 (6.9%) | ||
| Mucoepidermoid Carcinoma | 1 (11.1%) | 0 (0%) | 1 (3.4%) | ||
| Ameloblastoma | 0 (0%) | 2 (10.0%) | 2 (6.9%) | ||
| Osteomyelitis | 1 (11.1%) | 1 (5.0%) | 2 (6.9%) | ||
| Keratocystic Odontogenic Tumor | 0 (0%) | 1 (5.0%) | 1 (3.4%) | ||
| Stage | T: µ ± SD (Min-Max) | 2.87 ± 1.36 (1–4) | 3.07 ± 1.00 (2–4) | 3.00 ± 1.11 (1–4) | 0.764 |
| N: µ ± SD (Min-Max) | 0.75 ± 0.89 (0–2) | 0.36 ± 0.75 (0–2) | 0.50 ± 0.80 (0–2) | 0.440 | |
| Bone Defect | Length in cm: µ ± SD (Min-Max) | 7.50 ± 1.90 (5–11) | 8.03 ± 1.98 (4.5–12) | 7.86 ± 1.94 (4.5–12) | 0.255 |
| Mucosa Defect | Length in cm: µ ± SD (Min-Max) | 5.57 ± 2.88 (3–10) | 7.06 ± 2.29 (3–11) | 6.64 ± 2.50 (3–11) | 0.094 |
| Width in cm: µ ± SD (Min-Max) | 3.00 ± 1.00 (2–4) | 2.89 ± 1.13 (2–6) | 2.92 ± 1.08 (2–6) | 0.701 | |
| Overall Health | ASA: µ ± SD (Min-Max) | 2.33 ± 0.71 (1–3) | 2.05 ± 0.76 (1–3) | 2.14 ± 0.74 (1–3) | 0.390 |
| Variable | Outcome | Female ( | Male ( | Total ( |
|
|---|---|---|---|---|---|
| Flap Type | Osteomyocutaneous | 6 (66.7%) | 16 (80.0%) | 22 (75.9%) | 0.642 |
| Without Cutis | 3 (33.3%) | 4 (20.0%) | 7 (24.1%) | ||
| Reconstruction | Immediate | 6 (66.7%) | 15 (75.0%) | 21 (72.4%) | 0.675 |
| Delayed | 3 (33.3%) | 5 (25.0%) | 8 (27.6%) | ||
| Fixation Method | Miniplates | 6 (66.7%) | 18 (90.0%) | 24 (82.8%) | 0.191 |
| Reconstruction plates | 2 (22.2%) | 1 (5.0%) | 3 (10.3%) | ||
| Wire | 1 (11.1%) | 1 (5.0%) | 2 (6.9%) | ||
| Fibula Segments | One Segment | 3 (33.3%) | 9 (45.0%) | 12 (41.4%) | 0.779 |
| Two Segments | 3 (33.3%) | 7 (35.0%) | 10 (34.5%) | ||
| Three Segments | 3 (33.3%) | 4 (20.0%) | 7 (24.1%) | ||
| 2.00 ± 0.87 (1–3) | 1.75 ± 0.79 (1–3) | 1.83 ± 0.81 (1–3) | 0.501 | ||
| Fibula Osteotomies | Zero Osteotomies | 3 (33.3%) | 8 (40.0%) | 11 (37.9%) | 0.183 |
| One Osteotomy | 6 (66.7%) | 7 (35.0%) | 13 (44.8%) | ||
| Two Osteotomies | 0 (0%) | 5 (25.0%) | 5 (17.2%) | ||
| 0.67 ± 0.50 (0–1) | 0.85 ± 0.81 (0–2) | 0.79 ± 0.73 (0–2) | 0.694 | ||
| Operative Time | Minutes: µ ± SD (Min-Max) | 547.00 ± 115.40 (355–735) | 510.30 ± 111.59 (313–764) | 518.59 ± 111.41 (313–764) | 0.280 |
| ICU Duration | Days: µ ± SD (Min-Max) | 2.11 ± 2.98 (1–10) | 1.65 ± 0.99 (1–5) | 1.79 ± 1.80 (1–10) | 0.444 |
| Variable | Outcome | Female ( | Male ( | Total ( |
|
|---|---|---|---|---|---|
| Implant System | BEGO® | 5 (55.6%) | 6 (30.0%) | 11 (37.9%) | 0.385 |
| Xive® | 4 (44.4%) | 11 (55.0%) | 15 (51.7%) | ||
| Straumann® | 0 (0%) | 3 (15.0%) | 3 (10.3%) | ||
| Prosthetic Design | Fixed Bridge | 2 (22.2%) | 6 (30.0%) | 8 (27.6%) | 1.000 |
| Telescopic Denture | 7 (77.8%) | 14 (70%) | 21 (72.4%) | ||
| Number of Implants | Implants in Fibula: µ ± SD (Min-Max) | 3.67 ± 1.80 (0–6) | 4.20 ± 2.09 (0–8) | 4.03 ± 1.99 (0–8) | 0.257 |
| Implants in Native Jaw: µ ± SD (Min-Max) | 2.11 ± 2.09 (0–7) | 1.55 ± 1.82 (0–6) | 1.72 ± 1.89 (0–7) | 0.417 | |
| Implants in Oppo. Jaw: µ ± SD (Min-Max) | 0.67 ± 2.00 (0–6) | 1.70 ± 3.05 (0–8) | 1.38 ± 2.78 (0–8) | 0.532 | |
| Sleeping Implants: µ ± SD (Min-Max) | 0.22 ± 0.44 (0–1) | 0.10 ± 0.31 (0–1) | 0.14 ± 0.35 (0–1) | 0.627 | |
| Implants in Function: µ ± SD (Min-Max) | 4.56 ± 3.68 (0–12) | 6.70 ± 4.08 (0–14) | 6.03 ± 4.02 (0–14) | 0.095 | |
| Failed Implants: µ ± SD (Min-Max) | 1.67 ± 2.55 (0–6) | 0.10 ± 0.45 (0–2) | 0.59 ± 1.59 (0–6) | 0.095 | |
| Total Implants: µ ± SD (Min-Max) | 6.44 ± 2.35 (4–12) | 7.45 ± 3.33 (3–14) | 7.14 ± 3.06 (3–14) | 0.594 |
| Variable | Outcome | Female ( | Male ( | Total ( |
|
|---|---|---|---|---|---|
| Partial Flap Loss | Yes ( | 1 (11.1%) | 1 (5.0%) | 2 (6.9%) | 0.532 |
| Wound Healing Defect | Recipient Site: Yes ( | 4 (44.4%) | 5 (25.0%) | 9 (31.0%) | 0.396 |
| Donor Site: Yes ( | 4 (44.4%) | 5 (25.0%) | 9 (31.0%) | 0.396 | |
| Revision Surgery | Yes ( | 1 (11.1%) | 4 (20.0%) | 5 (17.2%) | 1.000 |
| Parameters | Variable | Outcome | Wound Healing Defect: Recipient Site |
| Wound Healing Defect: Donor Site |
| ||
|---|---|---|---|---|---|---|---|---|
| Yes ( | No ( | Yes ( | No ( | |||||
| Demographic Characteristics | Age | Years: (µ ± SD) | 54.84 ± 8.68 | 57.12 ± 14.35 | 0.332 | 63.19 ± 8.40 | 53.36 ± 13.34 |
|
| Months: (µ ± SD) | 658.11 ± 104.19 | 685.45 ± 172.20 | 0.332 | 758.33 ± 100.80 | 640.35 ± 160.13 |
| ||
| Body Mass Index | BMI: (µ ± SD) | 26.34 ± 3.75 | 26.03 ± 3.79 | 0.419 | 26.02 ± 3.72 | 26.17 ± 3.80 | 0.460 | |
| Tobacco Smoking | Yes ( | 3 (33.3%) | 7 (35%) | 1.000 | 3 (33.3%) | 7 (35%) | 1.000 | |
| Alcohol Drinking | Yes ( | 1 (11.1%) | 1 (5%) | 0.532 | 0 (0%) | 2 (10%) | 1.000 | |
| Arterial Hypertension | Yes ( | 2 (22.2%) | 9 (45%) | 0.412 | 3 (33.3%) | 8 (40%) | 1.000 | |
| CHD | Yes ( | 1 (11.1%) | 2 (10%) | 1.000 | 0 (0%) | 3 (15%) | 0.532 | |
| COPD | Yes ( | 1 (11.1%) | 7 (35%) | 0.371 | 3 (33.3%) | 5 (25%) | 0.675 | |
| Diabetes Mellitus | Yes ( | 0 (0%) | 2 (10%) | 1.000 | 0 (0%) | 2 (10%) | 1.000 | |
| Thyroid G. Disorder | Yes ( | 2 (22.2%) | 0 (0%) | 0.089 | 1 (11.1%) | 1 (5%) | 0.532 | |
| Tumor-related Characteristics | Tumor Type | Squamous Cell Carcinoma | 6 (66.7%) | 15 (75%) | 0.277 | 8 (88.9%) | 13 (65%) | 0.397 |
| Adenosquamous Carcinoma | 0 (0%) | 2 (10%) | 0 (0%) | 2 (10%) | ||||
| Mucoepidermoid Carcinoma | 1 (11.1%) | 0 (0%) | 1 (11.1%) | 0 (0%) | ||||
| Ameloblastoma | 0 (0%) | 2 (10%) | 0 (0%) | 2 (10%) | ||||
| Osteomyelitis | 1 (11.1%) | 1 (5%) | 0 (0%) | 2 (10%) | ||||
| Keratocystic O. Tumor | 1 (11.1%) | 0 (0%) | 0 (0%) | 1 (5%) | ||||
| Stage | T: (µ ± SD) | 3.14 ± 1.22 | 2.93 ± 1.10 | 0.731 | 3.11 ± 1.17 | 2.92 ± 1.12 | 0.744 | |
| N: (µ ± SD) | 0.43 ± 0.79 | 0.53 ± 0.83 | 0.837 | 0.33 ± 0.71 | 0.62 ± 0.87 | 0.512 | ||
| Bone Defect | Length in cm: (µ ± SD) | 7.33 ± 1.22 | 8.10 ± 2.17 | 0.166 | 7.56 ± 1.79 | 8.00 ± 2.03 | 0.288 | |
| Mucosa Defect | Length in cm: (µ ± SD) | 6.00 ± 3.06 | 6.89 ± 2.30 | 0.218 | 7.44 ± 2.60 | 6.19 ± 2.40 | 0.117 | |
| Width in cm: (µ ± SD) | 2.57 ± 0.79 | 3.06 ± 1.16 | 0.423 | 3.00 ± 1.00 | 2.88 ± 1.15 | 0.677 | ||
| Overall Health | ASA: (µ ± SD) | 1.89 ± 0.60 | 2.25 ± 0.79 | 0.234 | 2.44 ± 0.73 | 2.00 ± 0.73 | 0.167 | |
| Fibula Free Flap (FFF)-related Characteristics | Flap Type | Osteomyocutaneous | 5 (55.6%) | 17 (85%) | 0.158 | 9 (100%) | 13 (65%) | 0.066 |
| Without Cutis | 4 (44.4%) | 3 (15%) | 0 (0%) | 7 (35%) | ||||
| Reconstruction | Immediate | 5 (55.6%) | 16 (80%) | 0.209 | 8 (88.9%) | 13 (65%) | 0.371 | |
| Delayed | 4 (44.4%) | 4 (20%) | 1 (11.1%) | 7 (35%) | ||||
| Fixation Method | MP | 7 (77.8%) | 17 (85%) | 0.295 | 7 (77.8%) | 17 (85%) | 0.780 | |
| RP | 2 (22.2%) | 1 (5%) | 1 (11.1%) | 2 (10%) | ||||
| Wire | 0 (0%) | 2 (10%) | 1 (11.1%) | 1 (5%) | ||||
| Fibula Segments | One Segment | 5 (55.6%) | 7 (35%) |
| 5 (55.6%) | 7 (35%) | 0.461 | |
| Two Segments | 0 (0%) | 10 (50%) | 3 (33.3%) | 7 (35%) | ||||
| Three Segments | 4 (44.4%) | 3 (15%) | 1 (11.1%) | 6 (30%) | ||||
| 1.89 ± 1.05 | 1.80 ± 0.70 | 0.945 | 1.56 ± 0.73 | 1.95 ± 0.83 | 0.274 | |||
| Fibula Osteotomies | Zero Osteotomies | 5 (55.6%) | 6 (30%) | 0.122 | 4 (44.4%) | 7 (35%) | 1.000 | |
| One Osteotomy | 3 (33.3%) | 10 (50%) | 4 (44.4%) | 9 (45%) | ||||
| Two Osteotomies | 1 (11.1%) | 4 (20%) | 1 (11.1%) | 4 (20%) | ||||
| 0.56 ± 0.73 | 0.90 ± 0.72 | 0.274 | 0.67 ± 0.71 | 0.85 ± 0.75 | 0.594 | |||
| Operative Time | Minutes: (µ ± SD) | 577.33 ± 123.63 | 492.15 ± 97.39 |
| 520 ± 102.97 | 517.95 ± 117.58 | 0.482 | |
| ICU Duration | Days: (µ ± SD) | 2.22 ± 2.95 | 1.60 ± 1.00 | 0.871 | 2.67 ± 3.04 | 1.40 ± 0.60 | 0.501 | |
| Implant-related Characteristics | Implant System | BEGO® | 2 (22.2%) | 9 (45%) | 0.618 | 5 (55.6%) | 6 (30%) | 0.385 |
| Xive® | 6 (66.7%) | 9 (45%) | 3 (33.3%) | 12 (60%) | ||||
| Straumann® | 1 (11.1%) | 2 (10%) | 1 (11.1%) | 2 (10%) | ||||
| Prosthetic Design | Fixed Bridge | 3 (33.3%) | 5 (25%) | 0.675 | 3 (33.3%) | 5 (25%) | 0.675 | |
| Telescopic Denture | 6 (66.7%) | 15 (75%) | 6 (66.7%) | 15 (75%) | ||||
| Number of Implants | In Fibula: (µ ± SD) | 3.78 ± 1.99 | 4.15 ± 2.03 | 0.325 | 3.44 ± 2.01 | 4.30 ± 1.98 | 0.146 | |
| In Native Jaw: (µ ± SD) | 1.89 ± 2.26 | 1.65 ± 1.76 | 0.379 | 2.22 ± 2.33 | 1.50 ± 1.67 | 0.175 | ||
| In Oppo. Jaw: (µ ± SD) | 3.00 ± 3.61 | 0.65 ± 2.01 | 0.140 | 0.78 ± 2.33 | 1.65 ± 2.96 | 0.594 | ||
| Sleeping Implants: (µ ± SD) | N/A | 0.20 ± 0.41 | 0.417 | 0.33 ± 0.50 | 0.05 ± 0.22 | 0.234 | ||
| In Function: (µ ± SD) | 7.89 ± 5.01 | 5.20 ± 3.30 | 0.084 | 5.67 ± 3.16 | 6.20 ± 4.42 | 0.374 | ||
| Failed Implants: (µ ± SD) | 0.78 ± 1.99 | 0.50 ± 1.43 | 0.799 | 0.44 ± 0.88 | 0.65 ± 1.84 | 0.799 | ||
| Total Implants: (µ ± SD) | 8.67 ± 4.06 | 6.45 ± 2.28 | 0.078 | 6.44 ± 2.79 | 7.45 ± 3.19 | 0.211 | ||
| Implant Survival | Failure | 2 (22.2%) | 3 (15%) | 0.633 | 2 (22.2%) | 3 (15%) | 0.633 | |
| Survival | 7 (77.8%) | 17 (85%) | 7 (77.8%) | 17 (85%) | ||||
| Variable | Outcome | Female ( | Male ( | Total ( |
|
|---|---|---|---|---|---|
| Speech | Unintelligible | 1 (12.5%) | 0 (0%) | 1 (3.6%) | 0.389 |
| Intelligible with concentration | 2 (25.0%) | 5 (25.0%) | 7 (25.0%) | ||
| Intelligible | 5 (62.5%) | 15 (75.0%) | 20 (71.4%) | ||
| Dental Aesthetic | Poor | 1 (12.5%) | 0 (0%) | 1 (3.6%) | 0.383 |
| Good | 6 (75.0%) | 15 (75.0%) | 21 (75.0%) | ||
| Excellent | 1 (12.5%) | 5 (25.0%) | 6 (21.4%) | ||
| Mandibular—Maxillary Contour | Unsatisfactory | 1 (12.5%) | 0 (0%) | 1 (3.6%) | 0.253 |
| Acceptable | 2 (25.0%) | 9 (45.0%) | 11 (39.3%) | ||
| Satisfactory | 5 (62.5%) | 11 (55.0%) | 16 (57.1%) | ||
| Nutrition | Soft Diet | 3 (37.5%) | 4 (20.0%) | 7 (25.0%) | 0.371 |
| Normal Diet | 5 (62.5%) | 16 (80.0%) | 21 (75.0%) | ||
| Maximum inter-incisal opening | µ ± SD (Min-Max) | 3.31 ± 1.36 (0.50–5.00) | 4.38 ± 0.99 (2.50–6.00) | 4.07 ± 1.18 (0.50–6.00) |
|
| Parameters | Variable | Outcome | Speech |
| Dental Aesthetic |
| ||||
|---|---|---|---|---|---|---|---|---|---|---|
| Unintelligible ( | Unintelligible w/ C. ( | Intelligible ( | Poor ( | Good ( | Excellent ( | |||||
| Demographic Characteristics | Age | Years: (µ ± SD) | 62.75 ± 0 | 59.48 ± 7.25 | 55.76 ± 14.33 | 0.732 | 62.75 ± 0 | 59.56 ± 10.15 | 46.79 ± 17.14 | 0.079 |
| Months: (µ ± SD) | 753 ± 0 | 713.71 ± 87.03 | 669.10 ± 171.98 | 0.732 | 753 ± 0 | 714.71 ± 121.76 | 561.50 ± 205.78 | 0.079 | ||
| Body Mass Index | BMI: (µ ± SD) | 27.64 ± 0 | 27.78 ± 2.18 | 25.61 ± 4.12 | 0.402 | 27.64 ± 0 | 25.98 ± 3.45 | 26.84 ± 5.19 | 0.831 | |
| Tobacco Smoking | Yes ( | 1 (100%) | 3 (42.9%) | 6 (30%) | 0.468 | 1 (100%) | 7 (33.3%) | 2 (33.3%) | 0.456 | |
| Alcohol Drinking | Yes ( | 0 (0%) | 1 (14.3%) | 1 (5%) | 0.497 | 0 (0%) | 1 (4.8%) | 1 (16.7%) | 0.444 | |
| Arterial Hypertension | Yes ( | 0 (0%) | 3 (42.9%) | 8 (40%) | 1.000 | 0 (0%) | 10 (47.6%) | 1 (16.7%) | 0.355 | |
| CHD | Yes ( | 0 (0%) | 1 (14.3%) | 2 (10%) | 1.000 | 0 (0%) | 2 (9.5%) | 1 (16.7%) | 0.594 | |
| COPD | Yes ( | 0 (0%) | 1 (14.3%) | 7 (35%) | 0.738 | 0 (0%) | 6 (28.6%) | 2 (33.3%) | 1.000 | |
| Diabetes Mellitus | Yes ( | 0 (0%) | 1 (14.3%) | 1 (5%) | 0.497 | 0 (0%) | 2 (9.5%) | 0 (0%) | 1.000 | |
| Thyroid G. Disorder | Yes ( | 0 (0%) | 0 (0%) | 2 (10%) | 1.000 | 0 (0%) | 2 (9.5%) | 0 (0%) | 1.000 | |
| Tumor-related Characteristics | Tumor Type | Squamous Cell Carcinoma | 1 (100%) | 6 (85.7%) | 14 (70%) | 0.751 | 1 (100%) | 16 (76.2%) | 4 (66.7%) | 0.745 |
| Adenosquamous Carcinoma | 0 (0%) | 1 (14.3%) | 0 (0%) | 0 (0%) | 1 (4.8%) | 0 (0%) | ||||
| Mucoepidermoid Carcinoma | 0 (0%) | 0 (0%) | 1 (5%) | 0 (0%) | 1 (4.8%) | 0 (0%) | ||||
| Ameloblastoma | 0 (0%) | 0 (0%) | 2 (10%) | 0 (0%) | 1 (4.8%) | 1 (16.7%) | ||||
| Osteomyelitis | 0 (0%) | 0 (0%) | 2 (10%) | 0 (0%) | 1 (4.8%) | 1 (16.7%) | ||||
| Keratocystic O. Tumor | 0 (0%) | 0 (0%) | 1 (5%) | 0 (0%) | 1 (4.8%) | 0 (0%) | ||||
| Stage | T: (µ ± SD) | 1 ± 0 | 3.29 ± 0.95 | 3.08 ± 1.12 | 0.215 | 1 ± 0 | 3 ± 1.10 | 3.75 ± 0.50 | 0.119 | |
| N: (µ ± SD) | N/A | 0.71 ± 0.95 | 0.46 ± 0.78 | 0.651 | N/A | 0.50 ± 0.82 | 0.75 ± 0.96 | 0.713 | ||
| Bone Defect | Length in cm: (µ ± SD) | 7 ± 0 | 8.71 ± 1.70 | 7.45 ± 1.90 | 0.293 | 7 ± 0 | 7.62 ± 1.82 | 8.33 ± 2.25 | 0.672 | |
| Mucosa Defect | Length in cm: (µ ± SD) | 4 ± 0 | 8 ± 2.58 | 6.24 ± 2.33 | 0.164 | 4 ± 0 | 6.68 ± 2.45 | 7 ± 2.92 | 0.562 | |
| Width in cm: (µ ± SD) | 3 ± 0 | 3.29 ± 0.76 | 2.77 ± 1.20 | 0.578 | 3 ± 0 | 3.11 ± 1.15 | 2.20 ± 0.45 | 0.212 | ||
| Overall Health | ASA: (µ ± SD) | 2 ± 0 | 2.29 ± 0.76 | 2.15 ± 0.75 | 0.892 | 2 ± 0 | 2.19 ± 0.75 | 2.17 ± 0.75 | 0.941 | |
| Fibula Free Flap (FFF) Characteristics | Flap Type | Osteomyocutaneous | 0 (0%) | 7 (100%) | 15 (75%) | 0.080 | 0 (0%) | 18 (85.7%) | 4 (66.7%) | 0.074 |
| Without Cutis | 1 (100%) | 0 (0%) | 5 (25%) | 1 (100%) | 3 (14.3%) | 2 (33.3%) | ||||
| Reconstruction | Immediate | 0 (0%) | 7 (100%) | 13 (65%) |
| 0 (0%) | 14 (66.7%) | 6 (100%) | 0.076 | |
| Delayed | 1 (100%) | 0 (0%) | 7 (35%) | 1 (100%) | 7 (33.3%) | 0 (0%) | ||||
| Fixation Method | MP | 0 (0%) | 7 (100%) | 16 (80%) | 0.237 | 0 (0%) | 17 (81%) | 6 (100%) | 0.245 | |
| RP | 1 (100%) | 0 (0%) | 2 (10%) | 1 (100%) | 2 (9.5%) | 0 (0%) | ||||
| Wire | 0 (0%) | 0 (0%) | 2 (10%) | 0 (0%) | 2 (9.5%) | 0 (0%) | ||||
| Fibula Segments | One Segment | 1 (100%) | 3 (42.9%) | 8 (40%) | 0.940 | 1 (100%) | 10 (47.6%) | 1 (16.7%) | 0.371 | |
| Two Segments | 0 (0%) | 3 (42.9%) | 6 (30%) | 0 (0%) | 7 (33.3%) | 2 (33.3%) | ||||
| Three Segments | 0 (0%) | 1 (14.3%) | 6 (30%) | 0 (0%) | 4 (19%) | 3 (50%) | ||||
| 1 ± 0 | 1.71 ± 0.76 | 1.90 ± 0.85 | 0.537 | 1 ± 0 | 1.71 ± 0.78 | 2.33 ± 0.82 | 0.158 | |||
| Fibula Osteotomies | Zero Osteotomies | 0 (0%) | 2 (28.6%) | 9 (45%) | 0.827 | 0 (0%) | 9 (42.9%) | 2 (33.3%) | 0.750 | |
| One Osteotomy | 1 (100%) | 3 (42.9%) | 8 (40%) | 1 (100%) | 9 (42.9%) | 2 (33.3%) | ||||
| Two Osteotomies | 0 (0%) | 2 (28.6%) | 3 (15%) | 0 (0%) | 3 (14.3%) | 2 (33.3%) | ||||
| 1 ± 0 | 1 ± 0.82 | 0.70 ± 0.73 | 0.641 | 1 ± 0 | 0.71 ± 0.72 | 1 ± 0.89 | 0.691 | |||
| Operative Time | Minutes: (µ ± SD) | 517 ± 0 | 554.29 ± 121.05 | 511.75 ± 111.76 | 0.700 | 517 ± 0 | 497.57 ± 102.30 | 611 ± 114.27 | 0.084 | |
| ICU Duration | Days: (µ ± SD) | 1 ± 0 | 1.57 ± 0.79 | 1.95 ± 2.11 | 0.817 | 1 ± 0 | 2 ± 2.07 | 1.33 ± 0.52 | 0.615 | |
| FFF Complications | Partial Flap Loss | Yes | 1 (100%) | 0 (0%) | 1 (5%) | 0.071 | 1 (100%) | 1 (4.8%) | 0 (0%) | 0.111 |
| No | 0 (0%) | 7 (100%) | 19 (95%) | 0 (0%) | 20 (95.2%) | 6 (100%) | ||||
| WHD Recipient Site | Yes | 1 (100%) | 1 (14.3%) | 7 (35%) | 0.322 | 1 (100%) | 5 (23.8%) | 3 (50%) | 0.195 | |
| No | 0 (0%) | 6 (85.7%) | 13 (65%) | 0 (0%) | 16 (76.2%) | 3 (50%) | ||||
| WHD Donor Site | Yes | 0 (0%) | 3 (42.9%) | 6 (30%) | 0.764 | 0 (0%) | 8 (38.1%) | 1 (16.7%) | 0.747 | |
| No | 1 (100%) | 4 (57.1%) | 14 (70%) | 1 (100%) | 13 (61.9%) | 5 (83.3%) | ||||
| Revision Surgery | Yes | 0 (0%) | 2 (28.6%) | 3 (15%) | 0.655 | 0 (0%) | 5 (23.8%) | 0 (0%) | 0.635 | |
| No | 1 (100%) | 5 (71.4%) | 17 (85%) | 1 (100%) | 16 (76.2%) | 6 (100%) | ||||
| Implant-related Characteristics | Implant System | BEGO® | 0 (0%) | 5 (71.4%) | 6 (30%) | 0.100 | 0 (0%) | 10 (47.6%) | 1 (16.7%) | 0.439 |
| Xive® | 1 (100%) | 1 (14.3%) | 12 (60%) | 1 (100%) | 9 (42.9%) | 4 (66.7%) | ||||
| Straumann® | 0 (0%) | 1 (14.3%) | 2 (10%) | 0 (0%) | 2 (9.5%) | 1 (16.7%) | ||||
| Prosthetic Design | Fixed Bridge | 0 (0%) | 1 (14.3%) | 6 (30%) | 0.725 | 0 (0%) | 5 (23.8%) | 2 (33.3%) | 0.725 | |
| Telescopic Denture | 1 (100%) | 6 (85.7%) | 14 (70%) | 1 (100%) | 16 (76.2%) | 4 (66.7%) | ||||
| Number of Implants | In Fibula: (µ ± SD) | 4 ± 0 | 5.57 ± 1.27 | 3.60 ± 2.01 | 0.073 | 4 ± 0 | 4.29 ± 2.17 | 3.50 ± 1.38 | 0.709 | |
| In Native Jaw: (µ ± SD) | 2 ± 0 | 1 ± 0.82 | 1.95 ± 2.19 | 0.542 | 2 ± 0 | 1.90 ± 2.10 | 1 ± 1.27 | 0.607 | ||
| In Oppo. Jaw: (µ ± SD) | N/A | 1 ± 2.65 | 1.65 ± 2.96 | 0.775 | N/A | 0.95 ± 2.40 | 3.33 ± 3.72 | 0.165 | ||
| Sleeping Implants: (µ ± SD) | N/A | 0.14 ± 0.38 | 0.15 ± 0.37 | 0.919 | N/A | 0.14 ± 0.36 | 0.17 ± 041 | 0.911 | ||
| In Function: (µ ± SD) | N/A | 5.14 ± 4.78 | 6.75 ± 3.70 | 0.214 | N/A | 5.95 ± 3.78 | 7.67 ± 4.72 | 0.212 | ||
| Failed Implants: (µ ± SD) | 6 ± 0 | 1.43 ± 2.23 | 0.05 ± 0.22 |
| 6 ± 0 | 0.52 ± 1.40 | N/A |
| ||
| Total Implants: (µ ± SD) | 6 ± 0 | 7.57 ± 2.57 | 7.20 ± 3.32 | 0.890 | 6 ± 0 | 7.14 ± 2.58 | 7.83 ± 4.79 | 0.825 | ||
| Implant Survival | Failure | 1 (100%) | 3 (42.9%) | 1 (5%) |
| 0 (0%) | 17 (81%) | 6 (100%) | 0.143 | |
| Survival | 0 (0%) | 4 (57.1%) | 19 (95%) | 1 (100%) | 4 (19%) | 0 (0%) | ||||
| Variable | Outcome | MIO (4.07 ± 1.18) |
|
|---|---|---|---|
| Tobacco Smoking | Yes | 4.35 ± 1.49 | 0.182 |
| No | 3.92 ± 0.99 | ||
| Alcohol Drinking | Yes | 4 ± 0 | 0.894 |
| No | 4.08 ± 1.23 | ||
| Arterial Hypertension | Yes | 4.18 ± 1.03 | 0.350 |
| No | 4 ± 1.30 | ||
| Coronary Heart Disease | Yes | 4.67 ± 0.58 | 0.183 |
| No | 4 ± 1.22 | ||
| COPD | Yes | 4.19 ± 1.10 | 0.375 |
| No | 4.03 ± 1.24 | ||
| Diabetes Mellitus | Yes | 4.25 ± 1.06 | 1.000 |
| No | 4.06 ± 1.21 | ||
| Thyroid Gland Disorder | Yes | 4 ± 0 | 0.894 |
| No | 4.08 ± 1.23 | ||
| Tumor Type | Squamous Cell Carcinoma | 3.93 ± 1.26 | 0.695 |
| Adenosquamous Carcinoma | 4 ± 0 | ||
| Mucoepidermoid Carcinoma | 4 ± 0 | ||
| Ameloblastoma | 4.25 ± 1.06 | ||
| Osteomyelitis | 4.50 ± 0.71 | ||
| Keratocystic Odontogenic Tumor | 6 ± 0 | ||
| Flap Type | Osteomyocutaneous | 4.14 ± 0.98 | 0.294 |
| Without Cutis | 3.83 ± 1.86 | ||
| Reconstruction | Immediate | 4 ± 1.63 | 0.422 |
| Delayed | 4.10 ± 1.01 | ||
| Fixation Method | MP | 4.30 ± 1.02 | 0.055 |
| RP | 2.67 ± 1.89 | ||
| Wire | 3.50 ± 0 | ||
| Fibula Segments | One Segment | 3.50 ± 1.37 | 0.054 |
| Two Segments | 4.72 ± 0.75 | ||
| Three Segments | 4.21 ± 0.91 | ||
| Fibula Osteotomies | Zero Osteotomies | 3.86 ± 1.19 | 0.322 |
| One Osteotomy | 3.95 ± 1.34 | ||
| Two Osteotomies | 4.80 ± 0.45 | ||
| Implant System | BEGO® | 3.73 ± 0.93 | 0.112 |
| Xive® | 4.07 ± 1.31 | ||
| Straumann® | 5.33 ± 0.58 | ||
| Prosthetic Design | Fixed Bridge | 3.93 ± 1.27 | 0.360 |
| Telescopic Denture | 4.12 ± 1.18 | ||
| Implant Survival | Failure | 3.30 ± 1.72 | 0.055 |
| Survival | 4.24 ± 1.01 | ||
| Partial Flap Loss | Yes | 1.50 ± 1.41 |
|
| No | 4.27 ± 0.93 | ||
| Wound Healing Defect: Recipient Site | Yes | 3.50 ± 1.52 |
|
| No | 4.34 ± 0.91 | ||
| Wound Healing Defect: Donor Site | Yes | 4.06 ± 0.85 | 0.481 |
| No | 4.08 ± 1.34 | ||
| Revision Surgery | Yes | 4.30 ± 1.10 | 0.321 |
| No | 4.02 ± 1.22 | ||
| Speech | Unintelligible | 0.50 ± 0 |
|
| Intelligible with concentration | 4.07 ± 1.02 | ||
| Intelligible | 4.25 ± 0.98 | ||
| Dental Aesthetic | Poor | 0.50 ± 0 |
|
| Good | 4.14 ± 0.92 | ||
| Excellent | 4.42 ± 1.20 | ||
| Mandibular—Maxillary Contour | Unsatisfactory | 0.50 ± 0 |
|
| Acceptable | 3.82 ± 0.93 | ||
| Satisfactory | 4.47 ± 0.94 | ||
| Nutrition | Soft Diet | 3.21 ± 1.44 |
|
| Normal Diet | 4.36 ± 0.96 |
| Predictor | Estimate | SE | Z |
|
|---|---|---|---|---|
| Operative Time | −0.00132 | 0.00537 | −0.245 | 0.806 |
| Fibula Segments: 1 vs. 3 | −12.99401 | 1.08273 | −12.001 |
|
| Fibula Segments: 2 vs. 3 | −12.73819 | 1.01178 | −12.590 |
|
Peer Reviews
No public reviews on file for this paper yet. If you reviewed it on a platform where reviews are public (OpenReview, ICLR, NeurIPS, ICML), you can paste yours below so the community can read it here.
Videos
No videos yet. Explain this paper in a talk, walkthrough, or lecture? Add one.
Taxonomy
TopicsReconstructive Surgery and Microvascular Techniques · Dental Implant Techniques and Outcomes · Periodontal Regeneration and Treatments
Introduction
Segmental mandibular defects arising from ablative surgery of benign or malign tumors, osteomyelitis, or trauma significantly impair oral function, aesthetics and quality of life, often necessitating complex reconstructive procedures (1, 2). The vascularized fibula free flap (FFF), introduced for mandible reconstruction by Hidalgo in 1989, has become widely accepted as the gold standard for mandibular reconstruction owing to its reliable vascular supply, robust cortical bone, minimal donor-site morbidity and ability to tolerate osteotomies and dental implants (3, 4).
Dental implants represent a valuable approach to oral rehabilitation in patients following cancer treatment (5–8). Although, success rates for implant in FFF-reconstructed mandibles are reported to be approximately 92%–94%, factors such as smoking and irradiated bone have been shown to significantly increase the risk of failure (9–11).
Despite favorable implant outcomes and overall flap success rates of approximately 90%, the reconstructive process remains vulnerable to complications. Wound-healing defects (WHD) at both recipient and donor site can compromise surgical success and delay or even hold up prosthetic rehabilitation (12). Donor-site complications have been characterized, with alcohol abuse and technique of donor-site closure emerging as significant risk factors for WHD following FFF harvesting (13).
Beyond surgical flap and implant outcomes, current evidence emphasizes the importance of patient-centered functional outcomes, including speech intelligibility, mastication, aesthetic perception, and overall quality of life (6, 14, 15). Here, improved health-related quality of life in patients restored with FFF and patient-specific titanium implants has been reported (16). Although not every patient undergoing mandibular reconstruction with FFF ultimately receives dental implants, satisfaction with aesthetic and functional results in implant-rehabilitated patients has been reported to be approximately 80%, highlighting dental implants as a valuable option for oral rehabilitation (15).
While recent research identifies various predictors of implantation success and complications following mandibular reconstruction, comprehensive analyses that integrate patient demographics, tumor characteristics, flap- and implant-related variables, as well as surgical and patient-centered functional outcomes, remain limited. The aim of the present study is to evaluate the relationship between fibula free flap-related complications and both clinical and functional outcomes of dental implant rehabilitation.
Materials & methods
Study design and setting
A single-center retrospective cohort study was conducted at the Department of Oral and Maxillofacial Surgery, University Hospital of Giessen and Marburg (UKGM), Giessen, Germany. This study was designed and reported according to the Strengthening the Reporting of Observational Studies in Epidemiology (STROBE) guidelines for cohort studies (17).
Study period, participants, inclusion, and exclusion criteria
All patients underwent ablative surgery and FFF reconstruction with dental implant rehabilitation between January 2002 and December 2010. Inclusion criteria: the placement of at least one dental implant in the fibular graft and documentation of ≥ one follow-up visit after definitive prosthetic loading. Patients who did not receive dental implants or had mandibular reconstruction using other than FFF were not included in the study. Patients with cancer recurrence before implantation were excluded, as were those missing information on the study parameters. Standardized recall examinations were performed. As the postoperative follow-up period was not uniform across all patients, only cases with complete and well-documented follow-up data were included in the analysis, while cases with missing or incomplete data were excluded.
Variables
Data collection encompassed the following domains: (i) sociodemographic and general anamnesis: sex, age, body mass index (BMI), tobacco and alcohol consumption, systemic comorbidities and American Society of Anesthesiologists (ASA) classification; (ii) tumor characteristics: histopathological entity, stage, defect morphology (18); (iii) FFF reconstruction characteristics: flap type, timing (immediate, delayed), number of osseous segments and osteotomies, fixation modality, operative time (min) and postoperative intensive-care-unit (ICU) stay (days); (iv) implant variables: system and number of implants (in fibula, native bone, opposite jaw), number of failed implants, prosthetic design; (v) postoperative complications: partial flap loss (PFL), recipient-site and donor-site WHD and requirement for revision surgery; (vi) patient-centered functional outcomes (patients' own self-assessment): speech intelligibility, perceived dental aesthetics, mandibular-maxillary contour, dietary consistency and maximum inter-incisal opening (MIO).
Evaluation of patient-reported speech intelligibility, dental aesthetics, mandibular–maxillary contour, and nutritional function
Speech and dental aesthetics were assessed based on patients' self-evaluation using a structured questionnaire. The evaluation included four parameters: speech intelligibility, dental aesthetics, mandibular–maxillary contour, and nutrition.
Speech intelligibility was rated by patients as unintelligible, intelligible with concentration, or intelligible.
Dental aesthetics were self-assessed as poor, good, or excellent.
The mandibular–maxillary contour was rated as unsatisfactory, acceptable, or satisfactory.
Nutritional ability was categorized as soft diet or normal diet.
These self-assessments were collected during postoperative follow-up visits to reflect patients' subjective perception of their functional and aesthetic outcomes.
Statistical methods
Initially, normal distribution of numerical variables, e.g., age, BMI and number of implants was tested using Shapiro–Wilk test with a significance level of p < 0.05. Descriptive statistics had been performed using frequencies and percentages for categorical (e.g., gender) and ordinal variables (e.g., mandibular-maxillary contour), and mean and standard deviation for numerical variables. Fisher's exact test, Mann–Whitney (U) test, Kruskal–Wallis (H) test, independent samples t-test, and one-way analysis of variance (ANOVA) test were used to test the hypothesized associations between independent and dependent variables. All inferential tests were conducted with a significance level of p < 0.05. An ordinal logistic regression model was established to examine the clinical predictors of mandibular-maxillary contour, including operative time and the number of fibula segments as independent variables. All statistical analyses were carried out using Statistical Package for the Social Sciences (SPSS) version 28 and the R-based web application Jamovi version 2.3).
Ethics statement/confirmation of patients' permission
The Ethics committee of the faculty of medicine of Justus-Liebig University Giessen approved the study with the confirmation numbers (25/10, 5/20). Patients' consent was obtained from every included patient in the study.
Results
Sample characteristics
A total of twenty-nine patients were included in this study, of whom nine were females and twenty were male. The mean age at the time of surgery was 56.41 ± 12.74 years, ranging between 17.25 and 79.08 years. The mean body mass index was 26.13 ± 3.71 kg/m^2^ and was significantly higher in female than in male patients (28.17 ± 3.96 kg/m^2^ and 25.21 ± 3.29 kg/m^2^, p = 0.022), respectively.
Over one-third (34.5%) of the patients were smokers, and the most commonly reported systemic comorbidity was arterial hypertension (37.9%), followed by chronic obstructive pulmonary disease (27.6%), and coronary heart disease (10.3%) (Table 1). Figure 1 Representative clinical case included in the study, demonstrating the sequence from initial diagnosis to final dental rehabilitation.
Clinical case of jaw reconstruction with FFF: (A) squamous cell carcinoma of the anterior mandible; (B) raising of the FFF; (C) result at donor site with well-healed skin graft being mashed; (D) after bone graft healing; (E,F) dental and oral rehabilitation achieved through dental implant placement and overdenture prosthesis.
Tumor-related characteristics
The predominant diagnosis was squamous-cell carcinoma (72.4%), followed by adenosquamous carcinoma (6.9%), ameloblastoma (6.9%), and osteomyelitis (6.9%). Tumor staging was assessed according to the AJCC TNM Classification, 7th edition, and revealed comparable results between female and male patients, with a mean T stage of 2.87 ± 1.36 and 3.07 ± 1.00, respectively, and a mean N stage of 0.75 ± 0.89 and 0.36 ± 0.75, respectively. No statistically significant sex-related differences were observed for either T or N stage. The mean bone defect length was 7.86 ± 1.94 cm, ranging between 4.5 and 12 cm, whereas the mean mucosal defect length and width were 6.64 ± 2.50 cm and 2.92 ± 1.08 cm, respectively. Evaluation of general health status using the American Society of Anesthesiologists (ASA) classification revealed comparable scores for female and male patients (2.33 ± 0.71 and 2.05 ± 0.74, respectively; Table 2).
Flap-related characteristics
Approximately three-quarters of the patients (75.9%) received osteomyocutaneous fibula flaps, whereas the remaining 24.1% were reconstructed using flaps without cutis. Twenty-one patients (72.4%) underwent immediate reconstruction. The most common fixation method was miniplates (MP) (82.8%), followed by reconstruction plates (RP) (10.3%) and wires (6.9%). Fewer than one quarter (24.1%) of the patients received three-segment fibula flaps, whereas 34.5% received two-segment and 41.4% single-segment flaps. The average number of segments was 1.83 ± 0.81, with no significant difference between female and male patients (2 ± 0.87 and 1.75 ± 0.79, p = 0.501), respectively.
The average operative time was 518.59 ± 111.41 min ranging between 313 and 764 min, with no statically significant difference between male and female patients (547 ± 115.40, 510.30 ± 111.59, p = 0.280), respectively. The average duration of stay at intensive care (ICU) was 1.79 ± 1.80 days (Table 3).
Implant-related characteristics
The most utilized implant system was Xive (DENTSPY SIRONA Inc., Charlotte, North Carolina, USA) (51.7%), followed by BEGO (BEGO GmbH & Co. KG, Bremen, Germany) (37.9%), and Straumann (Straumann Group, Basel, Switzerland) (10.3%). Twenty-one patients (72.4%) were rehabilitated with telescopic dentures and eight (27.6%) received fixed bridges.
The average total number of inserted implants was 7.14 ± 3.06 (range 3–14); female patients received fewer implants than male patients (6.44 ± 2.35, 7.45 ± 3.33), respectively. On average, 4.03 ± 1.99 implants were inserted into the fibular graft, 1.72 ± 1.89 into native bone, and 1.38 ± 2.78 into the opposing jaw. The majority of implants (6.03 ± 4.02) were in function, whereas 0.14 ± 0.35 remained dormant (sleeping implants). Female patients not only had fewer implants in function (4.56 vs. 6.70), but also more failed implants (1.67 vs. 0.10) than their male counterparts (Table 4).
Flap-related complications
Two patients (6.9%) experienced PFL. A total of nine patients (31%) presented with WHD at the recipient site, and nine (31%) likewise exhibited defects at the donor site. Five patients (17.2%) required revision surgeries. No statistically significant differences were observed between male and female patients in PFL, WHD and revision surgery (p = 0.532, 0.396, and 1.000, respectively, Table 5).
On evaluating the preemptive risk factors of WHD at recipient site, age, BMI, tobacco smoking, alcohol consumption, systemic comorbidities, tumor type, tumor stage, and bone and mucosal defect dimensions had no significant associations with WHD at recipient sites. The mean ASA class was slightly lower in patients with WHD than in those without (1.89 vs. 2.25). Delayed reconstruction (44.4% vs. 20%) and flaps without cutis (44.4% vs. 15%) were associated with a higher incidence of WHD. A greater number of fibula segments and a longer operative time were also significantly correlated with WHD (p = 0.012 and 0.028, respectively). The number of implants was not significantly associated with WHD at recipient site (Table 6).
At the donor site, higher age was significantly associated with WHD, with an approximately ten-year gap between those who had WHD and those who had no WHD (63.19 ± 8.4, 53.36 ± 13.34, p = 0.026), respectively. BMI, tobacco smoking, alcohol consumption, systemic comorbidities, tumor type and stage, bone and mucosal defects dimensions, and ASA score had no association with healing defects at donor site. Similarly, fibula type, reconstruction time, fixation method, number of segments, operative time and ICU durations, implant system, prosthetic design, and number of implants were not significantly associated with WHD at donor site (Table 6).
For PFL and revision surgery, age was associated with higher odds of incidence; however, the association was not statistically significant (p = 0.227 and 0.128, respectively). No other investigated variable was significantly linked to these two particular complications (Table 6).
Speech, aesthetic, and nutrition
The majority of patients displayed intelligible speech (71.4%), whereas 25% were intelligible with concentration. Dental aesthetics was rated excellent in six patients (21.4%), good in twenty-one (75%) had good, and poor in one (3.6%). The mandibular-maxillary contour was rated satisfactory in 57.1% of cases, acceptable in 39.3% and unsatisfactory in 3.6%. One-quarter of the cohort (25%) reported a soft diet; the remaining patients reported a normal diet. There was no significant association between gender and speech, aesthetic or nutrition (Table 7).
Delayed reconstruction, a higher number of failed implants, and lower implant survival were significantly associated with poorer speech performance (p = 0.047, 0.004 and 0.015, respectively). Similarly, the number of failed implants was significantly associated with lower dental-aesthetic scores (p = 0.032, Table 8).
A higher number of fibula segments and fewer failed implants were significantly associated with improved perceptions of mandibular-maxillary contour (p = 0.041 and 0.019). PFL and recipient-site WDH were significantly associated with lower levels of mandibular-maxillary contour (p = 0.029 and 0.037). Patients adhering to a soft diet tended to be older (59.30 vs. 56.15), to have a higher BMI (27.80 vs. 25.70 kg/m^2^), to experience a higher incidence of PFL (28.6% vs. 0%), and to show a higher mean number of failed implants (2 vs. 0.14), without statistical significance (Table 8).
Maximum inter-incisal opening (MIO)
The average MIO was 4.07 ± 1.18 cm (0.5–6). Male patients showed significantly greater MIO than female patients (4.38 ± 0.99 cm and 3.31 ± 1.36 cm, p = 0.015, Table 7).
Patients with PFL exhibited a significantly lower MIO than those without PFL (1.50 ± 1.41 cm, 4.27 ± 0.93 cm, p < 0.001, Figure 2). Recipient-site WHD were likewise associated with a reduced MIO (3.50 cm vs. 4.34 cm, p = 0.039). Patients whose speech was intelligible demonstrated the highest MIO, compared to those intelligible with concentration and those with unintelligible speech (4.25 ± 0.98 cm, 4.07 ± 1.02 cm and 0.5 ± 0 cm, p = 0.004). Similarly, patients who perceived excellent dental aesthetic demonstrated the highest MIO compared with good and poor aesthetics (4.42 ± 1.20 cm, 4.14 ± 0.92 cm and 0.5 ± 0 cm, respectively, p = 0.004, Table 9).
A satisfactory mandibular-maxillary contour yielded the highest MIO, exceeding acceptable and unsatisfactory contours (4.47 ± 0.94 cm, 3.82 ± 0.93 and 0.5 ± 0, respectively, p = 0.001). Finally, consuming a soft diet was significantly associated with a lower MIO compared with a normal diet (3.21 ± 1.44 cm and 4.36 ± 0.96 cm, respectively, p = 0.012, Figure 3).
Maximum inter-incisal opening Among oncologic patients who underwent fibula free flap reconstruction in UKGM, stratified by gender and PFL, January 2002–December 2010 (n = 29).
Maximum inter-incisal opening Among oncologic patients who underwent fibula free flap reconstruction in UKGM, stratified by (a) speech, (b) dental aesthetic, (c) mandibular—maxillary contour, and (d) nutrition, January 2002–December 2010 (n = 29).
Mandibular-Maxillary contour
Our analysis yielded pseudo R-squared values of 21.6% (McFadden's R2) and 26.3% (Nagelkerke's R2), indicating that these variables had moderate predictive power. Notably, our results showed that operative time did not significantly predict contour level, whereas the number of fibula segments was a significant predictor (p = 0.806 and <0.001, respectively). Specifically, our model estimated that having one fibula segment was associated with an adjusted decrease in contour level of 12.99 compared to having three segments, while having two segments was associated with an adjusted decrease of 12.74 compared to having three segments (Table 10).
Discussion
The present study provides an integrated view of flap morbidity, implant performance and patient-centered function after mandibular reconstruction with a vascularized fibula free flap.
Flap-related morbidity
A recipient-site WHD rate of 31% accords with the 33%–35% reported by Rendenbach et al. in a 128-patient series of osseous free flaps (19). Multivariable analysis confirmed that multisegment osteotomies and extended operative time were independent predictors of WHD in our cohort, which aligns with prior reports (19, 20). Revision surgery was significantly more frequent when bone defects were larger, implicating defect length as an additional driver of morbidity (20). These observations underscore that every additional osteotomy introduces vascular and mechanical vulnerability and should therefore be balanced against the aesthetic advantage of improved contour. In surgical planning, the segment count should be therefore considered as modifiable risk factor.
Donor-site WHD occurred in 31% of patients and increased with age, whereas a recent multicenter study linked donor-site morbidity chiefly to alcohol abuse and skin-graft closure, without an age effect (13). Divergent risk profiles may reflect institutional differences in flap procurement and protocols.
Total flap failure rates of 3.1%–14.4% have been documented, yet partial failures appear to be underreported in the literature (21, 22). Even limited tissue loss may foster infections and delay adjuvant therapy or prosthetic rehabilitation (21). In the present cohort, PFL was infrequent (6.9%), but had clear downstream consequences, being associated with both reduced MIO and poorer perceived contour. Restriction to patients who ultimately received dental implant rehabilitation introduces a flap-specific selection bias that may have excluded early losses and thereby understated true incidence, without affecting implant and functional analyses.
Clinical and functional outcomes of implant rehabilitation
The insertion of dental implants following jaw reconstruction with FFF was shown to be a successful option for oral rehabilitation in patients with oral cancer (5). Favorable implant survival rates of implants placed in FFF align with recent meta-analytic reports and even contemporary “jaw-in-a-day” protocols that report implant survivals of ≥95% (23, 24). In our cohort, each patient received an average of 7.14 ± 3.06 implants, and fewer than one implant per patient failed on average. Most patients were rehabilitated with telescopic prostheses, a modality that allows non-integrated elements to be excluded without sacrificing the superstructure. This design choice may partly explain why patients with one or more failed implants still reported acceptable functional outcomes and aesthetics.
Over 71% of participants demonstrated intelligible speech, 75% rated their dental aesthetics as good and over 21% rated them excellent, echoing the good-to-excellent speech intelligibility and aesthetics after reconstruction of segmental maxillofacial defects with FFF (25). Failed implants mattered clinically, and a higher number of failed implants and lower implant survival were associated with reduced speech intelligibility and poorer aesthetic rankings (6). Consistent with this association, prosthetic protocols for higher-risk patients should prioritize flexibility. Removable designs, such as telescopic overdentures, can be advantageous and can be leveraged to maintain function if an implant is lost.
Regarding MIO, the present study demonstrates that WHDs and PFL each diminish MIO by approximately one and three centimeters, respectively, an effect size likely to translate into dietary limitation, given the concurrent association between lower MIO and soft-diet dependence in included sample. Importantly, MIO fell stepwise with declining speech intelligibility, dental aesthetic ratings and contour scores, reinforcing its utility as an objective surrogate of oral function. Accordingly, rehabilitation should include early trismus prophylaxis and structured physiotherapy, and prosthetic selection should accommodate limited mouth opening in patients with WHD or PFL.
Three-segment osteotomies increased WHD risk. At the same time, they were the only independent predictor of a superior contour score. Contemporary computer-aided planning studies advocate multisegment designs to restore native angles and jaw shape; our findings caution that this aesthetic gain must be balanced against higher soft-tissue morbidity (26). The risk-benefit trade-off aligns with a recent comprehensive review that highlights multifactorial determinants of implant survival and the cumulative impact of co-occuring risk factors, underscoring the need for comprehensive risk assessment and personalized treatment planning (10).
Hölzle et al. reported poor recipient-site aesthetics in 62% of women vs. 34% of men after fibula reconstruction, despite greater functional satisfaction in women (27). Their finding is tempered by the fact that only 43% of that cohort received implant-supported restorations, a factor known to improve facial contours and oral function (28, 29). Implant rehabilitation after FFF reconstruction thus remains infrequent (1, 27, 30). By contrast, every patient in the present study received implants, allowing direct linkage of demographic, oncologic and flap variables, complications and implant metrics with both objective functional and patient-reported outcomes. Here, women exhibited more failed implants (1.67 vs. 0.10) without statistical significance, and no sex-related differences emerged in speech intelligibility, aesthetics, contour or diet. The lower MIO in female patients aligns with published sex differences in maximal mouth opening in non-reconstructed populations (31).
Limitations
The study's retrospective design, modest sample size and single-center setting constrain generalizability. Moreover, covariates such as radiation dose and fields, timing, osteotomy gap width or defect geometry, environmental factors, and comorbidities may not have been fully captured or may have influenced outcomes independently of flap-related factors. Complex defects were more likely to receive multisegment osteotomies and longer operative times, introducing potential confounding by indication. Furthermore, restricting the cohort to patients who underwent implant rehabilitation may underestimate early flap-related failures.
Future directions
Well-powered, prospective, multicenter registries that record granular variables such as radiotherapy dose, segment vascular pattern and closure technique are required to refine risk calculators for WHD and implant failure. Although an encouraging 38-year case report of fibula reconstruction documents a patient satisfied with functional outcomes, normal diet, speech and head movement (32), systematic analyses emphasize that high-quality, long-term, standardized comparative studies are still needed (33). Prospective cohorts with extended follow-up are therefore indispensable to confirm the durability of functional and aesthetic outcomes in the long term.
Conclusion
Implant-supported restorations provide a dependable avenue for oral rehabilitation following FFF jaw reconstruction. Recipient-site WHD and PFL were more frequent with multisegment osteotomies and extended operative time, and they reduced MIO and contour scores. Implant failure lowered speech intelligibility and aesthetic ratings. Nevertheless, 96% of patients spoke intelligibly, with or without concentration, 96% rated their dental aesthetic as good or excellent, and most ate a normal diet. These results address the study aim by clarifying how flap morbidity translates into clinical and functional implant outcomes. Long-term success therefore depends on balancing the contour benefits of complex osteotomies with the biological tolerance of the flap after jaw reconstruction.
The reference list from the paper itself. Each links out to its DOI / PubMed record.
- 1Chiapasco M Biglioli F Autelitano L Romeo E Brusati R. Clinical outcome of dental implants placed in fibula-free flaps used for the reconstruction of maxillo-mandibular defects following ablation for tumors or osteoradionecrosis. Clin Oral Implants Res. (2006) 17(2):220–8. 10.1111/j.1600-0501.2005.01212.x 16584419 · doi ↗ · pubmed ↗
- 2Schliephake H Schmelzeisen R Schonweiler R Schneller T Altenbernd C. Speech, deglutition and life quality after intraoral tumour resection. A prospective study. Int J Oral Maxillofac Surg. (1998) 27(2):99–105. 10.1016/s 0901-5027(98)80304-49565264 · doi ↗ · pubmed ↗
- 3Hidalgo DA. Fibula free flap: a new method of mandible reconstruction. Plast Reconstr Surg. (1989) 84(1):71–9. 10.1097/00006534-198907000-000142734406 · doi ↗ · pubmed ↗
- 4Kakarala K Shnayder Y Tsue TT Girod DA. Mandibular reconstruction. Oral Oncol. (2018) 77:111–7. 10.1016/j.oraloncology.2017.12.02029362116 · doi ↗ · pubmed ↗
- 5Attia S Wiltfang J Pons-Kuhnemann J Wilbrand JF Streckbein P Kahling C Survival of dental implants placed in vascularised fibula free flaps after jaw reconstruction. J Craniomaxillofac Surg. (2018) 46(8):1205–10. 10.1016/j.jcms.2018.05.00829884312 · doi ↗ · pubmed ↗
- 6Attia S Wiltfang J Streckbein P Wilbrand JF El Khassawna T Mausbach K Functional and aesthetic treatment outcomes after immediate jaw reconstruction using a fibula flap and dental implants. J Craniomaxillofac Surg. (2019) 47(5):786–91. 10.1016/j.jcms.2018.12.01730733133 · doi ↗ · pubmed ↗
- 7Barrowman RA Wilson PR Wiesenfeld D. Oral rehabilitation with dental implants after cancer treatment. Aust Dent J. (2011) 56(2):160–5. 10.1111/j.1834-7819.2011.01318.x 21623807 · doi ↗ · pubmed ↗
- 8Lodders JN Leusink FKJ Ridwan-Pramana A Winters HAH Karagozoglu KH Dekker H Long-term outcomes of implant-based dental rehabilitation in head and neck cancer patients after reconstruction with the free vascularized fibula flap. J Craniomaxillofac Surg. (2021) 49(9):845–54. 10.1016/j.jcms.2021.03.00233985871 · doi ↗ · pubmed ↗