Application of propensity score matching in prognostic analysis of portal hypertension in hepatocellular carcinoma patients
Qiang Gao, Chunyi Zhu, Meifeng Chen, Shutian Mo, Yongfei He, Ketuan Huang, Yuan Liao, Tianyi Liang, Chuangye Han, Tao Peng

TL;DR
This study examines how portal hypertension affects outcomes in liver cancer patients who undergo surgery and whether splenic procedures improve survival.
Contribution
The study introduces the use of propensity score matching to assess the impact of portal hypertension and splenic modulation on hepatocellular carcinoma surgical outcomes.
Findings
PHT patients had worse short-term surgical outcomes, including increased blood loss and longer hospital stays.
PHT was not linked to worse long-term survival, but splenic modulation improved recurrence-free survival in PHT patients.
Non-PHT patients undergoing non-anatomical hepatectomy had better recurrence-free survival.
Abstract
To investigate the impact of portal hypertension on surgical prognosis after hepatectomy for hepatocellular carcinoma and assess the therapeutic value of concomitant splenic modulation procedures. We retrospectively analyzed HCC patients who underwent open hepatectomy with intraoperative portal venous pressure (PVP) measurement at our center between January 2013 and January 2020. Portal hypertension (PHT) was defined as PVP ≥ 25 cm H2O. Patients were categorized as PHT (n = 88) or non-PHT (n = 642). Propensity score matching (1:1) was performed to balance baseline covariates; matched analyses included 59 pairs. Short-term perioperative outcomes and long-term overall survival (OS) and recurrence-free survival (RFS) were compared between groups. Within the PHT cohort, outcomes were compared between hepatectomy alone and hepatectomy combined with splenectomy or splenic artery ligation.…
Genes, proteins, chemicals, diseases, species, mutations and cell lines named across the full text — each resolved to its canonical identifier and authoritative record.
Click any figure to enlarge with its caption.
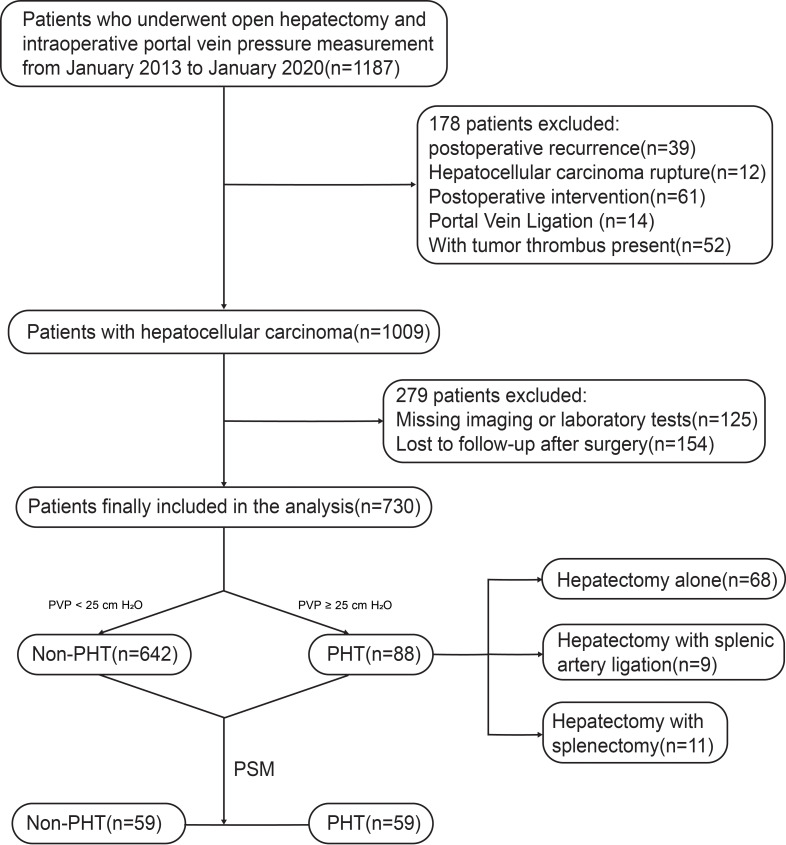 Figure 1
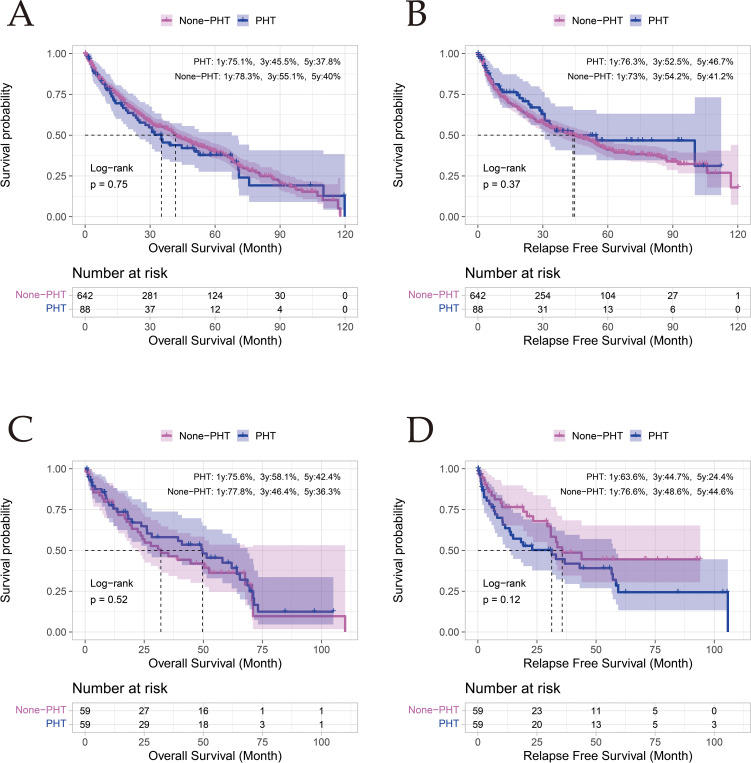 Figure 2
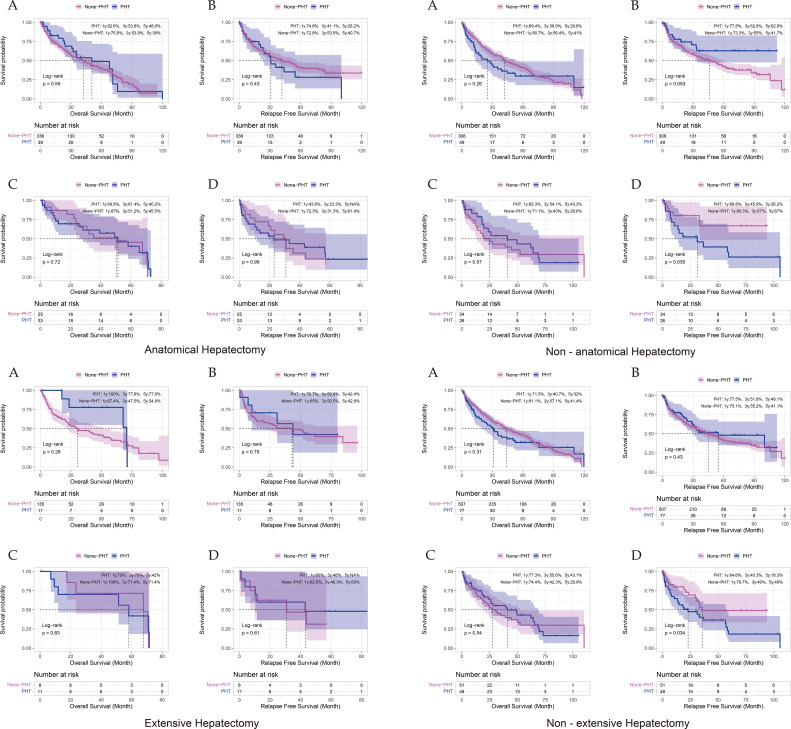 Figure 3
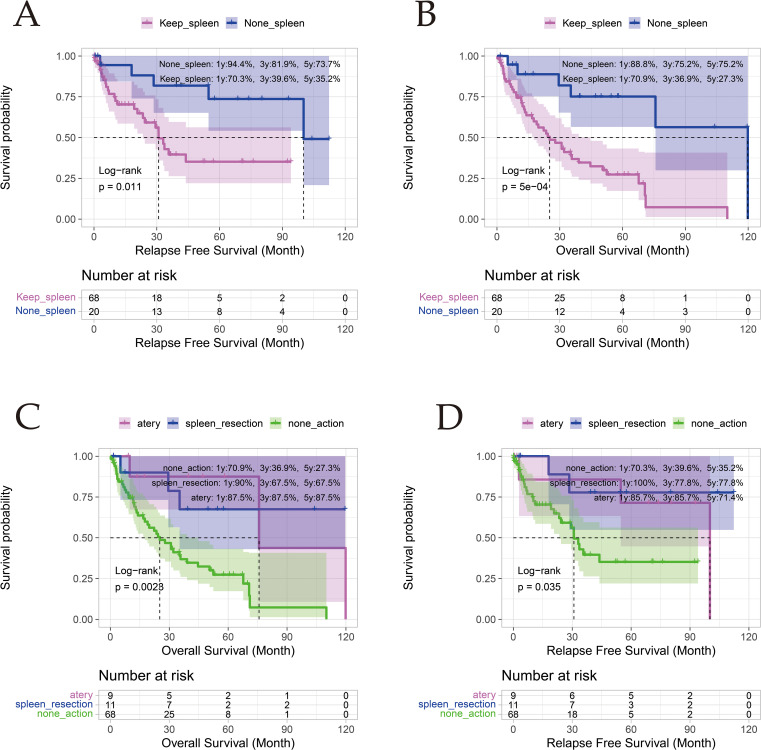 Figure 4
| Characteristic | Non - PHT (N = 642) | PHT (N = 88) | P - value |
|---|---|---|---|
| Gender | 0.027 | ||
| Female | 85 (13.2%) | 20 (22.7%) | |
| Male | 557 (86.8%) | 68 (77.3%) | |
| Age, years | 49.7 ± 11.2 | 51.5 ± 10.3 | 0.121 |
| BMI, kg/m2 | 22.6 ± 3.17 | 23.2 ± 3.79 | 0.143 |
| Diabetes | 0.518 | ||
| No | 622 (96.9%) | 84 (95.5%) | |
| Yes | 20 (3.12%) | 4 (4.55%) | |
| NLR | 1.96 [1.45; 2.68] | 2.04 [1.55; 2.81] | 0.237 |
| Plt, 109/L | 193 [149; 246] | 108 [64.9; 169] | <0.001 |
| Tbil, μmol/L | 11.2 [8.20; 15.0] | 15.1 [10.6; 19.7] | <0.001 |
| Alb, g/L | 39.6 [36.9; 41.9] | 37.7 [34.8; 40.0] | <0.001 |
| Ascites | 0.03 | ||
| No | 520 (81.0%) | 62 (70.5%) | |
| Yes | 122 (19.0%) | 26 (29.5%) | |
| AST, U/L | 35.0 [26.0; 49.8] | 39.5 [31.0; 54.5] | 0.018 |
| ALT, U/L | 33.0 [24.0; 47.0] | 32.0 [24.8; 53.8] | 0.952 |
| AST/ALT | 1.00 [0.80; 1.40] | 1.20 [0.90; 1.40] | 0.003 |
| APRI Score | <0.001 | ||
| ≤2 | 596 (92.8%) | 70 (79.5%) | |
| >2 | 46 (7.17%) | 18 (20.5%) | |
| INR | 0.98 [0.92; 1.03] | 1.02 [0.95; 1.10] | <0.001 |
| Child - Pugh Score | <0.001 | ||
| Class A | 591 (92.1%) | 60 (68.2%) | |
| Class B | 51 (7.94%) | 28 (31.8%) | |
| FIB - 4 Score | <0.001 | ||
| Grade 1: <1.45 | 429 (66.8%) | 25 (28.4%) | |
| Grade 2: 1.45 - 3.25 | 176 (27.4%) | 34 (38.6%) | |
| Grade 3: >3.25 | 37 (5.76%) | 29 (33.0%) | |
| Hepatitis B | 0.693 | ||
| No | 116 (18.1%) | 18 (20.5%) | |
| Yes | 526 (81.9%) | 70 (79.5%) | |
| Hepatitis C | 0.232 | ||
| No | 631 (98.3%) | 85 (96.6%) | |
| Yes | 11 (1.71%) | 3 (3.41%) | |
| HBV – DNA | 1840 [500; 120250] | 783 [500; 250000] | 0.734 |
| AFP, ng/mL | 0.158 | ||
| <400 | 437 (68.1%) | 67 (76.1%) | |
| ≥400 | 205 (31.9%) | 21 (23.9%) | |
| Abnormal Prothrombin, ng/mL | 307 [54.0; 2466] | 174 [40.8; 743] | 0.152 |
| Liver Fluke Enzyme Marker | 0.314 | ||
| Negative | 495 (77.1%) | 62 (70.5%) | |
| Weakly Positive | 60 (9.35%) | 9 (10.2%) | |
| Positive | 87 (13.6%) | 17 (19.3%) | |
| SV, mm3 | 189632 [137196; 250850] | 304958 [180239; 608712] | <0.001 |
| LV, mm3 | 1244250 [1083682; 1460708] | 1218790 [1018122; 1398368] | 0.069 |
| Liver Tumor Volume, mm3 | 69361 [22038; 227937] | 27845 [13207; 104997] | <0.001 |
| Non - tumor Liver Volume, mm3 | 1109289 [970195; 1263326] | 1103947 [953668; 1224254] | 0.523 |
| Liver Tumor Volume Percentage, % | 5.66 [2.00; 17.6] | 2.64 [1.14; 7.73] | <0.001 |
| Non - tumor Liver Volume Percentage, % | 94.3 [82.4; 98.0] | 97.4 [92.3; 98.9] | <0.001 |
| PVD, mm | 13.9 [12.7; 15.3] | 16.4 [15.2; 17.7] | <0.001 |
| SVD, mm | 10.0 [9.22; 10.9] | 11.3 [10.5; 12.9] | <0.001 |
| Invasion of Segment 1 | 1 | ||
| No | 621 (96.7%) | 86 (97.7%) | |
| Yes | 21 (3.27%) | 2 (2.27%) | |
| Invasion of Segment 2 | 0.658 | ||
| No | 585 (91.1%) | 82 (93.2%) | |
| Yes | 57 (8.88%) | 6 (6.82%) | |
| Invasion of Segment 3 | 0.969 | ||
| No | 586 (91.3%) | 81 (92.0%) | |
| Yes | 56 (8.72%) | 7 (7.95%) | |
| Invasion of Segment 4 | 0.665 | ||
| No | 541 (84.3%) | 72 (81.8%) | |
| Yes | 101 (15.7%) | 16 (18.2%) | |
| Invasion of Segment 5 | 0.093 | ||
| No | 404 (62.9%) | 64 (72.7%) | |
| Yes | 238 (37.1%) | 24 (27.3%) | |
| Invasion of Segment 6 | 0.52 | ||
| No | 374 (58.3%) | 55 (62.5%) | |
| Yes | 268 (41.7%) | 33 (37.5%) | |
| Invasion of Segment 7 | 0.604 | ||
| No | 421 (65.6%) | 61 (69.3%) | |
| Yes | 220 (34.3%) | 27 (30.7%) | |
| Invasion of Segment 8 | 1 | ||
| No | 398 (62.0%) | 55 (62.5%) | |
| Yes | 244 (38.0%) | 33 (37.5%) | |
| Number of Invaded Liver Segments | 0.578 | ||
| 1 | 266 (41.4%) | 45 (51.1%) | |
| 2 | 250 (38.9%) | 31 (35.2%) | |
| 3 | 66 (10.3%) | 7 (7.95%) | |
| 4 | 57 (8.88%) | 5 (5.68%) | |
| 5 | 2 (0.31%) | 0 (0.00%) | |
| 6 | 1 (0.16%) | 0 (0.00%) | |
| Number of Tumors | 0.917 | ||
| Single | 555 (86.4%) | 77 (87.5%) | |
| Multiple | 87 (13.6%) | 11 (12.5%) | |
| Maximum Tumor Diameter, cm | 5.50 [3.50; 9.00] | 4.50 [3.00; 6.00] | 0.002 |
| CNLC Stage | 0.003 | ||
| Ia | 255 (39.7%) | 53 (60.2%) | |
| Ib | 310 (48.3%) | 26 (29.5%) | |
| IIa | 59 (9.19%) | 5 (5.68%) | |
| IIb | 5 (0.78%) | 1 (1.14%) | |
| IIIa | 11 (1.71%) | 3 (3.41%) | |
| IIIb | 2 (0.31%) | 0 (0.00%) | |
| BCLC Stage | 0.513 | ||
| A | 565 (88.0%) | 78 (88.6%) | |
| B | 64 (9.97%) | 7 (7.95%) | |
| C | 13 (2.02%) | 3 (3.41%) | |
| Anatomical hepatectomy | 0.194 | ||
| No | 306 (47.7%) | 49 (55.7%) | |
| Yes | 336 (52.3%) | 39 (44.3%) | |
| Extent of hepatectomy | 0.083 | ||
| Non-Extensive: <3 Liver Segments | 507 (79.0%) | 77 (87.5%) | |
| Extensive: ≥3 Liver Segments | 135 (21.0%) | 11 (12.5%) |
| Characteristic | Non - PHT (N = 59) | PHT (N = 59) | P - value |
|---|---|---|---|
| Gender | 1 | ||
| Female | 14 (23.7%) | 14 (23.7%) | |
| Male | 45 (76.3%) | 45 (76.3%) | |
| Age, years | 47.0 ± 11.5 | 52.6 ± 10.9 | 0.007 |
| BMI, kg/m2 | 22.8 ± 3.71 | 23.2 ± 4.27 | 0.518 |
| Diabetes | 0.679 | ||
| No | 55 (93.2%) | 57 (96.6%) | |
| Yes | 4 (6.78%) | 2 (3.39%) | |
| NLR | 2.02 [1.67; 2.61] | 2.05 [1.55; 2.90] | 0.908 |
| Plt, 109/L | 168 [111; 200] | 120 [77.6; 203] | 0.063 |
| Tbil, μmol/L | 14.3 [10.0; 18.2] | 13.9 [10.4; 18.3] | 0.87 |
| Alb, g/L | 38.9 [35.5; 40.8] | 38.0 [35.4; 39.8] | 0.254 |
| Ascites | 0.505 | ||
| No | 48 (81.4%) | 44 (74.6%) | |
| Yes | 11 (18.6%) | 15 (25.4%) | |
| AST, U/L | 33.0 [26.0; 54.0] | 39.0 [31.0; 53.0] | 0.211 |
| ALT, U/L | 30.0 [22.5; 53.0] | 33.0 [24.5; 50.5] | 0.878 |
| AST/ALT | 1.10 [0.90; 1.45] | 1.20 [0.95; 1.40] | 0.298 |
| APRI Score | 1 | ||
| ≤2 | 47 (79.7%) | 47 (79.7%) | |
| >2 | 12 (20.3%) | 12 (20.3%) | |
| INR | 0.98 [0.94; 1.05] | 1.00 [0.94; 1.06] | 0.635 |
| Child - Pugh Score | 1 | ||
| Class A | 47 (79.7%) | 46 (78.0%) | |
| Class B | 12 (20.3%) | 13 (22.0%) | |
| FIB - 4 Score | 0.974 | ||
| Grade 1: <1.45 | 20 (33.9%) | 20 (33.9%) | |
| Grade 2: 1.45 - 3.25 | 24 (40.7%) | 23 (39.0%) | |
| Grade 3: >3.25 | 15 (25.4%) | 16 (27.1%) | |
| Hepatitis B | 1 | ||
| No | 11 (18.6%) | 11 (18.6%) | |
| Yes | 48 (81.4%) | 48 (81.4%) | |
| Hepatitis C | 0.679 | ||
| No | 55 (93.2%) | 57 (96.6%) | |
| Yes | 4 (6.78%) | 2 (3.39%) | |
| HBV – DNA | 1000 [500; 19700] | 704 [500; 384750] | 0.745 |
| AFP, ng/mL | 1 | ||
| <400 | 44 (74.6%) | 44 (74.6%) | |
| ≥400 | 15 (25.4%) | 15 (25.4%) | |
| Abnormal Prothrombin, ng/mL | 353 [58.5; 1358] | 161 [38.2; 949] | 0.482 |
| Liver Fluke Enzyme Marker | 0.442 | ||
| Negative | 47 (79.7%) | 41 (69.5%) | |
| Weakly Positive | 5 (8.47%) | 8 (13.6%) | |
| Positive | 7 (11.9%) | 10 (16.9%) | |
| SV, mm3 | 278560 [183015; 408632] | 246093 [162773; 434182] | 0.677 |
| LV, mm3 | 1153090 [1053715; 1387860] | 1220770 [1049875; 1385700] | 0.899 |
| Liver Tumor Volume, mm3 | 42025 [10498; 175442] | 32534 [15095; 118687] | 0.989 |
| Non - tumor Liver Volume, mm3 | 1067422 [997895; 1178128] | 1109729 [955597; 1205843] | 0.786 |
| Liver Tumor Volume Percentage, % | 4.25 [0.95; 13.5] | 3.01 [1.28; 10.7] | 0.899 |
| Non - tumor Liver Volume Percentage, % | 95.7 [86.5; 99.1] | 97.0 [89.3; 98.7] | 0.899 |
| PVD, mm | 15.7 [14.1; 18.0] | 16.1 [14.6; 17.0] | 0.998 |
| SVD, mm | 11.1 [10.2; 12.4] | 11.1 [10.5; 12.0] | 0.931 |
| Invasion of Segment 1 | 0.619 | ||
| No | 56 (94.9%) | 58 (98.3%) | |
| Yes | 3 (5.08%) | 1 (1.69%) | |
| Invasion of Segment 2 | 1 | ||
| No | 55 (93.2%) | 55 (93.2%) | |
| Yes | 4 (6.78%) | 4 (6.78%) | |
| Invasion of Segment 3 | 0.717 | ||
| No | 56 (94.9%) | 54 (91.5%) | |
| Yes | 3 (5.08%) | 5 (8.47%) | |
| Invasion of Segment 4 | 0.798 | ||
| No | 51 (86.4%) | 49 (83.1%) | |
| Yes | 8 (13.6%) | 10 (16.9%) | |
| Invasion of Segment 5 | 1 | ||
| No | 43 (72.9%) | 43 (72.9%) | |
| Yes | 16 (27.1%) | 16 (27.1%) | |
| Invasion of Segment 6 | 0.574 | ||
| No | 33 (55.9%) | 37 (62.7%) | |
| Yes | 26 (44.1%) | 22 (37.3%) | |
| Invasion of Segment 7 | 1 | ||
| No | 39 (66.1%) | 39 (66.1%) | |
| Yes | 20 (33.9%) | 20 (33.9%) | |
| Invasion of Segment 8 | 0.699 | ||
| No | 40 (67.8%) | 37 (62.7%) | |
| Yes | 19 (32.2%) | 22 (37.3%) | |
| Number of Invaded Liver Segments | 0.804 | ||
| 1 | 30 (50.8%) | 30 (50.8%) | |
| 2 | 22 (37.3%) | 20 (33.9%) | |
| 3 | 3 (5.08%) | 6 (10.2%) | |
| 4 | 4 (6.78%) | 3 (5.08%) | |
| Tumor Number | 1 | ||
| Single | 53 (89.8%) | 52 (88.1%) | |
| Multiple | 6 (10.2%) | 7 (11.9%) | |
| Maximum Tumor Diameter, cm | 4.50 [3.00; 7.50] | 4.50 [3.50; 6.25] | 0.794 |
| CNLC Stage | 0.671 | ||
| Ia | 29 (49.2%) | 35 (59.3%) | |
| Ib | 26 (44.1%) | 19 (32.2%) | |
| IIa | 3 (5.08%) | 3 (5.08%) | |
| IIb | 0 (0.00%) | 1 (1.69%) | |
| IIIa | 1 (1.69%) | 1 (1.69%) | |
| BCLC Stage | 0.857 | ||
| A | 55 (93.2%) | 53 (89.8%) | |
| B | 3 (5.08%) | 5 (8.47%) | |
| C | 1 (1.69%) | 1 (1.69%) | |
| Anatomical hepatectomy | 0.197 | ||
| No | 26 (44.1%) | 34 (57.6%) | |
| Yes | 33 (55.9%) | 25 (42.4%) | |
| Extent of hepatectomy | 0.616 | ||
| Non-Extensive: <3 Liver Segments | 48 (81.4%) | 51 (86.4%) | |
| Extensive: ≥3 Liver Segments | 11 (18.6%) | 8 (13.6%) |
| Characteristic | Non-PHT Pre-PSM (N = 642) | PHT Pre-PSM (N = 88) | P-value Pre-PSM | Non-PHT Post-PSM (N = 59) | PHT Post-PSM (N = 59) | P-value Post-PSM |
|---|---|---|---|---|---|---|
| Surgical Duration, min | 244 [180;327] | 200 [133;306] | 0.026 | 240 [180;305] | 185 [120;300] | 0.02 |
| Intraoperative Blood Loss, ml | 350 [200;538] | 500 [238;800] | 0.001 | 300 [150;575] | 500 [200;850] | 0.025 |
| Perioperative RBC Transfusion, U | 3.00 [1.50;4.00] | 3.00 [2.00;5.62] | 0.082 | 3.25 [1.50;4.00] | 3.00 [2.00;5.62] | 0.638 |
| Perioperative Plasma Transfusion, ml | 600 [400;600] | 600 [400;600] | 0.594 | 600 [450;600] | 600 [400;600] | 0.782 |
| Presence of MVI | 0.947 | 0.325 | ||||
| No | 424 (66.0%) | 59 (67.0%) | 37 (62.7%) | 43 (72.9%) | ||
| Yes | 218 (34.0%) | 29 (33.0%) | 22 (37.3%) | 16 (27.1%) | ||
| Bilirubin (3–5 days postoperative), μmol/L | 17.7 [12.9;25.4] | 24.6 [14.1;33.8] | 0.004 | 18.6 [14.1;26.1] | 24.0 [13.8;30.6] | 0.554 |
| Postoperative Hospital Stay, day | 9.00 [8.00;12.0] | 12.0 [9.75;18.0] | <0.001 | 10.0 [7.50;11.5] | 11.0 [9.00;15.0] | 0.004 |
| Clavien-Dindo Grade | 0.161 | 0.741 | ||||
| <3 | 576 (89.7%) | 74 (84.1%) | 55 (93.2%) | 53 (89.8%) | ||
| ≥3 | 66 (10.3%) | 14 (15.9%) | 4 (6.78%) | 6 (10.2%) |
| Characteristic | Anatomical hepatectomy | Non-anatomical hepatectomy | Large-scale hepatectomy | Non-extensive hepatectomy |
|---|---|---|---|---|
| Sample Size | Non-PHT:33 | Non-PHT:26 | Non-PHT:11 | Non-PHT:48 |
| Surgical Duration, min | ||||
| Non-PHT | 267 [189-311] | 225 [158-268] | 253 [196-310] | 240 [180-304] |
| PHT | 243 [165-318] | 180 [120-267] | 330 [275-360] | 180 [120-267] |
| p-value | 0.377 | 0.07 | 0.094 | 0.004 |
| Intraoperative Blood Loss, ml | ||||
| Non-PHT | 250 [150-500] | 350 [200-800] | 200 [100-475] | 300 [180-550] |
| PHT | 500 [200-900] | 400 [212-800] | 900 [575-1200] | 400 [200-800] |
| p-value | 0.015 | 0.508 | 0.011 | 0.24 |
| Perioperative RBC Transfusion, U | ||||
| Non-PHT | 4.00 [2.50-4.00] | 2.25 [1.50-4.25] | 4.00 [4.00-6.25] | 2.00 [1.50-3.75] |
| PHT | 2.75 [2.25-5.50] | 3.00 [1.50-5.50] | 2.75 [2.50-4.00] | 3.00 [1.50-6.00] |
| p-value | 0.96 | 0.55 | 0.207 | 0.345 |
| Perioperative Plasma Transfusion, ml | ||||
| Non-PHT | 500 [400-600] | 600 [600-600] | 500 [450-550] | 600 [550-600] |
| PHT | 550 [400-600] | 600 [512-600] | 600 [400-600] | 600 [400-600] |
| p-value | 0.65 | 0.6 | 0.801 | 0.624 |
| MVI Positivity | ||||
| Non-PHT | 11 (33.3%) | 11 (42.3%) | 3 (27.3%) | 19 (39.6%) |
| PHT | 7 (28.0%) | 9 (26.5%) | 2 (25.0%) | 14 (27.5%) |
| p-value | 0.882 | 0.311 | 1 | 0.286 |
| Bilirubin (3–5 days postoperative), μmol/L | ||||
| Non-PHT | 18.6 [12.2-30.4] | 18.4 [15.9-22.9] | 27.1 [16.7-45.7] | 18.1 [14.1-24.0] |
| PHT | 25.2 [13.8-27.9] | 21.8 [14.0-31.3] | 26.5 [24.0-27.6] | 21.6 [13.8-31.0] |
| p-value | 0.718 | 0.8 | 0.602 | 0.435 |
| Postoperative Hospital Stay, day | ||||
| Non-PHT | 10.0 [8.0-12.0] | 10.0 [7.0-11.0] | 10.0 [10.0-12.0] | 10.0 [7.0-11.0] |
| PHT | 10.0 [9.0-14.0] | 12.0 [10.2-15.0] | 9.5 [8.8-11.8] | 11.0 [9.5-15.5] |
| p-value | 0.554 | 0.001 | 0.403 | 0.001 |
| Clavien-Dindo Grade (≥Grade 3) | ||||
| Non-PHT | 1 (3.03%) | 3 (11.5%) | 0 (0.00%) | 4 (8.33%) |
| PHT | 5 (20.0%) | 1 (2.94%) | 2 (25.0%) | 4 (7.84%) |
| p-value | 0.075 | 0.307 | 0.164 | 1 |
Peer Reviews
No public reviews on file for this paper yet. If you reviewed it on a platform where reviews are public (OpenReview, ICLR, NeurIPS, ICML), you can paste yours below so the community can read it here.
Videos
No videos yet. Explain this paper in a talk, walkthrough, or lecture? Add one.
Taxonomy
TopicsHepatocellular Carcinoma Treatment and Prognosis · Liver Disease and Transplantation · Organ Transplantation Techniques and Outcomes
Background
Hepatocellular carcinoma (HCC), the fourth leading cause of cancer-related mortality globally, has a particularly high incidence in cirrhotic populations (1, 2). In China, 86% of HCC cases arise in cirrhotic livers (3), and 31.2% present with concurrent portal hypertension (PHT) (4), a critical comorbidity that influences therapeutic decision-making.
Early evidence established PHT severity as an independent predictor of postoperative hepatic failure following hepatectomy (5, 6). Meta-analyses further confirm that clinically significant portal hypertension (CSPH) negatively impacts both surgical mortality and 5-year survival rates in HCC patients undergoing hepatectomy (4, 7). These risks underpin international guidelines from the Barcelona Clinic Liver Cancer (BCLC) and the European Association for the Study of the Liver (EASL), which contraindicate hepatectomy in patients with PHT (8, 9). However, the China Liver Cancer (CNLC) staging system permits surgical intervention for selected resectable HCC cases with PHT (10), creating therapeutic ambiguity that requires resolution through robust clinical evidence.
While hepatectomy remains the first-line therapy for early-stage HCC with preserved liver function (9), its application in patients with PHT remains contentious. PHT correlates with increased postoperative morbidity and risk of hepatic decompensation, traditionally rendering it a surgical contraindication (6, 11, 12). Recent EASL guidelines propose a risk-stratification algorithm incorporating PHT status, extent of hepatectomy, and the Model for End-Stage Liver Disease (MELD) score to guide hepatectomy eligibility (13). However, this framework is derived mainly from open-surgery cohorts using indirect PHT surrogates, whereas laparoscopic approaches have been shown to reduce hepatic injury (14–17). Crucially, the gold-standard hepatic venous pressure gradient (HVPG) measurement for CSPH diagnosis is underrepresented in Eastern populations, limiting the applicability of Western-derived algorithms to Chinese clinical practice (18, 19).
This study aimed to retrospectively analyze clinical data from patients with hepatocellular carcinoma undergoing hepatectomy using propensity score matching. By systematically comparing the clinical characteristics, perioperative outcomes, and long-term prognosis between the PHT and non-PHT groups, and further evaluating the efficacy of concomitant splenic modulation within the PHT cohort, this research sought to elucidate the impact of portal hypertension on surgical prognosis. It provides real-world evidence based on direct portal venous pressure measurements for an East Asian population, and offers a comprehensive assessment of the value of splenic modulation procedures, thereby addressing a significant gap in the existing literature.
Materials and methods
Study population
A total of 1,187 hepatocellular carcinoma (HCC) patients who underwent open hepatectomy with intraoperative portal pressure measurement at the First Affiliated Hospital of Guangxi Medical University between January 2013 and January 2020 were initially enrolled. The study protocol was approved by the Ethics Committee of the First Affiliated Hospital of Guangxi Medical University (Approval No. 2023-E488-01). The inclusion and exclusion criteria were as follows:
Inclusion criteria: (1) patients who underwent open hepatectomy with intraoperative portal pressure measurement at our hospital between January 2013 and January 2020; (2) age ≥ 18 and < 70 years; (3) postoperative histopathological confirmation of hepatocellular carcinoma.
Exclusion criteria: (1) patients with postoperative recurrence, ruptured HCC, previous upper abdominal surgery, any preoperative interventional therapy (such as TACE or HAIC), portal vein ligation, splenectomy, or splenic artery ligation; (2) presence of portal vein or splenic vein tumor thrombus, macrovascular invasion, or arteriovenous fistula; (3) lack of complete preoperative contrast-enhanced CT imaging; (4) missing preoperative or postoperative laboratory tests (including complete blood count, liver function, coagulation profile, etc.); (5) coexistence of other malignancies; (6) loss to follow-up after surgery.
After applying the above criteria, a total of 730 HCC patients were ultimately included in the study. (Figure 1)
Flow chart for patient selection and propensity score matching process. The updated flowchart illustrates the initial patient screening, application of inclusion/exclusion criteria resulting in the final cohort of 730 patients (PHT n=88, non-PHT n=642), and subsequent 1:1 propensity score matching yielding 59 pairs for analysis. The PHT group is further stratified to show patients who did or did not undergo concomitant splenic modulation procedures.
Data collection
Clinical and imaging parameters were extracted from the institutional electronic medical records system of the First Affiliated Hospital of Guangxi Medical University. The collected data included: patient demographics; etiology of liver disease; serological testing for liver fluke infection performed using an enzyme-linked immunosorbent assay to detect serum IgG antibodies against Clonorchis sinensis; laboratory parameters (e.g., platelet count, liver function tests, INR), from which APRI and FIB-4 scores and Child–Pugh grade were derived; preoperative imaging metrics measured from CT scans, including portal vein diameter (PVD), splenic vein diameter (SVD), liver volume (LV), and spleen volume (SV); surgical details including anatomical vs. non-anatomical and extensive vs. non-extensive hepatectomy, intraoperative blood loss, operation time, and concurrent procedures (splenectomy or splenic artery ligation); the core study variable of intraoperative portal venous pressure (PVP); tumor characteristics (e.g., size, number, greatest tumor diameter [GTD], microvascular invasion [MVI], AFP levels, abnormal prothrombin levels (also known as des-gamma-carboxy prothrombin, DCP), BCLC and CNLC stage); and outcome measures covering short-term endpoints (e.g., postoperative bilirubin, hospital stay, Clavien–Dindo complication grade) and long-term survival (overall survival [OS] and recurrence-free survival [RFS]).
Follow-up
Patients were regularly followed up through outpatient clinic visits, imaging reviews, and telephone interviews until the cutoff date of December 31, 2023. In this study, recurrence-free survival (RFS) was defined as the time from the date of surgery to the date of recorded tumor recurrence or the last follow-up. Overall survival (OS) was defined as the time from the date of surgery to the date of patient death or the last follow-up. The median follow up duration for the entire cohort was 52.3 months (IQR 29.5–76.1). For the PHT group, the median follow up was 49.8 months (IQR 28.3–74.2), and for the non PHT group, it was 52.8 months (IQR 29.8–76.4).
CT imaging - related Indicators
Preoperative contrast-enhanced CT scans were analyzed using 3D-Slicer (www.slicer.org) with the Total Segmentation plugin to calculate: portal vein diameter (PVD) at the confluence of the left and right branches; splenic vein diameter (SVD) at its proximal origin (two independent measurements averaged for final values); total liver volume (LV); and spleen volume (SV). Two board-certified radiologists independently performed manual ROI segmentation using ITK-SNAP (http://www.itksnap.org), and tumor-to-liver volume ratios were calculated for functional liver remnant assessment.
Portal pressure measurement
Intraoperative portal venous pressure (PVP) was measured under general anesthesia via right gastroepiploic vein cannulation using a saline-filled manometer (zero reference: mid-axillary line). PHT was defined as PVP ≥ 25 cm H_2_O (20).
Indications and criteria for splenic modulation procedures: For HCC patients complicated by portal hypertension (PHT), the decision to perform a concomitant splenic modulation procedure (splenectomy or splenic artery ligation) during hepatectomy was made according to the following criteria.
Indications for Splenic Modulation: The procedure was indicated only when all the following conditions were met: (1) Adequate hepatic function (Child-Pugh class A or strictly selected class B with a score ≤7); (2) Significantly elevated portal venous pressure (intraoperative measurement ≥35 cm H_2_O); (3) Presence of marked hypersplenism, particularly when the platelet count was < 80 × 10^9^/L.
Selection of Surgical Technique: The specific technique was chosen on an individualized basis. Splenectomy was performed for patients with intraoperative findings or preoperative evidence of moderate-to-severe esophagogastric varices or massive splenomegaly, provided that the peri-splenic anatomy was clear and the procedure was not anticipated to significantly increase surgical risk or duration. Splenic artery ligation served as an alternative, suitable for cases with milder varices, or when the planned hepatectomy itself was highly extensive, time-consuming, and the patient’s condition did not permit further prolongation or expansion of the surgery.
Contraindications: The presence of Child-Pugh-C cirrhosis, uncontrolled active infection, or severe coagulopathy was considered an absolute contraindication for splenic modulation.
Statistical methods
Propensity score matching (1:1) was used to balance 18 baseline covariates between the PHT and non-PHT cohorts, including demographic (sex), biochemical (platelet count, total bilirubin, albumin, AST, ALT, AST/ALT ratio, APRI, INR, FIB-4), clinical (Child–Pugh score, presence of ascites), and imaging metrics (spleen volume, tumor/non-tumor liver volume ratio, portal and splenic vein diameters, maximal tumor diameter). To this end, the propensity score was calculated by enrolling these 18 variables into a logistic regression equation. Subsequently, patients in the non-PHT and PHT groups were matched 1:1 based on their raw propensity score without replacement, using the greedy matching method with a fixed caliper width of 0.5 standard deviation.
Continuous variables were presented as mean ± standard deviation for normally distributed data and compared using Student’s t test, or as median (interquartile range [IQR]) and compared using the Mann–Whitney U test for non-normally distributed data. Categorical variables were expressed as counts (percentages) and compared using Pearson’s chi-square test or Fisher’s exact test, as appropriate. Survival outcomes were analyzed using the Kaplan–Meier method and compared with the log-rank test. Missing data (< 5% of variables) were handled by mean imputation. Statistical significance was defined as p < 0.05.
Results
Baseline data of the study population
The study cohort comprised 730 patients underwent open hepatectomy for resectable hepatocellular carcinoma (HCC), stratified by intraoperative portal venous pressure measurements into portal hypertension (PHT, n = 88, 12%) and non-PHT (n = 642, 88%) groups. Significant intergroup disparities (p < 0.05) were observed across 17 parameters: demographic (gender), biochemical (platelet count, total bilirubin, albumin, AST, AST/ALT ratio, APRI, INR, FIB-4), clinical (Child-Pugh score, ascites), and imaging metrics (spleen volume, tumor/non-tumor liver volume ratios, portal/splenic vein diameters, maximal tumor diameter, CNLC stage) (Table 1).
Notably, the PHT cohort demonstrated smaller tumor volume, reduced maximal diameters, and higher CNLC stage Ia prevalence compared to non-PHT counterparts. To mitigate selection bias, propensity score matching (1:1) generated balanced cohorts (59 pairs) with comparable baseline characteristics (Table 2).
Information on hypersplenism and varices in the PHT cohort
Within the PHT group (n=88), 34 patients (38.6%) had platelet counts <80×10^9^/L, indicative of laboratory evidence of hypersplenism. Massive splenomegaly was defined as a spleen volume >1000 cm³ on preoperative CT volumetry (21, 22), and was present in 19 patients (21.6%). Moderate-to-severe esophagogastric varices were defined as grade 2 or higher on preoperative endoscopy or as the presence of varices with red color signs on imaging/operative notes (23), and were documented in 27 patients (30.7%).
Intraoperative and postoperative comparison
Pre-matching analyses revealed significant disparities in surgical parameters between cohorts. The portal hypertension (PHT) group demonstrated shorter operative durations (median 200 vs 244 minutes, p = 0.026) but greater intraoperative hemorrhagic burden (500 vs 350 mL, p < 0.001). Postoperatively, PHT patients exhibited prolonged hyperbilirubinemia (days 3–5 peak: 24.6 vs 17.7 μmol/L, p = 0.004) and extended hospitalization (12 vs 9 days, p < 0.001). Although Clavien-Dindo grade≥II complications occurred more frequently in the PHT cohort (15.9% vs 10.3%), this difference lacked statistical significance (Table 3 and Supplementary Table S1).
Intraoperative and postoperative comparison after PSM
Propensity score-matched cohorts (n = 59 per group) demonstrated persistent surgical disparities, with the portal hypertension (PHT) group maintaining shorter operative durations (median 185 vs 240 min, p = 0.020) and greater intraoperative blood loss (500 vs 300 mL, p = 0.025) compared to non-PHT counterparts. Notably, postoperative hyperbilirubinemia (days 3–5: 24.0 vs 18.6 μmol/L) lost statistical significance post-matching (p = 0.554). However, prolonged hospitalization remained evident in PHT patients (11 vs 10 days, p = 0.004). No significant intergroup differences were observed in transfusion requirements (RBC: 3.00 vs 3.25 U, p = 0.638; FFP: 600 vs 600 mL, p = 0.782), microvascular invasion prevalence (27.1% vs 37.3%, p = 0.325), or Clavien-Dindo grade ≥III complications (10.2% vs 6.78%, p = 0.741) (Table 3).
Subgroup analysis
In the propensity score-matched cohort undergoing Anatomical hepatectomy (PHT: n = 25 vs non-PHT: n = 33), the portal hypertension group demonstrated significantly higher intraoperative blood loss (median 500 vs 250 mL, p = 0.015) and a clinically notable increase in Clavien-Dindo grade ≥III complications (20.0% vs 3.03%, p = 0.075), although overall complication rates remained comparable (p = 0.882). No intergroup differences were observed in operative duration (243 vs 267 min, p = 0.377), transfusion requirements (RBC: 2.75 vs 4.00 U, p = 0.960; FFP: 550 vs 500 mL, p = 0.650), microvascular invasion prevalence (28.0% vs 33.3%, p = 0.882), postoperative hyperbilirubinemia (25.2 vs 18.6 μmol/L, p = 0.718), or hospitalization length (10 vs 10 days, p = 0.554).
Patients undergoing non-Anatomical hepatectomy with portal hypertension (PHT, n = 34) demonstrated significantly prolonged postoperative hospitalization compared to non-PHT counterparts (median 12 [IQR 10.2-15] vs 10 [7-11] days, p < 0.001), despite comparable intraoperative metrics including blood loss (400 vs 350 mL, p = 0.508) and operative duration (180 vs 225 min, p = 0.070). No significant intergroup differences were observed in transfusion requirements (RBC: 3.00 vs 2.25 U; FFP: 600 vs 600 mL), microvascular invasion rates (26.5% vs 42.3%), or Clavien-Dindo grade ≥III complications (2.94% vs 11.5%).
In patients undergoing extensive hepatectomy, the portal hypertension (PHT) cohort exhibited significantly greater intraoperative blood loss compared to non-PHT counterparts (median 900 vs 200 mL, p = 0.011), despite comparable surgical durations (330 vs 253 min, p = 0.094) and transfusion requirements (RBC: 2.75 vs 4.00 U, p = 0.207; FFP: 600 vs 500 mL, p = 0.801). No intergroup differences were observed in postoperative outcomes, including hyperbilirubinemia (26.5 vs 27.1 μmol/L, p = 0.602), hospitalization length (9.5 vs 10 days, p = 0.403), or severe complications (Clavien-Dindo ≥III: 25.0% vs 0%, p = 0.164).
Patients undergoing non-extensive hepatectomy with portal hypertension (PHT, n = 51) demonstrated reduced operative durations (median 180 vs 240 min, p = 0.004) but prolonged postoperative hospitalization (11 vs 10 days, p = 0.001) compared to non-PHT counterparts (n = 48). No significant intergroup disparities were observed in intraoperative blood loss (400 vs 300 mL, p = 0.240), transfusion volumes (RBC: 3.00 vs 2.00 U; FFP: 600 vs 600 mL), microvascular invasion rates (27.5% vs 39.6%), or Clavien-Dindo ≥III complications (7.84% vs 8.33%). Postoperative hyperbilirubinemia showed comparable trajectories (21.6 vs 18.1 μmol/L, p = 0.435) (Table 4).
Long - term prognosis comparison
Propensity score-matched analyses demonstrated comparable long-term survival outcomes between PHT and non-PHT cohorts across all evaluated timepoints. Pre-matching 5-year overall survival (OS) rates were 37.8% (PHT) versus 40% (non-PHT) (p = 0.750), with recurrence-free survival (RFS) at 46.7% versus 41.2% (p = 0.370). Post-matching analyses revealed persistent non-significant disparities: 5-year OS of 42.4% (PHT) versus 36.3% (non-PHT) (p = 0.520), and RFS of 24.4% versus 44.6% (p = 0.120). Notably, the 3-year OS paradoxically favored PHT patients post-PSM (58.1% vs 46.4%), though this difference remained statistically insignificant. These findings collectively indicate that portal hypertension status does not independently predict long-term survival outcomes following hepatectomy (Figure 2; Supplementary Table S2).
Comparison of OS and RFS between the PHT and non - PHT Groups Before and After PSM. (A, B) represent OS and RFS before propensity score matching (PSM), respectively; Panels (C, D) represent OS and RFS after PSM, respectively.
Subgroup analysis of long - term prognosis
Subgroup analyses revealed distinct survival patterns based on hepatectomy types. For anatomical hepatectomies, comparable 5-year overall survival (OS) and recurrence-free survival (RFS) were observed between portal hypertension (PHT) and non-PHT cohorts both pre- (OS: 48.9% vs 39%, p = 0.550; RFS: 28.2% vs 40.7%, p = 0.430) and post-propensity score matching (PSM) (OS: 40.2% vs 45.5%, p = 0.720). Conversely, non-anatomical hepatectomy demonstrated significant RFS disparities post-PSM (26.2% vs 67%, p = 0.035). Extensive hepatectomies showed no survival differences across all stages (5-year OS post-PSM: 42% vs 71.4%, p = 0.830). Notably, non-extensive hepatectomy exhibited significantly inferior RFS in PHT patients post-PSM (18.3% vs 49%, p = 0.030, suggesting residual portal hypertension pathophysiology adversely impacts recurrence in parenchymal-sparing procedures (Figure 3; Supplementary Table S3).
Comparison of Survival Outcomes by Surgical Type and PSM Stage. (A, B) represent OS and RFS before propensity score matching (PSM), respectively; Panels (C, D) represent OS and RFS after PSM, respectively.
Long - term prognosis of the PHT group
In patients with portal hypertension (PHT) undergoing open hepatectomy, three spleen management strategies were analyzed: hepatectomy alone (n = 68), hepatectomy with splenectomy (n = 11), and hepatectomy with splenic artery ligation (n = 9). Given limited sample sizes precluding propensity score matching, direct comparisons revealed no survival differences between splenectomy and splenic artery ligation cohorts (5-year OS: 67.0% vs 87.5%, p = 0.800; RFS: 77.8% vs 71.4%, p = 0.440). However, both intervention groups demonstrated superior outcomes compared to hepatectomy-alone controls, with splenectomy achieving 67.0% vs 27.3% 5-year OS (p = 0.0028) and 77.8% vs 35.2% RFS (p = 0.035), while splenic artery ligation showed 87.5% vs 27.3% OS (p = 0.0028) and 71.4% vs 35.2% RFS (p = 0.035). These findings suggest adjunctive splenic modulation may mitigate PHT-related survival deficits, though larger cohorts are needed for validation (Figure 4; Supplementary Tables S4, S5).
Comparison of Survival Outcomes Among Different Spleen Interventions in the PHT Group. (A, B) depict Relapse-Free Survival (RFS) and Overall Survival (OS) for the splenectomy group and the conservative management group, respectively; Panels (C, D) depict OS and RFS for the splenectomy group, splenic artery ligation group, and conservative management group, respectively.
Discussion
Hepatectomy remains the primary curative intervention for hepatocellular carcinoma (HCC) in patients with preserved liver function (24). However, no universally established guidelines exist for managing HCC with concurrent portal hypertension (PHT). The 2022 updated Barcelona Clinic Liver Cancer (BCLC) staging system explicitly contraindicates hepatectomy in patients with elevated portal venous pressure due to concerns over postoperative hepatic decompensation (25), and instead recommends liver transplantation as a key treatment option for BCLC-A patients with solitary nodules and clinically significant portal hypertension (8). The patients in this study underwent hepatectomy based on real-world clinical decisions, which may be influenced by factors such as organ availability, patient preference, or transplant contraindications. As a retrospective analysis, our data cannot retrospectively ascertain the specific reasons for not pursuing transplantation in these individual cases. Therefore, the aim of this study was not to challenge the transplant recommendation, but to evaluate the oncological outcomes of hepatectomy in a selected cohort of PHT patients who actually received this treatment, providing evidence for scenarios where transplantation is not feasible. Early studies identified PHT as an independent predictor of postoperative liver failure and reduced overall survival (OS) following hepatectomy (6, 26). Contrasting this historical perspective, recent multicenter studies demonstrate comparable postoperative complication rates and long-term survival between PHT and non-PHT cohorts (27–29). Cucchetti et al. conducted propensity-matched analyses of 89 PHT and 152 non-PHT patients, revealing statistically equivalent 5-year OS rates (56.3% vs 61.4%, p = 0.380) (30).Chinese clinical series further corroborate these findings, with multiple studies reporting preserved survival outcomes in carefully selected PHT patients (27, 28). Consistent with prior evidence, our propensity score-matched analysis revealed comparable baseline characteristics and survival outcomes between portal hypertension (PHT) and non-PHT cohorts. Both pre- and post-matching comparisons demonstrated non-significant disparities in OS and RFS, indicating that rigorously selected PHT patients undergoing standardized perioperative protocols do not incur additional prognostic risks compared to non-PHT counterparts. These findings support surgical intervention as a viable option for compensated PHT-HCC patients. Notably, comparable microvascular invasion (MVI) rates were observed, likely attributable to the predominance of early-stage tumors in our PHT cohort. Smaller tumor volumes at this disease stage may limit vascular infiltration capacity, potentially explaining the preserved oncological outcomes.
The literature on perioperative outcomes for patients with portal hypertension (PHT) is extensive but not entirely consistent. Several retrospective cohort studies and multicenter database analyses that used HVPG or clinical surrogates (such as splenomegaly, thrombocytopenia, or esophagogastric varices) have shown that patients with clinically significant portal hypertension (CSPH—commonly defined as HVPG ≥10 mmHg or by clinical surrogates) undergoing hepatectomy overall experience higher rates of postoperative hepatic decompensation, increased perioperative mortality, and worse long-term survival (31–33). However, some studies using propensity score matching (PSM) or multivariable adjustment indicate that, in carefully selected compensated patients, those with PHT who undergo hepatectomy may achieve long-term survival and complication rates comparable to non-PHT patients (34, 35). Consistent with these reports, our study also observed shorter surgical duration in the PHT group, largely because these patients had smaller tumor volumes, shorter maximal diameters, and higher proportions of early-stage disease—factors that reduced operative complexity. Nonetheless, both in our cohort and in many prior studies, PHT patients commonly face higher intraoperative blood loss, particularly during anatomical and extensive hepatectomy, which may relate to thrombocytopenia, increased portal/intrahepatic venous pressures, and development of portosystemic collaterals (36–39). To mitigate these risks, international guidelines and expert consensuses recommend multimodal hemorrhage control and liver-protection measures—our study followed the 2020 expert consensus, implementing ultrasound-guided hepatectomy planning, the Pringle maneuver with selective inflow occlusion, intraoperative low CVP management (<5 mmHg), and coagulation factor replacement (9, 40, 41). Despite these measures, PHT patients undergoing non-anatomical or non-extensive hepatectomy still showed prolonged postoperative hospitalization, and Clavien–Dindo ≥III complications were numerically higher than in non-PHT patients though not statistically significant. This observation is concordant with some laparoscopic series (42), suggesting that modern minimally invasive and precision surgical techniques can partially mitigate classical PHT-associated risks. However, current evidence is limited by retrospective designs and sample sizes; larger multicenter prospective studies are still required to validate and refine PHT-specific perioperative strategies.
Multiple studies have suggested that PHT is an independent risk factor for HCC recurrence after hepatectomy, particularly in patients who undergo non-anatomical or non-extensive hepatectomy (43–45). Specifically, several retrospective cohort and multicenter studies using clinical or hemodynamic criteria to define PHT found an association between PHT and increased intrahepatic recurrence after multivariable adjustment; this effect appears especially pronounced when conservative margins leave potential multifocal disease or micrometastases in situ (46–48). Our PSM subgroup analysis corroborated this: PHT patients who underwent non-anatomical or non-extensive hepatectomy had significantly worse recurrence-free survival (RFS) than matched non-PHT patients, while overall survival (OS) did not differ significantly, suggesting that PHT primarily impacts short- to mid-term outcomes by increasing intrahepatic recurrence. Mechanistically, basic and clinical research has proposed several pathways: PHT may induce sinusoidal architectural disruption, hepatic microcirculatory alterations, and local hypoxia, all of which can enhance residual tumor cell adaptability and activate EMT-related pathways (49, 50); concomitantly, PHT-associated impairment of liver regeneration and uneven distribution of drugs/metabolites may reduce the capacity to eradicate micrometastases postoperatively (51). In addition, the immune microenvironment in a PHT liver may be altered, reducing local immune surveillance and facilitating recurrence. Compared with studies that endorse non-extensive hepatectomy in carefully selected patients, our findings favor prioritizing anatomical hepatectomy or wider margins in compensated PHT patients whose liver function and remnant volume permit it, although this recommendation must be balanced against increased technical difficulty and the patient’s hepatic reserve and should be integrated with postoperative adjuvant or locoregional/systemic therapies to individualize care.
The value of concomitant splenic interventions (splenectomy or splenic artery ligation) combined with hepatectomy is supported by a body of retrospective evidence and several meta-analyses. Multiple comparative retrospective studies and meta-analyses have concluded that, in HCC patients with marked hypersplenism (e.g., substantial thrombocytopenia, massive splenomegaly) or elevated portal pressures, simultaneous splenectomy can significantly improve postoperative platelet and leukocyte counts, reduce perioperative bleeding issues, and in some reports is associated with better RFS and long-term survival; these studies generally stress that, when patients are carefully selected (compensated liver disease, adequate hepatic reserve, favorable splenic anatomy), the safety profile of concomitant splenectomy can be acceptable (34, 52–54). At the same time, splenic artery ligation has been proposed as a less invasive alternative that can partially reduce splenic inflow and portal pressure and produce short-term hematologic improvement, potentially conferring similar long-term benefits (43–45, 55); however, the evidence base for ligation is smaller and lacks large, long-term randomized head-to-head comparisons. In our study, despite limited numbers, both splenectomy and splenic artery ligation showed comparable survival outcomes and both appeared superior to hepatectomy alone, aligning with the directional findings of retrospective literature. It should be emphasized that while splenectomy may improve hemodynamics and possibly reduce recurrence risk, it substantially increases the incidence of portal venous thrombosis (PVT)—published series report a marked rise in PVT rates from the early postoperative period through the first year—so clinical decisions must carefully weigh individualized benefit against thrombotic and infectious risks (56). If splenectomy is performed, intensified postoperative PVT surveillance (early ultrasound/CT) and appropriate prophylactic/therapeutic anticoagulation should be considered. Overall, the available evidence supports considering splenic intervention under strict indications to improve outcomes in selected PHT patients, such as those with marked hypersplenism (particularly a platelet count < 80 × 10^9^/L), significantly elevated intraoperative portal venous pressure (e.g., ≥ 35 cm H_2_O), or concomitant moderate-to-severe esophagogastric varices or massive splenomegaly. However, definitive conclusions regarding its comparative efficacy, safety profile (especially the incidence of portal vein thrombosis), and impact on long-term survival require larger prospective or randomized trials.
This study has certain limitations that should be acknowledged. First, it focused exclusively on patients who underwent hepatectomy. Consequently, the findings primarily apply to this specific treatment cohort and may not be generalizable to all HCC patients with PHT, particularly those who are ideal candidates for and receive liver transplantation as per current guidelines. Second, the sample size, especially within the PHT subgroup undergoing different splenic procedures, was limited, which may affect the statistical power of the comparisons. Third, portal hypertension was defined by a single baseline intraoperative PVP measurement rather than the gold standard HVPG; although previous studies have demonstrated a strong correlation between PVP ≥ 25 cm H_2_O and HVPG ≥ 10 mmHg (57, 58), the absence of synchronous HVPG measurements in our cohort precluded direct validation of this agreement within our specific population. Dynamic postoperative PVP changes were not captured, potentially missing valuable hemodynamic information related to outcomes. Fourth, as a single-center retrospective analysis, the generalizability of our findings is constrained, and external validation from multi-center or prospective studies is necessary to confirm our conclusions.
Conclusion
Our comparative analysis revealed distinct perioperative patterns between portal hypertension (PHT) and non-PHT cohorts. The PHT group exhibited significantly shorter operative durations but paradoxically greater intraoperative blood loss, subsequently requiring prolonged hospitalization. Notably, both groups maintained comparable 30-day complication rates. Long-term survival analysis demonstrated no significant intergroup differences in overall survival and recurrence-free survival. Importantly, subgroup analysis revealed that PHT patients undergoing limited hepatectomy (non-Anatomical/non-extensive hepatectomy) showed significantly inferior RFS compared to non-PHT counterparts, suggesting PHT’s role as a critical recurrence predictor in limited hepatectomy. Furthermore, combined surgical approaches integrating hepatectomy with splenic modulation (splenic artery ligation or splenectomy) demonstrated superior long-term survival outcomes in PHT patients, highlighting the potential benefits of portal flow modification strategies in this high-risk population.
The reference list from the paper itself. Each links out to its DOI / PubMed record.
- 1Villanueva A . Hepatocellular carcinoma. N Engl J Med. (2019) 380:1450–62. doi: 10.1056/NEJ Mra 1713263, PMID: 30970190 · doi ↗ · pubmed ↗
- 2Alawyia B Constantinou C . Hepatocellular carcinoma: a narrative review on current knowledge and future prospects. Curr Treat Options Oncol. (2023) 24:711–24. doi: 10.1007/s 11864-023-01098-9, PMID: 37103744 · doi ↗ · pubmed ↗
- 3Huang DQ Terrault NA Tacke F Gluud LL Arrese M Bugianesi E . Global epidemiology of cirrhosis - etiology, trends and predictions. Nat Rev Gastroenterol Hepatol. (2023) 20:388–98. doi: 10.1038/s 41575-023-00759-2, PMID: 36977794 PMC 10043867 · doi ↗ · pubmed ↗
- 4Liu J Zhang H Xia Y Yang T Gao Y Li J . Impact of clinically significant portal hypertension on outcomes after partial hepatectomy for hepatocellular carcinoma: a systematic review and meta-analysis. HPB (Oxford). (2019) 21:1–13. doi: 10.1016/j.hpb.2018.07.005, PMID: 30082213 · doi ↗ · pubmed ↗
- 5Vivarelli M Mocchegiani F Wakabayashi T Gaudenzi F Nicolini D Al-Omari MA . Prevention of post-hepatectomy liver failure in cirrhotic patients undergoing minimally invasive liver surgery for HCC: has the round ligament to be preserved? Cancers (Basel). (2024) 16(2):364. doi: 10.3390/cancers 16020364, PMID: 38254855 PMC 10814940 · doi ↗ · pubmed ↗
- 6Bruix J Castells A Bosch J Feu F Fuster J Garcia-Pagan JC . Surgical resection of hepatocellular carcinoma in cirrhotic patients: prognostic value of preoperative portal pressure. Gastroenterology. (1996) 111:1018–22. doi: 10.1016/s 0016-5085(96)70070-7, PMID: 8831597 · doi ↗ · pubmed ↗
- 7Choi SB Kim HJ Song TJ Ahn HS Choi SY . Influence of clinically significant portal hypertension on surgical outcomes and survival following hepatectomy for hepatocellular carcinoma: a systematic review and meta-analysis. J Hepatobiliary Pancreat Sci. (2014) 21:639–47. doi: 10.1002/jhbp.124, PMID: 24867654 · doi ↗ · pubmed ↗
- 8Forner A Reig ME de Lope CR Bruix J . Current strategy for staging and treatment: the BCLC update and future prospects. Semin Liver Dis. (2010) 30:61–74. doi: 10.1055/s-0030-1247133, PMID: 20175034 · doi ↗ · pubmed ↗