New models to predict survival of patients with difficult ventilator-weaning diagnosed with community-acquired pneumonia
Shiauyee Chen, Shu-Fen Liao, Wan-Jung Chang, Kin-Fai Ho, Shih-Hsin Hsiao, Shu-Chuan Ho, Jer-Hwa Chang

TL;DR
This study developed new models to better predict survival in patients with community-acquired pneumonia who struggle to wean off ventilators.
Contribution
The paper introduces three new prediction models that outperform existing tools like CURB-65 for predicting survival in ventilated pneumonia patients.
Findings
Three new models achieved higher AUROC scores (75-78%) than CURB-65 in predicting survival for CAP patients.
Models 1 and 3 showed statistically significant improvements in predictability compared to CURB-65.
The new models performed well in validation samples with AUROCs ≥ 80%.
Abstract
High mortality is common in mechanically ventilated patients with severe community-acquired pneumonia (CAP). This study sought to create prediction models and determine factors for the pneumonia patients under difficult ventilator weaning in a respiratory care center. In total, 353 CAP and hospital-acquired pneumonia (HAP) patients admitted to a respiratory care center (RCC) from January 1, 2015 to December 31, 2017 were included in this retrospective cohort study. Mortality and weaning risks factors were collected and analyzed for validating the prediction models. The study focuses primarily on CAP patients, with HAP data used to external validation. Among 270 CAP patients in model testing and validation, CURB-65 (Confusion, Uremia, Respiratory rate, Blood pressure, aged ≥65 years) and CUB-65 similarly predicted RCC survival (AUROCs ~65%). Three new RCC survival prediction models…
Genes, proteins, chemicals, diseases, species, mutations and cell lines named across the full text — each resolved to its canonical identifier and authoritative record.
Click any figure to enlarge with its caption.
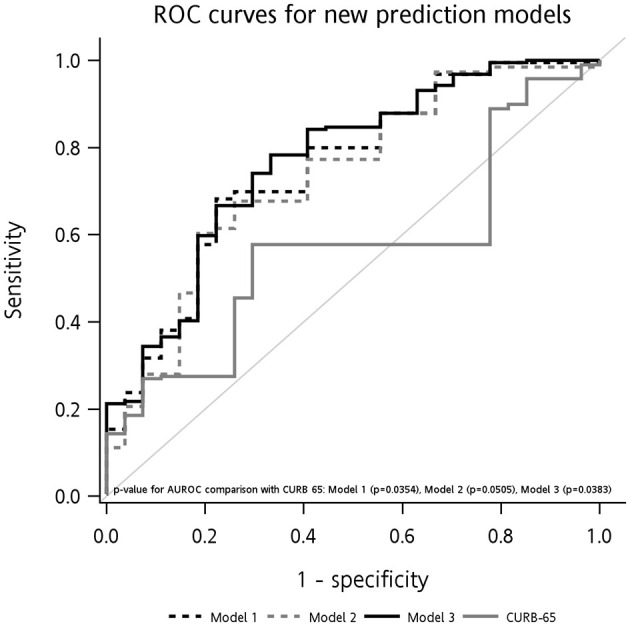 Figure 1
|
|
|
|
|
|---|---|---|---|
| No | 18 (8.33) | 8 (14.81) | 0.1487 |
| Yes | 198 (91.67) | 46 (85.19) | |
|
| |||
| No | 89 (41.20) | 25 (46.30) | 0.4980 |
| Yes | 127 (58.80) | 29 (53.70) | |
| No | 183 (84.72) | 50 (92.59) | 0.1325 |
| Yes | 33 (15.28) | 4 (7.41) | |
| No | 49 (22.69) | 15 (27.78) | 0.4312 |
| Yes | 167 (77.31) | 39 (72.22) | |
|
| |||
| No | 53 (24.54) | 12 (22.22) | 0.7219 |
| Yes | 163 (75.46) | 42 (77.78) | |
| No | 175 (81.02) | 41 (75.93) | 0.4027 |
| Yes | 41 (18.98) | 13 (24.07) | |
|
| |||
| IMV | 96 (44.44) | 22 (40.74) | 0.6236 |
| NIV | 120 (55.56) | 32 (59.26) | |
| No | 112 (51.85) | 24 (44.44) | 0.3302 |
| Yes | 1014 (48.15) | 30 (55.56) | |
| No | 96 (44.44) | 17 (31.48) | 0.0841 |
| Yes | 120 (55.56) | 37 (68.52) | |
|
| |||
| No | 27 (12.50) | 9 (16.67) | 0.4205 |
| Yes | 189 (87.50) | 45 (83.33) | |
|
|
|
|
|
|---|---|---|---|
| No | 18 (100.00) | 0 (0.00) | 0.1375 |
| Yes | 171 (86.36) | 27 (13.64) | |
|
| |||
| No | 81 (91.01) | 8 (8.99) | 0.1915 |
| Yes | 108 (85.04) | 19 (14.96) | |
| No | 46 (93.88) | 3 (6.12) | 0.1247 |
| Yes | 143 (85.63) | 24 (14.37) | |
|
| |||
| No | 47 (88.68) | 6 (11.32) | 0.7651 |
| Yes | 142 (87.12) | 21 (12.88) | |
| No | 157 (89.71) | 18 (10.29) |
|
| Yes | 32 (78.05) | 9 (21.95) | |
|
| |||
| IMV | 92 (95.83) | 4 (4.17) |
|
| NIV | 97 (80.83) | 23 (19.17) | |
| No | 102 (91.07) | 10 (8.93) | 0.0996 |
| Yes | 87 (83.65) | 17 (16.35) | |
| No | 85 (88.54) | 11 (11.46) | 0.6788 |
| Yes | 104 (86.67) | 16 (13.33) | |
|
|
|
|
| |||
|---|---|---|---|---|---|---|
|
|
|
|
|
|
| |
| No | – | 0.9747 | – | 0.9750 | – | 0.9748 |
| Yes | Ref. | Ref. | Ref. | |||
|
| ||||||
| No | 1.59 (0.62, 4.07) | 0.3305 | 1.60 (0.63, 4.07) | 0.3237 | 1.64 (0.64, 4.22) | 0.3050 |
| Yes | Ref. | Ref. | Ref. | |||
| No | 2.20 (0.59, 8.17) | 0.2394 | 2.13 (0.58, 7.86) | 0.2574 | 2.14 (0.57, 8.00) | 0.2572 |
| Yes | Ref. | Ref. | Ref. | |||
| GCS ≤ 8 | ||||||
| No | 2.49 (0.94, 6.63) | 0.0671 | 2.38 (0.91, 6.24) | 0.0787 | 2.40 (0.90, 6.45) | 0.0814 |
| Yes | Ref. | Ref. | Ref. | |||
|
| ||||||
| IMV | Ref. | Ref. | Ref. | |||
| NIV | 0.17 (0.06, 0.52) | 0.0020 | 0.17 (0.05, 0.51) | 0.0017 | 0.16 (0.05, 0.50) | 0.0017 |
| No | 2.15 (0.89, 5.19) | 0.0890 | 2.25 (0.92, 5.48) | 0.0754 | ||
| Yes | Ref. | Ref. | ||||
| No | 1.30 (0.54, 3.13) | 0.5553 | 1.44 (0.59, 3.52) | 0.4264 | ||
| Yes | Ref. | Ref. | ||||
| AUROC (%; test sample) | 77.51 (67.66, 87.36) | 75.99 (65.69, 86.30) | 77.97 (68.10, 87.85) | |||
| 0.0354 | 0.0505 | 0.0383 | ||||
| AUROC (%; validation sample) | 86.54 (75.82, 97.27) | 81.36 (68.69, 94.02) | 86.05 (75.15, 96.94) | |||
|
|
|
|
|---|---|---|
|
| ||
| CURB-65 | 71.27 (64.55, 77.99) | – |
| CUB-65 | 70.98 (64.31, 77.65) | 0.5850 |
| Model 1 | 69.54 (62.60, 76.48) | 0.4908 |
| Model 2 | 71.67 (64.84, 78.50) | 0.8693 |
| Model 3 | 71.89 (65.09, 78.68) | 0.8176 |
| CURB-65 | 62.83 (56.19, 69.47) | – |
| CUB-65 | 62.27 (55.58, 68.96) | 0.7505 |
| Model 1 | 65.61 (58.75, 72.48) | 0.4573 |
| Model 2 | 64.29 (57.54, 71.03) | 0.6712 |
| Model 3 | 65.77 (58.85, 72.70) | 0.4326 |
|
| ||
| CURB-65 | 80.26 (68.34, 92.19) | – |
| CUB-65 | 77.82 (64.37, 91.27) | 0.6491 |
| Model 1 | 87.31 (76.33, 98.30) | 0.4466 |
| Model 2 | 84.96 (74.38, 95.55) | 0.5631 |
| Model 3 | 87.78 (77.79, 97.77) | 0.4047 |
Peer Reviews
No public reviews on file for this paper yet. If you reviewed it on a platform where reviews are public (OpenReview, ICLR, NeurIPS, ICML), you can paste yours below so the community can read it here.
Videos
No videos yet. Explain this paper in a talk, walkthrough, or lecture? Add one.
Taxonomy
TopicsNosocomial Infections in ICU · Sepsis Diagnosis and Treatment · Pneumonia and Respiratory Infections
Introduction
Pneumonia is the leading cause of mortality in elderly patients (1, 2) and is classified into community-acquired pneumonia (CAP) and hospital-acquired pneumonia (HAP) (3). CAP is an acute infectious disease accompanied an abnormally increased or decreased white blood cell (WBC) count in a non-hospital setting (3, 4). Severe CAP (SCAP) often results in high mortality (5). About 58%−87% of patients with SCAP were reported to develop respiratory failure and require mechanical ventilation (6).
A 2023 study introduced a mortality risk prediction model for patients with SCAP in intensive care units (ICUs). Lymphocytes, the ratio of partial pressure of oxygen in arterial blood (PaO_2_)/fraction of inspired oxygen (FiO_2_), septic shock, and Acute Physiology and Chronic Health Evaluation (APACHE) II scores were independent risk factors. The model outperformed traditional systems such as APACHE II and Sequential Organ Failure Assessment (SOFA) (7). Another study created a model for elderly SCAP patients, using age, vasopressor use, chronic renal disease, neutrophil and platelet counts, and blood urea nitrogen (BUN) as key risk factors for in-hospital mortality (8).
The 2005 International Consensus Conference defines difficult weaning as when patients have either failed at least three weaning attempts or required more than 7 days of weaning after the first spontaneous breathing trial (SBT). In previous research, risk factors for re-intubation span multiple domains, such as an older age, comorbidities, low hemoglobin (Hb), low albumin, etc (9–12). A retrospective study investigated factors influencing weaning among elderly patients (≥65 years) with CAP, and results showed that patients with emphysematous changes and low albumin concentrations experienced weaning difficulties (11).
Several prediction models help clinicians predict survival for patients with CAP, such as CURB-65 and the Pneumonia Severity Index (PSI) (1). CURB-65 is a simple calculator based on five risk factors including confusion, urea, respiratory rate, systolic blood pressure, and being aged ≥65 years. The PSI contain 20 risk factors that can categorize patients into five groups of mortality risk. These models were validated to predict patient mortality. Factors related to weaning were similar (overlapping) to the factors in these models. CURB-65 was found to be better in predicting admission to an ICU compared to the PSI (13). Since the models have limitations, some studies tried to modify or extend the original models. Liu et al. (14) tried to expand CURB-65 because of low sensitivity for 30-day mortality. The expanded CURB-65 is an objective and accurate scoring system. Sanz et al. (15) added the factor of hypoxemia to CURB-65 for reminding clinicians. The CURB-65 system is easy to apply in clinical practice. However, its application still faces limitations in specific situations, such as in ventilator-using populations. For pneumonia patients under ventilator support, the respiratory rate (RR) is not considered an effective factor for prediction. A review article found that lower Hb levels were significantly associated with increased risks of weaning failure and mortality in critically ill patients (16). An effective model constructed from risk factors in ventilator-using populations could be instrumental in adjusting weaning and treatment plans within the clinical setting.
In 1998 in Taiwan, the National Health Institute established an integrated delivery system for patients who require ventilatory support. Respiratory care centers (RCCs) are specialized units downstream of ICUs that provide effective care for mechanical ventilation (MV)-using patients under difficult weaning (12, 17). Therefore, based on the CURB-65 system, the purposes of this study were to construct new prediction models and understand factors predicting outcomes for pneumonia patients under difficult ventilator weaning in an RCC setting. The study focuses primarily on CAP patients, with HAP data used to external validation.
Materials and methods
Study population
This was a retrospective cohort study. Patients (over 20 years of age) admitted to an RCC from January 1, 2015 to December 31, 2017 were recruited. The RCC unit was located in a medical center in northern Taiwan (a single-center study). All patients were transferred from a medical or surgical ICU, a general ward, or the emergency department. The patients with respiratory failure were included if intermittent mandatory ventilation (IMV) or non-invasive ventilator (NIV) lasted longer than 3 weeks and weaning failed. The exclusion criteria included the patients who (1) requested discharge against medical advice after admission to RCC (2) expired within 3 days of admission to the RCC (3) were in the state of shock and used vasopressors within 3 days of admission to RCC. We gained access to the patient list and charts from our secretary department. Patients received a multidisciplinary approach after admission. The study was approved by the Taipei Medical University (TMU)-Joint Institutional Review Board with approval number (N201612048). The study was conducted in accordance with the Declaration of Helsinki.
Of the entire recruited pneumonia population, most patients were identified as having CAP (N = 270), and the minority had HAP (N = 83). CAP was diagnosed based on a combination of factors. These included clinical symptoms (dyspnea, coughing, fever, fatigue, and changes in mental status) combined with new radiographic infiltrates or abnormal WBC/C-reactive protein levels. Diagnosis required no prior hospitalization in the past 2 weeks (4, 18). HAP was defined as pneumonia occurring 48 h after hospital admission or up to 14 days after discharge (19). In this study, we restricted our cohort to patients with CAP for developing new models to predict their prognosis. The HAP population was further used for external validation to examine the generalizability of the prediction models.
Definition of covariates and outcomes
CURB-65 was the measure used to predict the survival for pneumonia patients, based on an evaluation of confusion (C), BUN (U), respiratory rate (R), hypotension (B), and being aged ≥65 years for each individual. In our study, we applied the Glascow Coma Scale (GCS) as a substitute for confusion (20). A GCS score of ≤ 10 for patients with the use of invasive MV (IMV) and a GCS score of ≤ 14 for patients with the use of non-invasive ventilation (NIV) were defined as confusion. The criteria of hypotension were systolic blood pressure (SBP) of <90 mmHg or diastolic blood pressure (DBP) of ≤ 60 mmHg. An RR of ≥30/min and a blood BUN level of >19 mg/dl were defined as abnormal. Ventilator use included IMV and NIV. In this study, all enrolled patients were receiving either IMV or NIV. Under these conditions, respiratory rate (RR) does not represent the patient's true respiratory effort because the ventilator influences or determines the observed rate. For this reason, we did not use RR in the modified CURB-65 scoring. Instead, ventilator modality (IMV vs. NIV) was selected as a practical substitute for the RR component. A blood WBC count of <4,000 or >10,000, and Hb of ≤ 10 g/dl were considered an abnormal range. The outcome was survival during RCC admission.
Statistical analysis
Means and standard deviations (SDs) were used to describe continuous variables, while counts and percentages were employed for categorical variables. To compare distributions of baseline characteristics between RCC survivors and non-survivors, t-test and Chi-squared test were applied. A logistic regression was applied for odds ratios (ORs) and the corresponding 95% confidence intervals (CIs) to present associations of demographic and clinical predictors with RCC survival. The CURB-65, CUB-65 (excluding RR from the original CURB-65), and three new prediction models were constructed, and their predictive performances of RCC survival were evaluated using area under receiver operator characteristic curves (AUROCs) (21). DeLong's tests were applied to compare AUROCs between the new prediction models and CURB-65 for assessing their discriminative abilities (22). Besides, decision curve analysis (DCA) (23) and calibration curves were further conducted to comprehensively evaluate model performance (24). To develop RCC prediction models among CAP patients, 4/5 of them were included as the test sample for model training, and 1/5 of them were used for internal validation. The new prediction models developed were presented with nomograms for better visualization. We also evaluated the external validity of the new prediction models based on the predictive performance on 3-month survival or weaning from the ventilator. In addition, the prediction models were validated in HAP patients. We include the HAP patients for external validation because we want to know the possibility of the predictive models applied in this population, since the patients was part of the pneumonia patients in the hospital. The significance level was set to 0.05, and all statistical analyses were performed using SAS software (vers. 9.4; SAS institute, Cary, NC, USA).
Results
Study samples
In total, 270 patients were identified as having CAP in this study. To develop a prediction model, 4/5 of the entire study population (N = 216) was set as the test sample, and the remaining 1/5 was the validation sample (N = 54). Distributions of age, clinical factors (hypotension, BUN, confusion, GCS scores, WBCs, and Hb), and ventilator-related variables (RR and ventilator type) did not significantly differ between the test sample and validation sample, indicating that an unbiased evaluation of the prediction model with the validation sample could be made (Table 1). RCC survival rates of the test sample (87.5%) and validation sample (83.3%) were also similar (p = 0.4205; Table 1).
Ability of CURB-65 to predict RCC survival
In Supplementary Table 1, we compared the ability of CURB-65 and CUB-65 (with RR excluded from CURB-65) to predict RCC survival. AUROCs for CURB-65 and CUB-65 among CAP patients were 65.0% (95% CI = 56.7%, 73.3%) and 64.8% (95% CI = 57.0%, 72.5%), respectively. No significant difference was detected when applying CURB-65 and CUB-65 to predict RCC survival (p = 0.8425), suggesting that RR was not a necessary factor for the prediction model among the CAP population. We also assessed whether the new prediction models obtained better performances for predicting RCC survival compared to CURB-65 or CUB-65.
Associated factors for the new RCC survival prediction models
In the test sample, associations between clinical characteristics and RCC survival were examined (Table 2). Patients older than 65 years had a lower RCC survival rate (86.36%) compared to younger patients (100.0%). Patients with hypotension, and abnormal BUN, WBCs, and Hb values exhibited lower survived during RCC hospitalization compared to healthier patients. The type of ventilator used was significantly associated with RCC survival, at 80.8% for NIV and 95.8% for IMV. Patients with a confused status or a GCS score of ≤ 8 were seen to have lower survival rates than their comparators, and the difference in survival rates was statistically significant for GCS scores of ≤ 8.
Constructing new RCC survival prediction models
Table 3 and Figure 1 presents data of three new prediction models for RCC survival among patients with CAP. Nomograms for three new prediction models were also presented in Supplementary Figure 1. All of the models included the elements of the CURB-65 of being aged ≥65 years, hypotension, BUN >19 mg/dl, ventilator type (replacing RR), and a GCS score of ≤ 8 (replacing confusion). Either WBCs or Hb were additionally included in model 1 or model 2. And model 3 was an integrated model including all of the aforementioned variables. AUROCs for the test sample were 77.51% (95% CI = 67.66%, 87.36%) for model 1, 75.99% (95% CI = 65.69%, 86.30%) for model 2, and 77.97% (95% CI = 68.10%, 87.85%) for model 3. Compared to CURB-65 for predictions, all three models had higher AUROCs, and the increases in predictability were significant in models 1 (p = 0.0354) and 3 (p = 0.0383). All the comparisons were consistently presented when DCA and calibration analyses were performed, showing better performance with three new prediction models than CURB-65 (Supplementary Figure 2). All three models maintained satisfactory performance (at least 80% for AUROCs) to predict RCC survival in the validation sample.
ROC curves for three new prediction models in test sample and their comparisons in RCC survival predictability with CURB-65. Model 1 included elementary variables (aged ≥65 years, hypotension, BUN >19 mg/dl, ventilator type, GCS score of ≤ 8), and abnormal WBCs (<4,000 or >10,000). Model 2 included elementary variables, and abnormal Hb ( ≤ 10 g/dl). Model 3 included elementary variables, and both of abnormal WBCs and Hb.
External validation for 3-month survival as prediction models
Table 4 presents results of the RCC survival prediction models applied to extension analyses. External validation targeted the predictability of 3-month survival and weaning among patients with CAP. We also performed validation in HAP patients. For 3-month survival, the new prediction models did not work much better than CURB-65 among all patients with CAP, with an AUROC of about 70%. The new prediction models and CURB-65 presented worse abilities to predict weaning, with as low an AUROC of about 60%. Compared to the predictability of new models on RCC survival, those for 3-month survival and for weaning were both reduced. When the three prediction models were validated with the HAP sample, AUROCs increased to as high as 80%, but the performances were not significantly better than that of CURB-65.
Discussion
The models we built are more appropriate for predicting short-term survival in RCCs (for an average of 18.39 days). We could not predict the long-term survival of these patients, such as 1-year mortality. Hung conducted a series of studies focused on RCC settings in Taiwan. His study, specifically, investigated factors affecting the survival of patients with prolonged mechanical ventilation (MV) in these RCCs. The 1- and 5-year survival rates reported were 24.3 and 14.6%, respectively. Patients who successfully weaned and received a tracheostomy showed better survival outcomes. Factors related to patient outcome (ward mortality vs. discharged home) included end-stage renal disease (ESRD), receipt of a tracheostomy, and the presence of four or more morbidities (25, 26).
For our population, the new prediction models and CURB-65 presented poor abilities to predict weaning in CAP patients, with AUROCs of only about 60%. In a 2021 study, patients who failed extubation presented with higher mean CURB-65 scores (4.36) compared to their counterparts (3.88). Patients who scored 5 on the CURB-65 were significantly more likely to have failed the extubation process compared to those who scored 3 or 4 (27). In that study, there were different populations with high Burns Wean Assessment Program (BWAP) scores of ≥50. Neither CURB-65 nor our new models appear to be broadly predictive indicators for successful weaning in certain CAP patients.
In a study, some risk assessment scores including CURB-65 were used to predict all-cause 30-day mortality rate of 223 HAP patients. The PSI, CURB-65, SOFA, APACHE II, and qSOFA scores were significantly higher in non-survivors than in survivors. The CURB-65 score presented an AUROC of 0.744. This finding was consistent with our study. Notably, our CURB-65 scores showed better discriminative ability for survival among HAP patients, with AUROCs of up to 80%. The AUROCs of our new models performed even better than CURB-65, indicating the successful inclusion of effective predictive factors in our new models. However, the small sample size of HAP patients in our study resulted in a lack of power to detect differences in discrimination between the new models and CURB-65 (28).
For our population, fewer patients with GCS scores of ≤ 8, compared to the confusion status, survived, and a significant difference in the survival rate was detected. This was consistent with a previous study in that patients with GCS scores of 9–12 had a 99.3% faster recovery rate relative to patients with GCS scores of ≤ 8 [adjusted hazard ratio (AHR): 1.993; 95% confidence interval (CI): (1.358–2.924)]; and critically ill patients with GCS scores of 13–15 had two-fold longer recovery times than patients with GCS scores of ≤ 8 [AHR: 2.451; 95% CI: (1.483–4.051)] (2, 20, 29). So It was reasonable to use GCS scale 8 as a simplified cutoff point of GCS data grouping for outcome analysis. This indicates that the GCS could serve as a substitute for the confusion status. A GCS score of ≤ 8 could also be an easier cut-point for a new scoring system in ventilator-using populations.
RR is difficult to interpret once mechanical ventilation begins. In assisted or controlled IMV, the displayed rate often reflects the ventilator's cycling rather than the patient's intrinsic drive, as described by Yang and Tobin (30). Classic mechanical ventilation principles further emphasize that RR becomes machine-dependent after ventilatory assistance begins (31). For NIV, pressure support can change the patient's breathing pattern and make RR unstable, which Brochard et al. (32) have shown. Because of these limitations, ventilator modality gives a clearer indication of respiratory failure severity than RR in this population.
Lower Hb levels are associated with poorer weaning outcomes in MV patients. Low Hb levels impair oxygen delivery and respiratory muscle function. Consequently, this leads to an overall poor physical condition, which hinders the patient's ability to breathe independently after extubation. Lower Hb levels were found to be a significant predictor of higher mortality rates. Our previous studies found that lower Hb was associated with worse outcomes such as extubation failure and prolonged ventilation (33, 34).
A systematic review and meta-analysis found no significant differences in mortality prediction between the CURB-65, CRB-65, and PSI scores for CAP (35). Conversely, complete blood counts and differential leukocyte counts (CBCs/DCs) are commonly used for unidentified infections. The Blood Culture Prediction Index (BCPI), which combines CBC and DC, outperformed CURB-65 in predicting 30-day and in-hospital mortality. After integrating the CURB-65 and BCPI models, study results found a higher AUC than that of CURB-65 alone (36). Despite similar overall performances, each score has unique characteristics for different clinical settings.
The current limitations are as follows:(1) This was a retrospective, single-center study, which limits the external validity and may introduce bias. (2) The small sample size of HAP patients (n = 83) in the external validation cohort may affect the reliability of the results for this group. (3) The lack of external validation in a broader, multicenter CAP population is crucial to assess the generalizability of the models in different clinical settings. (4) Although we reviewed pre-existing pulmonary comorbidities from medical histories, we lacked the data of lung function tests. These prior pulmonary pathologies may significantly influence the clinical course and prognosis of patients managed with mechanical ventilation.
Future studies should apply the three predictive models in a prospective, multicenter study design to CAP or HAP populations. This would be helpful in establishing the generalizability of the models across different regions. If our new models are widely validated in further studies, we might design an outcome scoring system for patients under ventilator use in RCC. It wound possibly serve for a personalized weaning protocol and management, and translocation strategy. And this might further provide a specific intervention or decision planning in a RCC setting.
Conclusions
Our new models demonstrated a higher predictive accuracy for survival during RCC admission, compared to existing scores, giving clinicians a potentially more-effective tool for CAP patients undergoing difficult ventilator weaning. This improvement suggests that new models might be better suited to accurately predict outcomes in specific populations.
The reference list from the paper itself. Each links out to its DOI / PubMed record.
- 1Modi AR Kovacs CS. Community-acquired pneumonia: strategies for triage and treatment. Cleve Clin J Med. (2020) 87:145–51. doi: 10.3949/ccjm.87a.1906732127438 · doi ↗ · pubmed ↗
- 2Metlay JP Waterer GW Long AC Anzueto A Brozek J Crothers K . Diagnosis and treatment of adults with community-acquired pneumonia. An official clinical practice guideline of the American thoracic society and infectious diseases society of America. Am J Respir Crit Care Med. (2019) 200:e 45–67. doi: 10.1164/rccm.201908-1581 ST 31573350 PMC 6812437 · doi ↗ · pubmed ↗
- 3Nair GB Niederman MS. Updates on community acquired pneumonia management in the ICU. Pharmacol Ther. (2021) 217:107663. doi: 10.1016/j.pharmthera.2020.10766332805298 PMC 7428725 · doi ↗ · pubmed ↗
- 4Fine MJ Orloff JJ Arisumi D Fang GD Arena VC Hanusa BH . Prognosis of patients hospitalized with community-acquired pneumonia. Am J Med. (1990) 88:1N–8N. 2195886 · pubmed ↗
- 5Niederman MS Torres A. Severe community-acquired pneumonia. Eur Respir Rev. (2022) 31:220123. doi: 10.1183/16000617.0123-202236517046 PMC 9879347 · doi ↗ · pubmed ↗
- 6Confalonieri M Potena A Carbone G Porta RD Tolley EA Umberto Meduri G. Acute respiratory failure in patients with severe community-acquired pneumonia. A prospective randomized evaluation of noninvasive ventilation. Am J Respir Crit Care Med. (1999) 160:1585–91. doi: 10.1164/ajrccm.160.5.990301510556125 · doi ↗ · pubmed ↗
- 7Pan J Bu W Guo T Geng Z Shao M. Development and validation of an in-hospital mortality risk prediction model for patients with severe community-acquired pneumonia in the intensive care unit. BMC Pulm Med. (2023) 23:303. doi: 10.1186/s 12890-023-02567-537592285 PMC 10436447 · doi ↗ · pubmed ↗
- 8Wei C Wang X He D Huang D Zhao Y Wang X . Clinical profile analysis and nomogram for predicting in-hospital mortality among elderly severe community-acquired pneumonia patients: a retrospective cohort study. BMC Pulm Med. (2024) 24:38. doi: 10.1186/s 12890-024-02852-x 38233787 PMC 10795228 · doi ↗ · pubmed ↗