Correlation of human sperm intracellular pH in non-normozoospermic men with fertilization rates in assisted reproduction procedures
Paulina Torres-Rodríguez, Gabriela Carrasquel-Martínez, Arturo Matamoros Volante, Andrés Aragón-Martínez, Diana Lisbeth Flores, Israel Maldonado, Claudia L. Treviño

TL;DR
The study explores how sperm cell pH levels relate to fertilization success in men with abnormal sperm, suggesting pH could help predict outcomes in fertility treatments.
Contribution
The study introduces the role of sperm intracellular pH in predicting fertilization success in non-normozoospermic men undergoing ART.
Findings
Higher basal pHi and reduced delta pHi in ICSI cycles correlate with higher fertilization rates in teratozoospermia patients.
pHi values differ significantly among diagnostic groups and vary by ART method.
Sperm pHi could serve as a predictive tool for fertilization success in assisted reproduction.
Abstract
Intracellular pH (pHi) in sperm cells plays a crucial role in various physiological processes, including motility, capacitation, and fertilization. While previous studies have shown a positive correlation between sperm pHi and fertilization success in normozoospermic patients undergoing fertility treatments, its role in non-normozoospermic individuals is unclear. This study investigates the relationship between sperm pHi and fertilization outcomes in patients undergoing assisted reproduction techniques: in vitro fertilization (IVF) and intracytoplasmic sperm injection (ICSI). Qualitative sperm pHi evaluation was performed using time-lapse flow cytometry, and both basal pHi and pHi response capacity (delta pHi) were assessed in sperm samples from patients diagnosed with teratozoospermia, asthenoteratozoospermia, or hypoteratozoospermia. Our results revealed significant differences in…
Genes, proteins, chemicals, diseases, species, mutations and cell lines named across the full text — each resolved to its canonical identifier and authoritative record.
Click any figure to enlarge with its caption.
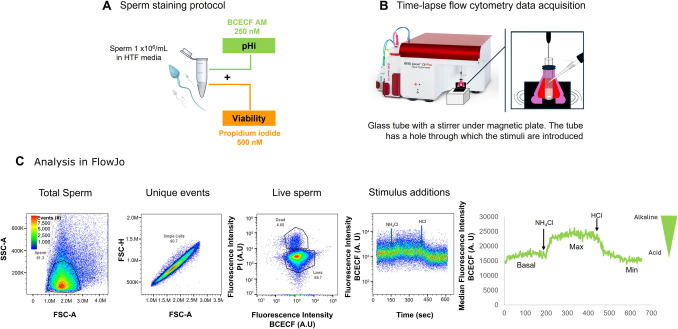 Figure 1
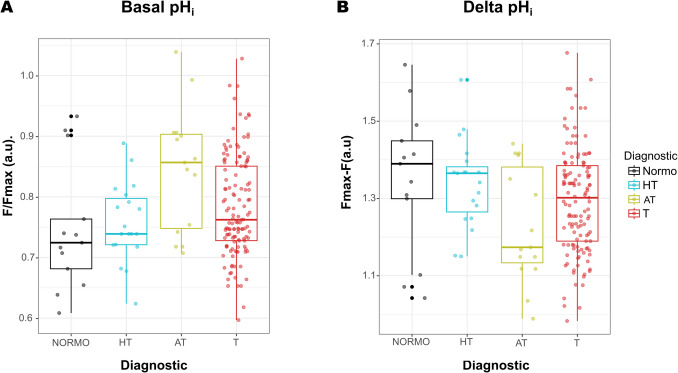 Figure 2
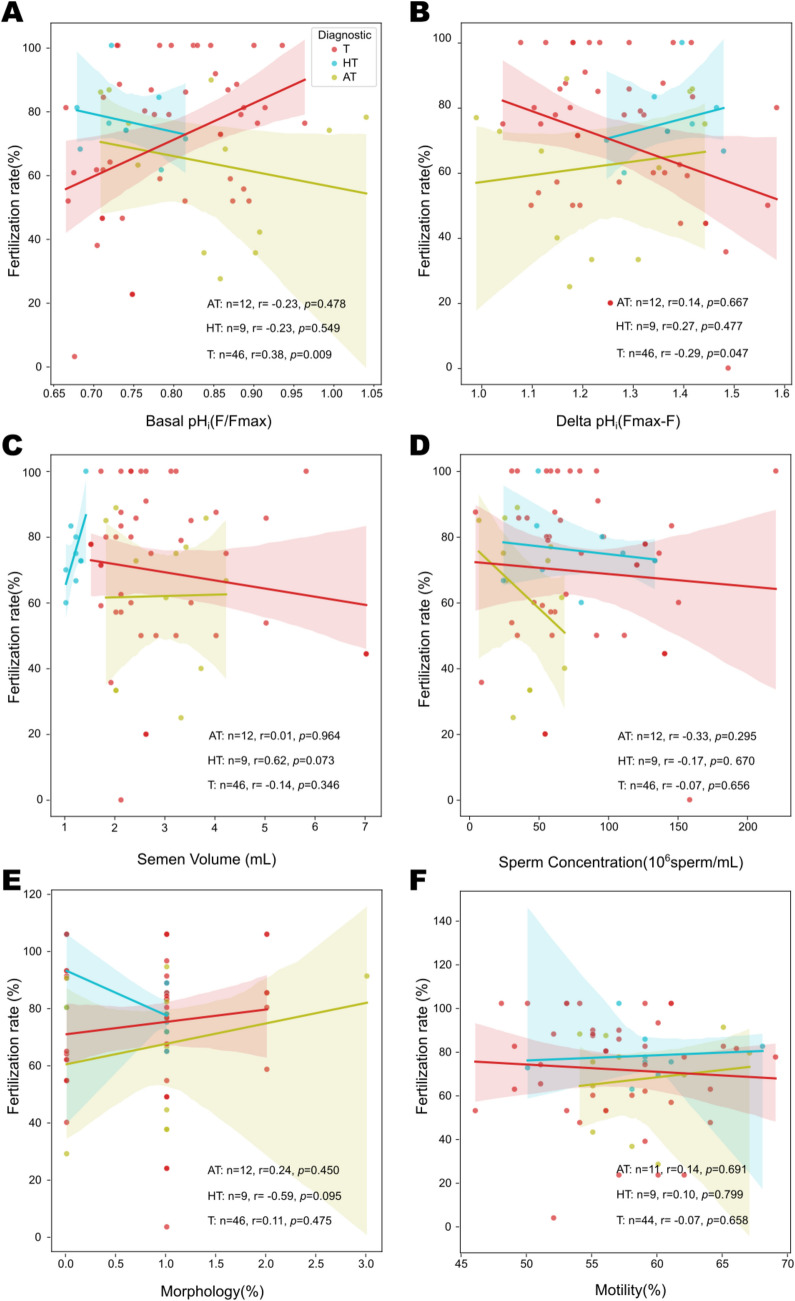 Figure 3
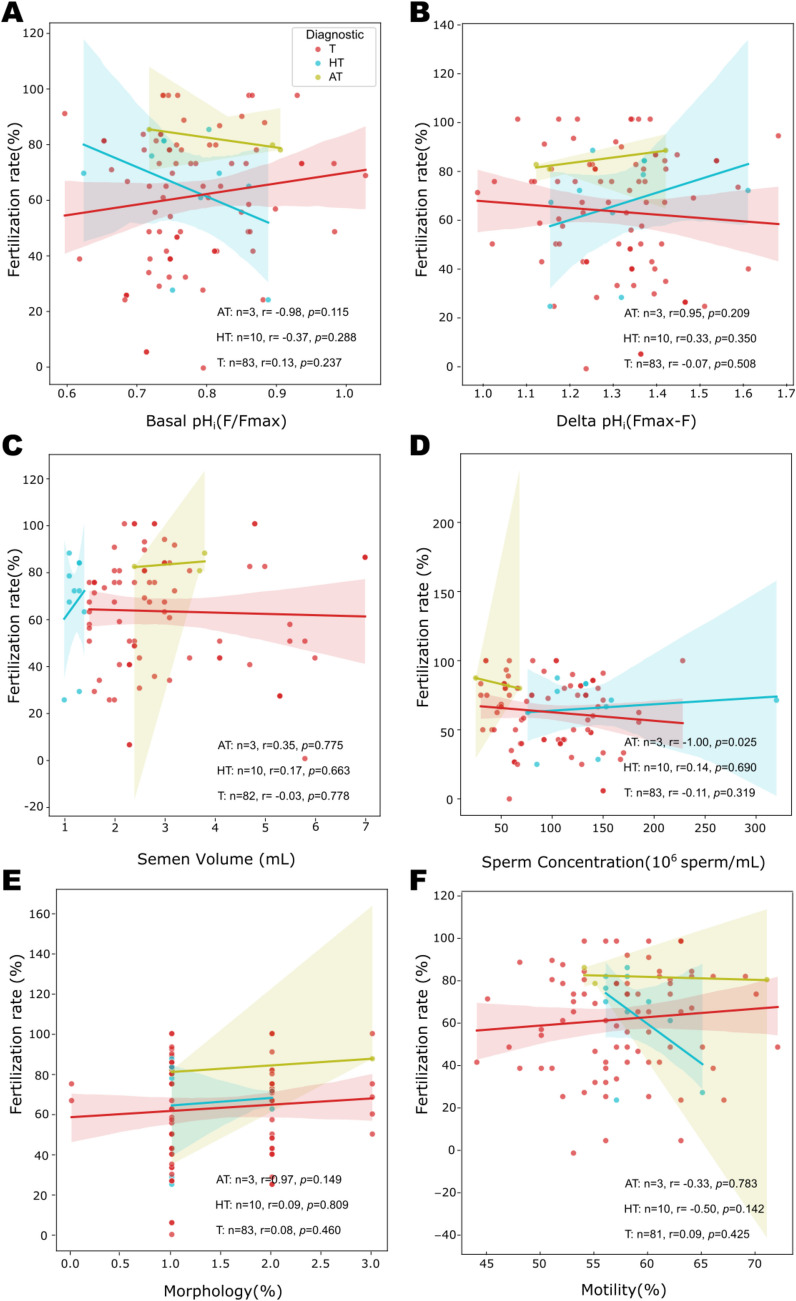 Figure 4
- —http://dx.doi.org/10.13039/501100006087Dirección General de Asuntos del Personal Académico, Universidad Nacional Autónoma de México
- —Centro de Innovación Tecnológica y Medicina Reproductiva
Peer Reviews
No public reviews on file for this paper yet. If you reviewed it on a platform where reviews are public (OpenReview, ICLR, NeurIPS, ICML), you can paste yours below so the community can read it here.
Videos
No videos yet. Explain this paper in a talk, walkthrough, or lecture? Add one.
Taxonomy
TopicsSperm and Testicular Function · Reproductive Biology and Fertility · Ovarian function and disorders
Introduction
Human infertility is a medical condition characterized by the inability of a couple to conceive a pregnancy after 12 months of regular, unprotected sexual intercourse and affects 17.5% of adults globally [1]. Among male factors, sperm dysfunctions are considered the most frequent etiology of fertility problems. Male factors, including genetic, lifestyle, and unknown issues, account for approximately half of all infertility cases [1]. Current protocols for sperm analysis do not successfully predict the fertilizing capacity of semen samples from men seeking reproductive treatment. The most common approach to detecting such dysfunctions in sperm is through the evaluation of macro- and microscopic semen parameters, commonly referred to as semen analysis or seminogram. Individuals whose values fall within the reference ranges are classified as normozoospermic and are presumed to be fertile. However, the utility of these parameters as predictors of reproductive outcomes has been a topic of long-standing debate. Interestingly, the latest edition of the WHO manual for semen handling (2021) now recommends the development of techniques for functional sperm analysis, which may offer greater predictive value for fertility [2].
Sperm cells precisely adjust their pH_i_ to maintain a dynamic balance between production, elimination, transport, and buffering of H^+^ within cells at specific times, helping to regulate different functions [3, 4]. Several key sperm proteins are regulated by pH_i_, including the Ca^2+^ channel CatSper (sperm cation channel), which is involved in sperm hyperactivation [5, 6] and the K^+^ selective ion channel SLO3, which participates in membrane potential regulation during capacitation [7, 8]. When sperm encounter a medium that induces capacitation, the pH_i_ increases in the head and principal piece of the flagellum with different kinetics [9]. Thus, sperm possess the ability to regulate pH_i_ in a spatial–temporal manner [3, 9, 10]. The final stages of fertilization involve complex membrane interactions between sperm and egg, and changes in sperm pH_i_ may influence this process.
One study showed that sperm pH_i_ from normozoospermic infertile patients positively correlates with both hyperactivated motility and conventional in vitro fertilization (IVF) success [11]. Additionally, our group reported that normozoospermic men with a proven paternity history display a pH_i_ increase during in vitro capacitation, which is absent or less frequent in men of unproven paternity [9], demonstrating pH_i_’s relevance to sperm fertilizing capacity. To our knowledge, pH_i_ evaluations in non-normozoospermic patients had not been conducted. This is particularly significant since in our fertility clinic, approximately 95% of the semen samples present different grades of teratozoospermia diagnosis. Teratozoospermia is defined as a semen sample with less than 4% of morphologically normal sperm according to the WHO manual [2]. The majority of the samples in the present study presented isolated teratozoospermia, but some also presented asthenoteratozoospermia (reduced motility and normal morphology) or hypoteratozoospermia (reduced volume and normal morphology). Several studies have demonstrated a correlation between sperm morphological abnormalities and other affectations in the sperm such as nuclear genetic defects, apoptotic alterations, and increased reactive oxidative stress, all of which can adversely affect fertility potential [12–14]. Consequently, intracytoplasmic sperm injection (ICSI) is frequently recommended for men with teratozoospermia. However, the existing literature presents inconsistent findings regarding the impact of teratozoospermia on pregnancy outcomes and the success of ART proceedings [15, 16]. Notably, one study reported that isolated teratozoospermia was more prevalent among fertile males compared to infertile males [17]. For these reasons, pH_i_ evaluation in capacitated sperm from semen samples with teratozoospermia diagnosis of men undergoing ART treatment could serve as a valuable tool to help clinicians select optimal fertilization techniques for each couple.
Multicenter randomized controlled studies have been conducted to compare the efficacy of ICSI and conventional IVF in couples with non-severe male infertility, aiming to provide valuable insights for optimal treatment selection in such cases. The choice between ICSI and IVF involves multiple factors, including the severity of male infertility, semen quality, previous ART cycle outcomes, financial considerations, and the couple’s personal preferences [18]. In this context, identifying relevant sperm markers to inform decisions on the most effective ART approach is an expanding and important research field. This study assessed whether a correlation exists between sperm basal pH_i_ and pH_i_ response capacity (delta pH) with levels and fertilization rates, considering different seminal diagnoses in patients undergoing ART (IVF and ICSI), and further explored the potential use of sperm pH_i_ levels as a predictive marker of fertilizing capability for both techniques.
Materials and methods
Ethics statement and inclusion criteria
This study included semen samples from patients who attended the assisted reproduction clinic for in vitro fertilization (IVF) or intracytoplasmic sperm injection (ICSI) treatments between January 2023 and March 2025. All semen samples were subjected to a classical seminogram test, and the following parameters were determined manually: semen volume, sperm concentration (millions/mL), percentage of normal morphology, and percentage of progressive motility. Semen samples were classified following the protocols described in the WHO Laboratory Manual for the Examination and Processing of Human Semen [2] into three diagnostic groups: (1) teratozoospermia (T): percentage of spermatozoa with normal morphology below the reference value (< 4%), 129 semen samples; (2) asthenoteratozoospermia (AT): combination of reduced motility (< 32% of spermatozoa with progressive motility) and morphological alterations, 15 semen samples; and (3) hypoteratozoospermia (HT): combination of reduced semen volume (< 1.5 mL) and morphological abnormality, 19 semen samples. All samples were anonymized and handled following ethical standards approved by the fertilization clinic. Sperm samples in ART cycles involving four or more inseminated oocytes were included. Frozen semen samples were excluded. For this study, only the surplus of the seminal samples available after completing their respective ART procedures was employed. The results of this investigation did not influence technicians, clinicians, or patients’ treatment decisions. Given that this study is subject to a confidentiality agreement with the fertilization clinic, only fertilization rate data were available to assess ART success and were used to correlate with the pH_i_ levels and seminogram parameters determined for each sample.
To have pH_i_ reference values, this study also included semen samples from 13 men (donors) with a normal seminogram (sperm concentration × 10^6^/mL ≥ 16, progressive motility (%) ≥ 32, normal morphology (%) ≥ 4). These samples were not subjected to ART treatments. All participants (donors and patients) signed an informed consent for the use of their samples for research purposes.
Medium and reagents
The capacitating medium used was HTF HEPES medium (Human Tubal Fluid medium; InVitroCare Inc., CA, USA), supplemented with 10% w/v human serum albumin (HSA; InVitroCare Inc., CA, USA). The fluorescent dye 2′,7′-Bis-(2-Carboxyethyl)−5-(and-6)-Carboxyfluorescein, Acetoxymethyl Ester (BCECF-AM) was sourced from Thermo Fisher Scientific (Waltham, MA, USA), and propidium iodide (PI) was obtained from Molecular Probes-Invitrogen, Inc. (Eugene, OR, USA). Stock solutions of fluorescent dyes and test compounds were prepared in dimethyl sulfoxide (DMSO), except for NH_4_Cl, which was prepared in tri-distilled water.
Sperm sample preparation
Semen samples (from donors and patients) were collected by masturbation in sterile containers after sexual abstinence of 2–5 days. Since only patients’ samples were subjected to ART, these samples were collected on the same day as oocyte retrieval. After the sample liquefied for approximately 10–15 min at room temperature, motile spermatozoa were recovered using the density gradient technique according to WHO guidelines [2], with the upper (90%) and lower (45%) layers of SpermCare (InVitroCare Inc., CA, USA) gradient solutions. Briefly, solutions were layered sequentially in a 5 mL tube, arranged from the lowest to the highest concentration in a 1:1 v/v ratio, and finally an equal volume of the semen sample was placed at the top of the tube. The tube with the gradient was centrifuged at 1200 × g for 10 min at room temperature, and the pellet obtained was washed once with fresh pre-warmed HTF medium and centrifuged again at 1200 × g for 7 min at room temperature. The supernatant was discarded, and the pellet was resuspended in 70–160 µL of pre-warmed HTF medium to be used in further ART cycles. After the ART treatment was completed, the surplus sperm sample was adjusted to a concentration of 1 × 10^6^ sperm/mL using a Makler chamber (Sefi-Medical Instruments ltd. Haifa, Israel). This adjusted sperm suspension was used for flow cytometry analysis.
Single-sperm selection andpHi data acquisition
The fluorescent pH_i_-sensitive dye BCECF-AM was used to assess sperm pH_i_ qualitatively. Sperm were stained with 250 nM BCECF-AM for 10 min, and prior to data acquisition, 500 nM of the fluorescent viability marker, PI, was added to select only the population of live cells (Fig. 1A). Upon entering cells, BCECF-AM undergoes enzymatic hydrolysis of its acetoxymethyl ester (AM) group, resulting in the accumulation of free BCECF within the cytoplasm. BCECF fluorescence increases with alkaline pH_i_ and decreases in acidic environments.Fig. 1. Human sperm pHi measurement protocol using a BD Accuri™ C6 Plus Flow Cytometer.** A** Diagram of sperm double staining with the pH_i_-sensitive dye BCECF-AM and propidium iodide (PI) as a viability marker. B Representation of the BD Accuri™ C6 Plus cytometer showing the adaptation to allow adding and mixing of different compounds with a micropipette into the tube during constant fluorescence recording. C Sequence of data analysis using FlowJo software, in order to finally select only single live sperm. Forward and side scatter properties (FSC and SSC) were recorded for each sample, and threshold values were established to eliminate debris and cell fragments. Subsequently, a two-dimensional density plot of FSC height and area was employed to isolate spermatozoa from cell aggregates. Only live (PI-negative) cells were subjected to further analysis. The addition of NH_4_Cl enables the recording of maximum fluorescence (due to alkalinization), which is then used to normalize the basal pH_i_ value (F/Fmax) and to calculate the delta pHi. The delta pHi represents the difference between the maximum response elicited by NH_4_Cl and the basal fluorescence level prior to stimulation (Fmax-F). As a control that the cells respond properly, HCl was added at the end of the trace to induce an acidification which produces a decrease in fluorescence. A representative trace showing the median fluorescence after each stimulus is shown
Individual cellular events were captured using a BD Accuri C6 Plus flow cytometer (Becton Dickinson, Franklin Lakes, NJ, USA) (Fig. 1B). Measurements were conducted at a constant temperature (23 °C) in continuous mode, allowing for time-lapse analysis at a flow rate of 14 µL/min. BCECF fluorescence and PI were detected by exciting the sample with a 488-nm laser, and emission was collected using a 533/30-nm filter (FL-1 channel) for PI and a 670 LP filter (FL-3 channel) for BCECF fluorescence, respectively. Sperm were selected using FSC-A and SSC-A values; doublets and aggregates were discarded from the analysis by selecting only unique events through comparison of area (FSC-A) and height (FSC-H). Only viable individual cells were included in the analysis, and dead cells were excluded through PI staining (PI +) (Fig. 1C). The baseline BCECF fluorescence was recorded for the first 60 s (named basal pH_i_). Subsequently, 20 mM NH₄Cl was added to induce intracellular alkalinization (observed as a BCECF fluorescence increase). Finally, 5 mM HCl was added to induce intracellular acidification (observed as a BCECF fluorescence decrease). The total duration of the recordings was 10 min.
To further evaluate sperm BCECF fluorescence in a qualitative manner, the average BCECF fluorescence level (F) was normalized using the maximum response achieved by the addition of 20 mM NH₄Cl (named Fmax). This F/Fmax ratio was also employed to equalize the variability of BCECF fluorescence readings from different samples (Fig. 1C). Additionally, a delta pH_i_ value was calculated by subtracting the basal F value from the Fmax. This represents the difference between the maximum fluorescence reached after the addition of NH₄Cl and the basal pH_i_ fluorescence. As sperm become alkalinized, the delta pH_i_ decreases because the NH₄Cl alkalinization response is smaller. Conversely, the more acidic the basal pH_i_, the greater the delta pH_i_. The pH_i_ response capacity or delta pH_i_ is an indirect measure of sperm pH_i_ and its regulation.
Fertilization rates for ART treatments
The decision to use ICSI or IVF was made and performed by expert clinical embryologists, independently of this study and not by the authors of the present work. Therefore, we did not include the detailed ART procedures, as they were not a direct part of this study. Of the total 163 ART cycles analyzed during this study, the basal pH_i_ levels of sperm from 67 samples were assigned to patients undergoing ICSI, while 96 samples were allocated to patients inseminated via conventional IVF protocols. The outcomes of those treatments were provided to us to correlate with our pH_i_ measurements. The fertilization rate was calculated by embryologists by dividing the number of zygotes by the total number of mature oocytes [19]. Additionally, samples from 13 donors were evaluated to provide a reference of basal pH_i_ values from healthy men. Sperm samples from donors were not subjected to ART treatment.
Statistical analysis
Flow cytometry experimental data from the BD Accuri C6 Plus were saved in the standard FCS format. The FCS files were first analyzed using FlowJo Software version 10.1 by FlowJo, LLC (Ashland, USA). Cytometry data and values of seminal parameters were used to construct a dataset in comma-separated values (CSV) format for further analysis. Differences in fluorescence values were analyzed using one-way ANOVA with a model of orthogonal contrasts (linear contrasts). Correlations among values of fluorescence variables, fertilization rate, and parameters from seminogram were analyzed by Pearson correlation test. For all tests, p < 0.05 was considered significant.
All statistical analyses were performed in R version 4.4.1 [20] and Python version 3.12.2 running in Jupyter Notebook version 7.2.2 using Anaconda version 2.6.3. Plots were constructed with ggplot2 version 3.5.1 [21] and matplotlib version 3.9.2. Final figures were produced using Inkscape 0.91 (Inkscape.org).
Results
Comparison of semen parameters and basal pHi between normozoospermic and non-normozoospermic men
We first compared the basic parameters of semen analysis between our reference group of normozoospermic donors (n = 13; NORMO) and our study group of non-normozoospermic patients (n = 163; NON-NORMO). Semen samples from the patients were classified as teratozoospermic (n = 129; T), asthenoteratozoospermic (n = 15; AT), and hypoteratozoospermic (n = 19; HT) according to the 2010 WHO Manual [2]. The average values for each group are shown in Table 1. Since the difference in semen volume, motility, and morphology is used to classify the samples into each diagnostic category, we could only compare the sperm concentration among samples. The average values (expressed as millions of cells per mL of semen) were 108 for HT, 42 for AT, 91 for T, and 93 for NORMO. Interestingly, there were statistically significant differences among the samples: AT vs. HT p = 0.0002, AT vs. NORMO p = 0.002, and AT vs. T p = 0.0001 (using Kruskal–Wallis with Dunn’s post-hoc test) (Table 1). Table 1. List of patients and donors processed. This table displays data from 163 patients and 13 donors, detailing their clinical profiles, assisted reproductive technology (ART) outcomes, pH basal, and delta pH#Oocytes protocolSemen volume (mL)Concentration (cells × 10^6)Morphology (%)Motility (%)DiagnosticBasal pHiDelta pHiFemale age (years)Male age (years)Obtained oocytes (number)ART procedureAssigned IVFAssigned ICSIZygote totalFertilizationFertilization rate (%)1Patient2.657152T0.8191.31543459IVF9080.89892Patient3.5112158T0.8711.153373215IVF150120.80803Patient3.5112158T0.8151.226373214IVF14060.43434Patient6106144T0.7421.38538387IVF7030.43435Patient2.379248T0.7811.291393820ICSI013131.001006Patient1.3145165HT0.7511.31436387IVF7020.29297Patient434053T0.8721.18043438ICSI0630.50508Patient1.5126156T0.7741.321434210ICSI0970.78789Patient1.570260T0.8501.17939337IVF7040.575710Patient5.864262T0.8601.16341294IVF4020.505011Patient1.5126156T0.7921.282434210ICSI0970.787812Patient1.5126156T0.8821.145434210ICSI0970.787813Patient2.481254T0.8611.170404015IVF150151.0010014Patient3.565055T0.8131.230404120ICSI020170.858515Patient2.161055T0.8771.16649429ICSI0870.888816Patient2.161055T0.8691.14849428ICSI0740.575717Patient2.692160T0.8511.204434013IVF130120.929217Patient2.692160T0.8511.204434012ICSI011100.919118Patient1.1153258HT0.8611.15235399IVF9060.676719Patient2.5630T0.7291.379363614ICSI011111.0010020Patient2.5111156T0.8661.13137487IVF7030.434321Patient2.5111156T0.8921.09737484ICSI0420.505022Patient2.880154T0.9361.107453620IVF200150.757523Patient1.7220161T0.9341.076373712ICSI0771.0010024Patient1.9129263T0.8811.15932354IVF4010.252525Patient2120148T0.8831.137423510IVF10090.909026Patient2.172150T0.8991.126272823IVF12070.585827Patient2.172150T0.8991.126272823ICSI0771.0010028Patient535055T0.8661.154414314ICSI014120.868629Patient152150HT0.8131.247394013ICSI01070.707030Patient5.858153T0.7951.23338434IVF4400.00031Patient5.858153T0.7951.23338434ICSI0441.0010032Patient1.6167254T0.7951.25740407IVF7020.292933Patient4.2136269T0.9031.11634368ICSI0860.757534Patient350132T0.8201.224433412IVF12080.676735Patient1.752053T0.6741.407363522ICSI022130.595936Patient1.98.2034T0.7031.483323618ICSI01450.363637Patient1.896251T0.6641.584384311IVF11080.737338Patient1.896251T0.6641.584384310ICSI01080.808039Patient3.130135T0.7281.41528327IVF6050.838340Patient3.130135T0.7281.41528327ICSI0661.0010041Patient3.1140357T0.8601.17030315IVF5030.606042Patient4.192260T0.8121.23439417IVF7030.434343Patient2.3150170T0.7141.359283817IVF17010.06644Patient2.654135T0.7471.254383610IVF10080.808045Patient2.654135T0.7471.254383610ICSI01020.202046Patient1.7150160T0.7461.30439549IVF9030.333347Patient2.3108250T0.7481.339343810IVF10040.404048Patient5.363155T0.6851.462343815IVF15040.272749Patient1.3133137HT0.7391.367413912IVF120100.838350Patient1.3133137HT0.7391.367413912ICSI01180.737351Patient353155T0.6531.53442366IVF6050.838352Patient1.2110060HT0.7171.416403810ICSI0860.757553Patient2.5119162T0.7321.390353210IVF10030.303054Patient2.1145153T0.7111.41742435IVF5040.808055Patient2.1145153T0.7111.41742436ICSI0650.838356Patient366125AT0.7541.350424020ICSI01380.626257Patient4.7118139T0.7571.348323911IVF11090.828258Patient2.346032T0.7101.36236445ICSI0530.606059Patient3.5150161T0.7021.339394110ICSI01060.606060Patient2.169160T0.7191.392293910IVF10040.404061Patient2.169160T0.7191.392293910ICSI0850.636362Patient3.1170159T0.7701.34340446IVF6020.333363Patient1.7120176T0.8571.18941418ICSI0750.717164Patient7140151T0.7341.393394321IVF210180.868665Patient7140151T0.7091.443394320ICSI01880.444466Patient2.4138258T0.7581.335454725IVF250120.484867Patient1.6133268T0.8571.16741398IVF8060.757568Patient128249T0.8041.248363915IVF11090.828269Patient2.8104162T0.7451.339393610IVF100101.0010070Patient1.2320266HT0.8181.21841418IVF7050.717171Patient2.859050T0.6671.56641434ICSI0420.505072Patient4.770164T0.6181.60737355IVF5020.404073Patient3.458121AT1.0390.989403616ICSI013100.777774Patient1.675249T1.0280.983365117IVF170120.717175Patient1.536158T0.9831.02239324IVF4030.757576Patient1.476245HT0.7911.29441388IVF8050.636377Patient1.237027HT0.7721.25737398ICSI0860.757578Patient1.5121355HT0.7631.30841374IVF4020.505079Patient180132HT0.7831.281373616ICSI01060.606080Patient1.3158248HT0.6241.60735447IVF7050.717181Patient1.449058HT0.7211.396404010ICSI0771.0010082Patient185158HT0.8881.15042394IVF4010.252583Patient43.9053T0.7311.359394312ICSI0870.888884Patient4.226129AT0.8631.11832377ICSI0640.676785Patient230056T0.9361.11445338IVF8060.757586Patient3.331024AT0.8571.17334345ICSI0410.252587Patient243128AT0.8361.21733404ICSI0310.333388Patient243128AT0.9011.30933404ICSI0310.333389Patient1.1105141HT0.8031.24835428IVF8070.888890Patient1.1105141HT0.7211.36535429IVF9070.787891Patient2145254T0.7421.37236396IVF6040.676792Patient234119AT0.8451.168474751ICSI045400.898993Patient1.5185166T0.7481.33735359IVF9050.565694Patient1.5185166T0.7381.32635358IVF8050.636395Patient2.441144T0.7701.29141347ICSI0760.868696Patient2.441144T0.7331.35941348IVF8040.505097Patient2.1158157T0.6751.48742414ICSI0300.00098Patient3.768131AT0.9061.14928305IVF5040.808099Patient3.768131AT0.9061.14928305ICSI0520.4040100Patient346139T0.8031.22621208IVF8050.6363101Patient2.456130AT0.8951.118304411IVF11090.8282102Patient2.456130AT0.9931.035304411ICSI01180.7373103Patient530259T0.8861.112383820ICSI01370.5454104Patient2.634156T0.8231.18030368ICSI0881.00100105Patient2.332153T0.8621.17139414IVF4020.5050106Patient5128249T0.8131.241363915IVF11090.8282107Patient1.295138HT0.6781.464374132ICSI025200.8080108Patient1.86.3023AT0.7071.412364126ICSI020170.8585109Patient1.148153HT0.7801.34143416ICSI0650.8383110Patient2.2228272T0.7381.38141405IVF5051.00100111Patient257164T0.8861.17540366ICSI0540.8080112Patient2.355235T0.9131.10329306ICSI0540.8080113Patient2.355235T0.8451.21229306ICSI0661.00100114Patient2.458355T0.7591.33737324IVF4041.00100115Patient2.458355T0.7561.35537324IVF4030.7575116Patient355153T0.5971.677383526IVF150140.9393117Patient258041T0.7811.27230308ICSI0740.5757118Patient4.835263T0.9301.07533334IVF4041.00100119Patient4.835263T0.8651.21333334IVF4041.00100120Patient7140151T0.7341.393394321IVF210180.8686121Patient7140151T0.7091.443394320ICSI01880.4444122Patient1.548263T0.7951.28532316IVF6040.6767123Patient2.1125250T0.7321.36938398IVF8060.7575124Patient3.224024AT0.7421.441413915ICSI01290.7575125Patient2.650374T0.6861.481373619IVF190130.6868126Patient3.356133T0.7621.314404220ICSI019150.7979127Patient3.2150263T0.7671.302383411IVF110100.9191128Patient3.2150263T0.7511.333383414IVF140100.7171129Patient1.6133268T0.7841.26641394IVF4030.7575130Patient1.6133268T0.8361.20841394IVF4030.7575131Patient3.291047T0.8281.180303110ICSI0881.00100132Patient3.291047T0.8131.194303110ICSI0840.5050133Patient2.8104162T0.7371.354393610IVF100101.00100134Patient2.860158T0.7171.417393320IVF20070.3535135Patient4.143146T0.7181.407263216IVF8040.5050136Patient2.3150170T0.7141.359283817IVF17010.066137Patient2.654135T0.7471.254383610IVF10080.8080138Patient2.654135T0.7471.254383610ICSI01020.2020139Patient2.3108250T0.7481.339343810IVF10040.4040140Patient5.363155T0.6851.462343815IVF15040.2727141Patient353155T0.6531.53442366IVF6050.8383142Patient2.654135T0.7471.254383610IVF10080.8080143Patient2.654135T0.7471.254383610ICSI01020.2020144Patient353155T0.6531.53442366IVF6050.8383145Patient2.3108250T0.7481.339343810IVF10040.4040146Patient5.363155T0.6851.462343815IVF15040.2727147Patient4.192260T0.8121.23439417IVF7030.4343148Patient1.3133137HT0.7391.367413912IVF120100.8383149Patient1.3133137HT0.7391.367413912ICSI01180.7373150Patient1.7120176T0.8571.18941418ICSI0750.7171151Patient2.4138258T0.7581.335454725IVF250120.4848152Patient7140151T0.7341.393394320ICSI01880.4444153Patient7140151T0.7091.443394321IVF210180.8686154Patient2.780148T0.9621.04141374ICSI4030.7575155Patient2.780148T0.7771.29241374IVF0430.7575156Patient2.750044T0.7181.41437436IVF6040.6767157Patient1.224145HT0.6821.47838417ICSI0320.6767158Patient5.5135171T0.7261.36136417IVF7040.5757159Patient5.5135171T0.9841.01736416IVF6030.5050160Patient266248T0.6831.50643414IVF4010.2525161Patient266248T0.7641.36643415IVF5040.8080162Patient3.825323AT0.7181.41743458IVF8070.8888163Patient3.825323AT0.7181.417434514ICSI014120.86861DonorND64459Normozoospermic0.9331.071242DonorND210478Normozoospermic0.9011.042463Donor1.393454Normozoospermic0.7631.309334Donor9130469Normozoospermic0.7071.406315Donor3.458472Normozoospermic0.6541.449286Donor2.187459Normozoospermic0.6081.646277Donor1.581463Normozoospermic0.6811.490318Donor2.671452Normozoospermic0.6381.578209Donor2.373767Normozoospermic0.7371.3432510Donor3.278452Normozoospermic0.7401.3902811Donor1.687458Normozoospermic0.7161.4143312Donor3.696473Normozoospermic0.7241.2991913Donor1.778461Normozoospermic0.9101.10230^*^ND not determined
Assessment of sperm basal pHi by time-lapse flow cytometry
Subsequently, we qualitatively evaluated sperm basal pH_i_ levels utilizing the fluorescence of the pH-sensitive dye BCECF. We plotted the median basal pH_i_ (Fig. 2A) and delta pH_i_ (Fig. 2B) fluorescence values for each sperm sample. We found that all groups (AT, HT, and T) showed a more alkaline basal pH_i_ (i.e., higher fluorescence values) compared to normozoospermic controls; however, we only found significant differences in AT vs. N (p = 0.0005), and among the other groups, the differences were not statistically significant (Fig. 2A). Consistently, the delta pH_i_ values were lower in AT, HT, and T samples compared to normozoospermic controls; in this case, we detected a significant difference only for the AT group compared to the normozoospermic control (p = 0.009) (Fig. 2B).Fig. 2. Determination of qualitative basal pH_i_values from non-normozoospermic men undergoing different ART treatments. Boxplots showing normalized BCECF fluorescence that represents basal pH_i_ (A) and Delta pH_i_ (B) values, comparing sperm samples from hypoteratozoospermic (HT), asthenoteratozoospermic (AT), and teratozoospermic (T) patients. Fluorescence values in non-normozoospermic groups were compared to those of the normozoospermic group. Comparisons were examined by one-way ANOVA analysis in a model of linear contrasts (orthogonal contrasts). Boxes represent the interquartile range (IQR), spanning from the first quartile (Q1) to the third quartile (Q3), with the median indicated by the horizontal line inside each box. Whiskers extend to the most extreme values within 1.5 × IQR (IQR = Q3 − Q1) below Q1 and above Q3. Data points outside this range are plotted as outliers. Colored dots are the data points measured in each group. Kruskal–Wallis with post-hoc (Dunn with Bonferroni test) analysis of data from (A) and (B) revealed that there were not significant differences among any of the groups
Additionally, we investigated whether the basal sperm pH_i_ differed between sperm samples in each group AT, HT, and T undergoing ICSI (n = 67) and those undergoing conventional IVF (n = 96). For the analysis, we performed Pearson’s coefficient analyses (r value) and evaluated the significance (p value). For ICSI treatment, we detected that only for the teratozoospermic group (marked in red), there was a correlation between the basal pH_i_ value and the fertilization rate. This correlation is positive (r = 0.38) although moderate, but highly significant (p = 0.009) (Fig. 3A). This indicates that the more alkaline the basal pH_i_, the higher the fertilization success rate in patients undergoing ICSI. Consistently, delta pHᵢ values were inversely correlated with fertilization rates, meaning that as delta pHᵢ value decreases, the fertilization rate increases (Fig. 3B). Delta pHᵢ values correlated significantly only in patients with teratozoospermia, a weak negative correlation with an r value of − 0.29, but significant (p = 0.047).Fig. 3. Sperm pH_i_alkalinization, but not semen parameters, correlates with fertilization rate success in ICSI. The percentage of fertilization rate was plotted against basal pHi (A), Delta pHi (B), semen volume (C), sperm concentration (D), percentage of normal morphology (E), and percentage of motility (F). The Pearson correlation r and p values are shown for each diagnostic group: teratozoospermic (T, red), hypoteratozoospermic (HT, blue), and asthenoteratozoospermic (AT, green). A significant correlation was found between fertilization rates only for pH_i_ values. The more alkaline the basal pHi and the smaller the Delta pHi, the higher the fertilization rate. The shaded area represents the 95% confidence interval
To underscore the importance of the correlation found with pHᵢ values, we examined whether there was any weighting of the fertilization rate with respect to the macroscopic parameters of the sample, namely semen volume (Fig. 3C), sperm concentration (Fig. 3D), percentage of normal morphology (Fig. 3E), and percentage of motile sperm (Fig. 3F). We found that there were non-significant correlations of these semen parameters with the fertilization rate.
Gunderson et al. [11] conducted a study showing that there is a positive correlation between higher sperm pHᵢ values and conventional IVF fertilization rates in sperm samples from normozoospermic patients. In our study, when we performed the Pearson correlation between fertilization rates and basal sperm pHᵢ or delta pHᵢ for each group of non-normozoospermic samples (AT, HT, and T) that underwent IVF, we did not find any correlation or significant differences, either for basal pHᵢ (Fig. 4A) or delta pHᵢ (Fig. 4B). The sperm samples had the following statistical values: AT (basal pHᵢ, p = 0.98; delta pHᵢ, p = 0.95), HT (basal pHᵢ, p = 0.28; delta pHᵢ, p = 0.29), and T (basal pHᵢ, p = 0.219; delta pHᵢ, p = 0.13).Fig. 4. Sperm pHi and semen parameters do not correlate with fertilization rate success in IVF. The percentage of fertilization rate was plotted against basal pH_i_ (A), Delta pH_i_ (B), semen volume (C), sperm concentration (D), percentage of normal morphology (E), and percentage of motility (F). The Pearson correlation r and p values are shown for each diagnostic group: teratozoospermic (T, red), hypoteratozoospermic (HT, blue), and asthenoteratozoospermic (AT, green). The shaded area represents the 95% confidence interval. There is no significant correlation between fertilization rate and the parameters studied
For the macroscopic semen parameters, we detected a significant correlation between the fertilization rate and semen concentration for AT patients (marked in green), with a negative r = −1.00 value and a statistical significance of p = 0.025; however, this group is very small (n = 3), and further research is necessary to draw a conclusion (Fig. 4C). We did not find any significant correlation for the other semen parameters: sperm concentration (Fig. 4D), morphology (Fig. 4E), and motility (Fig. 4F) with fertilization rate.
Finally, Table 2 shows a summary of the data obtained from the correlations between fertilization rates and different variables evaluated in both ART procedures. Table 2. Pearson correlation coefficients (r) and corresponding p-values for variables. This table presents the r and p values for the relationship between the fertilization rate and different variables studied in patients undergoing in vitro fertilization (IVF) or intracytoplasmic sperm injection (ICSI) treatmentsART procedureX variableY variableDiagnosticnPearson r**p-valueICSIBasal pHi (F/Fmax)Fertilization rate (%)AT12–0.230.478HT9–0.230.549T460.380.009Delta pHiAT120.140.667HT90.270.477T46–0.290.047Semen volume (mL)AT120.010.964HT90.620.073T46–0.140.346Concentration (cells × 10^6)AT12–0.330.295HT9–0.170.67T46–0.070.656Morphology (%)AT120.240.45HT9–0.590.095T460.110.476Motility (%)AT110.140.691HT90.100.799T44–0.070.658IVFBasal pHi (F/Fmax)Fertilization rate (%)AT3–0.980.115HT10–0.370.288T830.130.237Delta pHiAT30.950.209HT100.330.35T83–0.070.508Semen volume (mL)AT30.350.775HT100.170.633T82–0.030.778Concentration (cells × 10^6)AT3–1.000.025HT100.140.69T83–0.110.319Morphology (%)AT30.970.149HT100.090.809T830.080.46Motility (%)AT3–0.330.783HT10–0.500.142T810.090.425The values in bold indicate statistical significance
Discussion
Despite some advances, the field of male infertility remains limited by an incomplete understanding of many causal factors and the underlying mechanisms of its etiology. To enhance our knowledge and improve treatment options, it is crucial to identify factors influencing male fertility, explore regulatory pathways, and discover diagnostic biomarkers. This will, in turn, enable the development of therapeutic tools to assist patients in their fertility treatments [22]. As part of addressing this challenge, certain research efforts have focused on physiological parameters, such as measuring the resting membrane potential of the sperm (Em) [23–25], analyzing progesterone-induced increases in Ca^2^⁺ [25, 26], and the alkalinization of sperm pHᵢ [11, 25], as indicators of human sperm fertilizing capacity.
From spermatogenesis in the testes to fertilization in the female reproductive tract, a carefully controlled pH environment is essential for optimal sperm performance. Various regions, such as the testes, epididymis, and seminal fluid, maintain distinct pH levels that are precisely regulated to support specific sperm functions [4]. During capacitation, sperm pHᵢ increases as they transit through the female reproductive tract [9]. This alkalinization is essential for activating sperm motility and promoting the acrosome reaction [9, 27–30]. The pH in the female reproductive tract forms a gradient, starting with an acidic environment in the vagina (pH≈4.3) and gradually increasing through the cervix (pH≈6.5–7.5) to the fallopian tubes (pH≈8) [31]. This unique pH landscape may play a role in sperm selection and fertilization [4, 31]. Human spermatozoa possess intricate mechanisms to regulate pHᵢ. Key players include transporters, ion channels, and enzymes, such as Na⁺/H⁺ exchangers (NHEs), Cl⁻/HCO₃⁻ exchangers, and carbonic anhydrases (CAs), which mediate the exchange of H⁺ ions with other ions. Additionally, voltage-gated proton channels (Hv1) and K⁺ channels (SLO3/SLO1) contribute to pHᵢ regulation [6, 10, 32, 33]. The intracellular signaling pathways involving cAMP, cGMP, and Ca^2^⁺ also influence pHᵢ homeostasis [34–36]. Cytoplasmic alkalinization of sperm during capacitation also regulates the opening of the flagellar-specific Ca^2^⁺ channel CatSper, the main channel that regulates Ca^2^⁺ entry into sperm. The opening of CatSper induces the elevation of intracellular Ca^2^⁺ levels that are essential to facilitate various sperm processes, including hyperactivation, capacitation, and the acrosome reaction [10, 37]. All these signaling mechanisms are essential for sperm to acquire the ability to fertilize the oocyte.
Dysregulation of pHᵢ can trigger a cascade of adverse effects on sperm function. The inability to properly regulate pHᵢ can impair sperm motility, capacitation, and the acrosome reaction [10]. The acrosome and its remodeling following the AR play a fundamental role in successful fertilization [38, 39], as low fertilization rates have been observed when intracytoplasmic sperm injection (ICSI) is performed using sperm with intact acrosomes [40] or round sperm that lack this structure [41]. These findings suggest that alkalization of human sperm is important to help enhance fertilization rates during IVF and ICSI, by regulating the RA process and potentially improving pronuclear fusion. In patients with teratozoospermia, various abnormalities in the plasma membrane and acrosome (difficult to diagnose) can impair fertilization, even when sperm are directly injected into the oocyte cytoplasm. This can explain at least in part the correlation observed in this work between the increase in sperm pHᵢ with the increase in fertilization rates by ICSI.
Moreover, changes in the surrounding pH can increase the susceptibility of spermatozoa to oxidative stress and DNA damage [42]. These impairments can ultimately result in infertility or reduced fertility in affected individuals, as well as suboptimal outcomes in ART [11]. In our results, the basal sperm pHᵢ from non-normozoospermic patients undergoing ART treatments exhibited more alkaline basal pHᵢ levels compared to normozoospermic men; however, their values were not statistically significant. These differences are attributed to the small number of normozoospermic men who participated in this study and the fact that they did not undergo fertility treatment. This likely contributed to the high heterogeneity in data, which is a limitation of this study.
In this work, we evaluated the relevance of sperm pHᵢ in fertilization success in patients undergoing ART treatments, including both conventional IVF and ICSI cycles. We found a significant positive correlation between basal sperm pHᵢ and fertilization rates for only teratozoospermic (isolates) samples undergoing ICSI treatment, indicating that the more alkaline the basal pHᵢ of the sperm, the higher the likelihood of fertilization success. This correlation was not observed when conventional IVF was used. In contrast, Gunderson et al. (2021) reported a positive correlation between sperm pHᵢ and increased fertilization rates in normozoospermic patients undergoing conventional IVF. They suggested that sperm with higher pHᵢ values tend to have higher fertilization potential, likely due to enhanced motility and acrosome reaction capabilities [11]. The differences in our findings may be attributed to the fact that our study population consisted of non-normozoospermic patients diagnosed with teratozoospermia (characterized by abnormal sperm morphology), whereas Gunderson’s study focused on normozoospermic patients. Other important differences include the time and culture media used. In this research, we performed the qualitative measurement of pHᵢ around 2 to 3 h after sperm recovery in HTF medium supplemented with 10% HSA. In contrast, Gunderson et al. incubated sperm in Quinn’s Advantage capacitating media for around 18 h. They stained the cells with the pHᵢ-sensitive dye, centrifuged the sperm, and resuspended them in non-capacitating human tubal fluid (HTF) medium with 25 mM NaHCO₃^−^. The incubation conditions can influence the oocytes and embryonic development; therefore, it is important to consider that the studies differ in terms of the methodology used to evaluate pHᵢ. The differences in methodology and media used must be considered, as they can influence the physiological responses of the gametes. This highlights the need to develop more standardized protocols to evaluate sperm pH_i_.
In that sense, maintaining an optimal pH in the culture medium is essential for the survival and function of both sperm and oocytes. After cumulus cell removal during ICSI, oocytes are more vulnerable to pH fluctuations and rely heavily on the surrounding buffer [43]. In a recent article, Mendola and colleagues (2024) showed that the influx of zwitterionic buffers such as HEPES, bicarbonate, and MOPS employed after ICSI can inhibit various cellular processes, including the activity of protein transporters, ion channels, and mitochondrial functions. This was tested in human oocytes (MII stage) to evaluate the influence of buffer entry on the oocyte transcriptome after membrane perforation. These buffers can also interact with DNA, lipids, and metal ions, potentially altering oocyte development. As a result, the authors recommend using a bicarbonate buffer for oocyte retention during ICSI [44]. This finding is significant as it highlights that those ions and the pH of the surrounding environment, and possibly the sperm pH_i_, could affect oocyte activation and embryonic development. More studies are needed to explore the relationship between sperm, oocyte activation, and embryonic development. On the other hand, it is necessary to continue studying and thoroughly evaluate the relevance of culture media on the physiology and function of gametes and embryos during ART application.
Additionally, the regulation of pH is essential during zygote formation, as it also impacts critical processes such as oocyte activation, pronucleus formation, and early embryonic development. Proper pH levels support mitochondrial function, enzyme activation, and energy production, all of which are required for the successful transition from fertilization to the first stages of embryogenesis. In ART procedures, maintaining an optimal pH environment is equally vital to ensure fertilization success and zygote viability. Although the exact role of sperm pH_i_ in fertilization remains unclear, these results suggest that sperm pH_i_ may play a crucial role in regulating not only the fusion process between sperm and egg but also the subsequent steps to obtain a healthy embryo.
While semen analysis provides valuable information about sperm quality, it does not directly evaluate a sperm’s ability to fertilize an egg as shown in this study where no correlation was found between semen macroscopic parameters and fertilization rate. Therefore, it is necessary to search for diagnostic tools with greater precision that improve the probability of success during IVF procedures. Alternatives, such as measuring pH_i_ in capacitated sperm, could be a promising tool to help clinicians choose the best ART for each patient. The protocol presented here is quick and easy to perform in a laboratory that has a flow cytometer. One of the advantages of this qualitative method is that it does not require carrying out pH_i_ calibration curves, which can be considerably more complex and may require media with different pHs. Furthermore, this indirect method of assessing basal pH_i_ (basal and delta pH_i_), a fundamental parameter in the molecular processes involved in sperm function, offers the potential to provide valuable, more specific information on disturbances in male fertility.
The reference list from the paper itself. Each links out to its DOI / PubMed record.
- 1Ren D, Navarro B, Perez G, Jackson AC, Hsu S, Shi Q, et al. A sperm ion channel required for sperm motility and male fertility. Nature. 2001;413:603–9. 10.1038/35098027.10.1038/35098027 PMC 846299811595941 · doi ↗ · pubmed ↗
- 2Chávez JC, De La Vega-Beltrán JL, Escoffier J, Visconti PE, Treviño CL, Darszon A, et al. Ion permeabilities in mouse sperm reveal an external trigger for SLO 3-dependent hyperpolarization. Travis AJ, editor. P Lo S ONE. 2013;8:e 60578. 10.1371/journal.pone.0060578.10.1371/journal.pone.0060578 PMC 361842423577126 · doi ↗ · pubmed ↗
- 3Gunderson SJ, Puga Molina LC, Spies N, Balestrini PA, Buffone MG, Jungheim ES, et al. Machine-learning algorithm incorporating capacitated sperm intracellular p H predicts conventional in vitro fertilization success in normospermic patients. Fertil Steril. 2021;115:930–9. 10.1016/j.fertnstert.2020.10.038.10.1016/j.fertnstert.2020.10.038PMC 911026933461755 · doi ↗ · pubmed ↗
- 4El Khattabi L, Dupont C, Sermondade N, Hugues J-N, Poncelet C, Porcher R, et al. Is intracytoplasmic morphologically selected sperm injection effective in patients with infertility related to teratozoospermia or repeated implantation failure? Fertil Steril. 2013;100:62–8. 10.1016/j.fertnstert.2013.02.048.10.1016/j.fertnstert.2013.02.04823548938 · doi ↗ · pubmed ↗
- 5Candela L, Boeri L, Capogrosso P, Cazzaniga W, Pozzi E, Belladelli F, et al. Correlation among isolated teratozoospermia, sperm DNA fragmentation and markers of systemic inflammation in primary infertile men. Schlatt S, editor. PLOS ONE. Publ Libr Sci (P Lo S); 2021;16:e 0251608. 10.1371/journal.pone.0251608.10.1371/journal.pone.0251608 PMC 818401234097690 · doi ↗ · pubmed ↗
- 6Zheng D, Zeng L, Yang R, Lian Y, Zhu Y-M, Liang X, et al. Intracytoplasmic sperm injection (ICSI) versus conventional in vitro fertilisation (IVF) in couples with non-severe male infertility (NSMI-ICSI): protocol for a multicentre randomised controlled trial. BMJ Open. 2019;9:e 030366. 10.1136/bmjopen-2019-030366.10.1136/bmjopen-2019-030366 PMC 677341731575574 · doi ↗ · pubmed ↗
- 7Alpha Scientists in Reproductive Medicine and ESHRE Special Interest Group of Embryology, Balaban B, Brison D, Calderon G, Catt J, Conaghan J, et al. The Istanbul consensus workshop on embryo assessment: proceedings of an expert meeting. Hum Reprod. 2011;26:1270–83. 10.1093/humrep/der 037.10.1093/humrep/der 03721502182 · doi ↗ · pubmed ↗
- 8R Core Team. R: A Language and Environment for Statistical Computing. Vienna, Austria; 2017. https://www.R-project.org/