Physician Network Breadth in Medicare Advantage Plans Offering Part B Premium Givebacks
Matthew Lavallee, Andrew Anderson, Laura J. Samuel, Kali S. Thomas, Mark K. Meiselbach

TL;DR
This study compares the range of physicians available in Medicare Advantage plans that offer premium givebacks versus those that do not.
Contribution
The study provides new insights into physician network breadth differences in Medicare Advantage plans with premium givebacks.
Findings
Physician network breadth was found to differ between giveback and nongiveback plans.
The study highlights variations in plan design and access to care in Medicare Advantage.
Abstract
This cross-sectional study examines whether physician network breadth differs between Medicare Advantage giveback plans and nongiveback plans.
Genes, proteins, chemicals, diseases, species, mutations and cell lines named across the full text — each resolved to its canonical identifier and authoritative record.
Click any figure to enlarge with its caption.
 Figure
| Physician type | Network breadth, mean (SE) | Difference (95% CI) | Adjusted difference (95% CI) | |
|---|---|---|---|---|
| Part B giveback benefit (n = 191 361) | No Part B giveback benefit (n = 562 035) | |||
| All physicians | 52.82 (0.59) | 55.99 (0.43) | −3.17 (−3.64 to −2.71) | −3.94 (−4.59 to −3.30) |
| Primary care | 50.64 (0.61) | 54.81 (0.43) | −4.17 (−4.64 to −3.69) | −4.43 (−5.10 to −3.77) |
| All specialists | 58.42 (0.68) | 59.62 (0.50) | −1.20 (−1.77 to −0.63) | −3.04 (−3.74 to −2.34) |
| CMS-regulated specialty | ||||
| Allergy and Immunology | 59.20 (1.58) | 60.51 (1.00) | −1.32 (−2.75 to 0.11) | −2.98 (−5.21 to −0.74) |
| Cardiology | 69.28 (0.93) | 68.58 (0.69) | 0.71 (−0.16 to 1.57) | −2.66 (−3.64 to −1.68) |
| Cardiothoracic surgery | 58.94 (1.28) | 58.63 (0.92) | 0.32 (−0.97 to 1.60) | −2.39 (−4.01 to −0.76) |
| Dermatology | 61.59 (1.23) | 65.38 (0.79) | −3.79 (−4.86 to −2.72) | −5.10 (−6.57 to −3.62) |
| Endocrinology | 60.87 (1.27) | 62.67 (0.87) | −1.80 (−3.01 to −0.59) | −4.69 (−5.94 to −3.44) |
| ENT or otolaryngology | 61.01 (1.16) | 62.30 (0.77) | −1.29 (−2.29 to −0.28) | −4.02 (−5.30 to −2.74) |
| Gastroenterology | 67.80 (1.04) | 67.94 (0.75) | −0.14 (−1.12 to 0.84) | −3.51 (−4.47 to −2.55) |
| General surgery | 59.06 (0.77) | 60.16 (0.56) | −1.10 (−1.76 to −0.44) | −3.13 (−3.88 to −2.38) |
| Gynecology or OB-GYN | 56.50 (0.89) | 60.38 (0.59) | −3.87 (−4.59 to −3.15) | −5.21 (−6.15 to −4.28) |
| Infectious diseases | 55.34 (1.34) | 57.82 (0.89) | −2.49 (−3.72 to −1.26) | −3.74 (−5.24 to −2.23) |
| Nephrology | 68.94 (1.07) | 68.07 (0.76) | 0.86 (−0.12 to 1.85) | −1.27 (−2.64 to 0.10) |
| Neurology | 51.28 (1.09) | 54.59 (0.73) | −3.31 (−4.27 to −2.35) | −3.44 (−4.49 to −2.40) |
| Neurosurgery | 58.08 (1.37) | 58.54 (0.97) | −0.46 (−1.85 to 0.93) | −1.99 (−3.90 to −0.08) |
| Oncology (medical) | 65.91 (1.08) | 65.16 (0.76) | 0.76 (−0.23 to 1.74) | −2.42 (−3.41 to −1.43) |
| Oncology (radiation) | 61.69 (1.30) | 61.77 (0.92) | −0.08 (−1.31 to 1.15) | −3.31 (−4.71 to −1.91) |
| Ophthalmology | 63.64 (1.11) | 67.28 (0.70) | −3.65 (−4.56 to −2.73) | −5.07 (−6.97 to −3.17) |
| Orthopedic surgery | 62.85 (0.93) | 63.95 (0.65) | −1.11 (−1.91 to −0.31) | −3.60 (−4.71 to −2.49) |
| Physiatry | 50.40 (1.20) | 54.80 (0.79) | −4.40 (−5.46 to −3.33) | −5.03 (−6.05 to −4.02) |
| Plastic surgery | 44.34 (1.53) | 47.01 (1.01) | −2.67 (−4.11 to −1.22) | −4.36 (−5.98 to −2.74) |
| Psychiatry | 34.96 (1.01) | 31.31 (0.72) | 3.65 (2.76 to 4.54) | 2.24 (0.88 to 3.59) |
| Pulmonology | 59.08 (1.08) | 60.53 (0.75) | −1.44 (−2.42 to −0.46) | −2.91 (−4.09 to −1.74) |
| Rheumatology | 61.21 (1.37) | 62.98 (0.91) | −1.77 (−3.03 to −0.50) | −4.96 (−6.57 to −3.36) |
| Urology | 64.67 (1.12) | 65.20 (0.75) | −0.53 (−1.50 to 0.45) | −3.39 (−4.37 to −2.42) |
| Vascular surgery | 64.87 (1.27) | 64.13 (0.89) | 0.74 (−0.50 to 1.98) | −1.75 (−3.15 to −0.35) |
Peer Reviews
No public reviews on file for this paper yet. If you reviewed it on a platform where reviews are public (OpenReview, ICLR, NeurIPS, ICML), you can paste yours below so the community can read it here.
Videos
No videos yet. Explain this paper in a talk, walkthrough, or lecture? Add one.
Taxonomy
TopicsHealthcare Policy and Management · Primary Care and Health Outcomes · Patient Satisfaction in Healthcare
Introduction
In 2023, more than one-third of Medicare enrollees reported forgoing care due to cost concerns,^1^ and for approximately 20% of enrollees, Part B premiums consumed more than 8% of their annual income.^2^ Unlike copayments or deductibles, the Part B premium is withdrawn from Social Security payments regardless of service use.
Medicare Advantage (MA), which now enrolls most Medicare beneficiaries, has increasingly used rebate dollars from the Centers for Medicare & Medicaid Services (CMS) to offer Part B premium givebacks that lower the Part B premiums for enrollees.^3^ Prior research suggests that these giveback plans enroll healthier beneficiaries and impose higher cost-sharing.^3^ However, less is known about how these plans differ in other dimensions of benefit design. In this study, we examined whether physician network breadth differs between giveback plans and nongiveback plans.
Methods
The Johns Hopkins University Institutional Review Board exempted this cross-sectional study from review and informed consent owing to the use of publicly available data. We followed the STROBE reporting guideline. Data were collected from April 1, 2025, to Novembe 30, 2025.
We constructed county-level physician networks by specialty and plan. We first identified practicing physicians likely to participate in MA using the 2021 OneKey reference file (IQVIA).^4^ We then used a 2024 provider-network file (Ideon)^5^ to connect physicians with the plans with which they contract. We included networks with quality data only (eMethods in Supplement 1). The resulting plan county-level data captures 78% of health maintenance organization and preferred provider organization enrollment (eTable in Supplement 1).
Our outcome measure was network breadth, defined as the proportion of physicians in a county contracted by a particular plan and calculated among all physicians, primary care physicians, all specialists, and each individual CMS-regulated specialty. First, we examined the association between county-level plan network breadth and the presence of a Part B premium giveback. Second, we assessed the dose-response association between the giveback amount (above or below the median) with network breadth relative to nongiveback plans. All analyses were weighted by county-level plan enrollment, and regression analyses controlled for county and plan type fixed effects. Statistical analyses were performed in R, version 4.4.1 (R Project for Statistical Computing). Two-sided P < .05 indicated statistical significance.
Results
The Table presents enrollment-weighted means of network breadth for giveback and nongiveback plans. Giveback plans included a share of total physicians of −3.94 (95% CI, −4.59 to −3.30) percentage points (pp) compared with nongiveback plans (an approximately 7% lower share), adjusting for plan type and county. In 23 of 25 individual specialties, giveback plans had significantly narrower networks (range, 1.75-5.21 pp; P < .05 across all comparisons); psychiatry was the only specialty where networks were significantly broader (2.24 pp [95% CI, 0.88-3.59]; P = .001) in giveback plans.
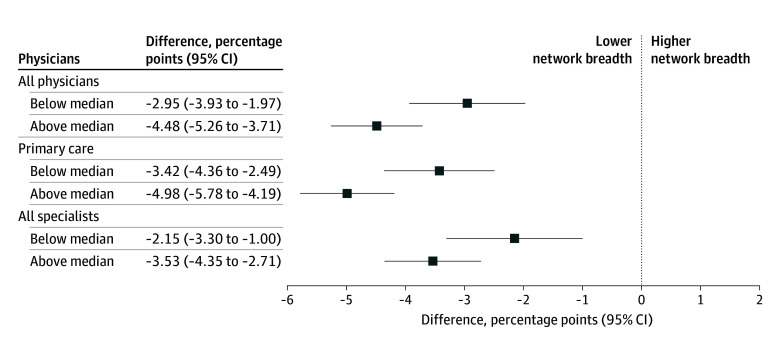
The Figure shows the association between the giveback amount and network breadth for all physicians, primary care physicians, and specialists. Both below- and above-median giveback plans were associated with lower network breadth compared with plans without givebacks. These differences were greater among plans with above-median giveback amounts than in plans with below-median giveback amounts.
Association Between Medicare Advantage Part B Giveback Amount and Specialist Network Breadth by Giveback AmountNetwork breadth is the proportion of physicians in a county contracted by a given plan. Estimated differences in network breadth were adjusted for county-level fixed effects and plan type (health maintenance organization vs preferred provider network) and weighed by county-level enrollment. SEs are clustered at the county level. Below median giveback amount = 74; above median giveback amount = 165. Data are from the 2021 OneKey reference file (IQVIA)4 and the 2024 provider-network file (Ideon).5
Discussion
MA plans offering Part B premium givebacks had narrower physician networks than those without this benefit, consistent across most individual specialties. Among giveback plans, those with more generous giveback amounts had narrower networks than those offering smaller amounts. These findings suggest that patients choosing plans may face trade-offs between receiving Part B premium rebates and having access to broader physician networks, an aspect of plan design that can be difficult for beneficiaries to evaluate. Prior studies have also found that Part B premium giveback plans have higher cost-sharing than nongiveback plans.^3^
Our study is limited in that it only examines 1 dimension of clinician access, omitting access to nonphysician clinicians and health care facilities. As policymakers consider how to regulate MA, they will need to ensure consumers are well-informed of trade-offs faced between supplemental cash benefits and plan features that may limit access to care.
The reference list from the paper itself. Each links out to its DOI / PubMed record.
- 1Pollitz K, Pestaina K, Montero A, . KFF survey of consumer experiences with health insurance. KFF. June 15, 2023. Accessed July 23, 2025. https://www.kff.org/affordable-care-act/kff-survey-of-consumer-experiences-with-health-insurance/
- 2Cottrill A, Cubanski J, Neuman T, Smith K. Seven million people with Medicare spend more than 10% of income on Part B premiums—the Reconciliation Bill could drive the number higher. KFF. June 23, 2025. Accessed July 23, 2025. https://www.kff.org/medicare/seven-million-people-with-medicare-spend-more-than-10-of-income-on-part-b-premiums-the-reconciliation-bill-could-drive-the-number-higher/
- 3Meiselbach MK, Anderson A, Samuel LJ, Thomas KS. Medicare Advantage Part B premium givebacks and enrollment. JAMA Health Forum. 2025;6(6):e 251215. doi:10.1001/jamahealthforum.2025.1215 40478555 PMC 12144618 · doi ↗ · pubmed ↗
- 4One Key reference data. IQVIA. Accessed December 23, 2025. https://www.onekeydata.com/onekey/overview
- 5Research: how will you use data to improve healthcare and coverage? Ideon. 2025. Accessed December 23, 2025. https://ideonapi.com/researchers/