Genome Sequence Data and Integrative RNA-Seq Data of Black Soldier Fly (Hermetia illucens) (A Japanese Strain)
Koji Takeda, Takuya Uehara, Akiya Jouraku, Chia-Ming Liu, Tetsuya Kobayashi, Masami Shimoda, Kakeru Yokoi

TL;DR
This paper presents genome and RNA-Seq data for a Japanese strain of black soldier fly, supporting research on its industrial use for recycling organic waste.
Contribution
Provides a high-quality genome and transcriptome dataset for a field-collected strain of Hermetia illucens.
Findings
The genome size is approximately 1.05 Gbp with an N50 value of 191 Mbp.
Validation analyses confirmed the reliability of genome and transcriptome data.
Time-course and tissue-specific transcriptome data were generated for larvae and adults.
Abstract
The black soldier fly, Hermetia illucens, is a dipteran insect with a distinctive black body in the adult stage. The larvae of this species possess biological features which can be used for industrial applications. We established an H. illucens field-collected strain to develop an industrial system for recycling organic waste. We constructed whole-genome sequences of the strain of H. illucens and prepared a gene set and its functional annotation data to promote research on the social implementation of H. illucens and genetically characterise this strain. In addition, time-course transcriptome data of the larvae and transcriptome expression data of multiple tissues from 6th instar larvae and male and female adults were prepared. The genome size and its N50 value were approximately 1.05 Gbp and 191 Mbp, respectively. The results of the validation analyses of the genome and transcriptome…
Genes, proteins, chemicals, diseases, species, mutations and cell lines named across the full text — each resolved to its canonical identifier and authoritative record.
Click any figure to enlarge with its caption.
 Figure 1
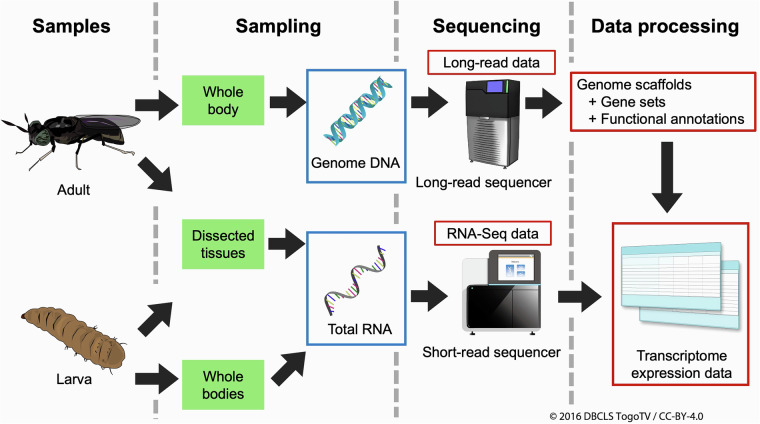 Figure 2
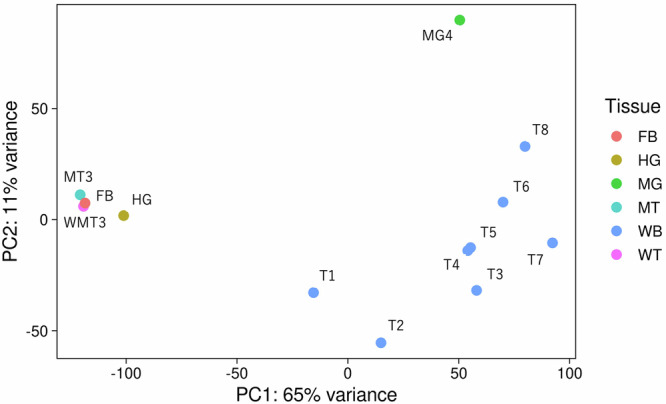 Figure 3
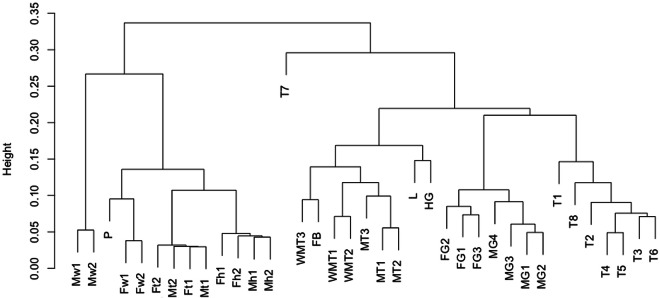 Figure 4
- —the Cabinet Office, Government of Japan, Cross-ministerial Moonshot Agriculture, Forestry and Fisheries Research and Development Program, and “Technologies for Smart Bio-industry and Agriculture” (fun
Peer Reviews
No public reviews on file for this paper yet. If you reviewed it on a platform where reviews are public (OpenReview, ICLR, NeurIPS, ICML), you can paste yours below so the community can read it here.
Videos
No videos yet. Explain this paper in a talk, walkthrough, or lecture? Add one.
Taxonomy
TopicsInsect Utilization and Effects · Beetle Biology and Toxicology Studies · Forensic Entomology and Diptera Studies
Background & Summary
The black soldier fly (BSF) (Hermetia illucens) is a dipteran insect with a distinctive black body colour in its adult stage, measuring 15–20 mm in length, with partly hyaline areas on the first and second abdominal segments. Black soldier fly larvae (BSFL) are 10–20 mm long, cylindrical, pale yellowish to brown in colour, and have a robust body structure^1^. In contrast to adults, who consume only minimal amounts of water and sugar dew^2^, BSFL efficiently decompose decaying organic matter and exhibit rapid growth and high feeding efficiency.
Their saprophagous nature enables them to feed and grow on various organic materials, such as food residues, animal manure, and even low-nutrient substrates such as coffee husks. This remarkable adaptability is one of the most distinct features of this species. Photographs of typical BSF at all developmental stages are shown in Fig. 1.Fig. 1. Photographs of the black soldier fly. Photographs of black soldier flies at each developmental stage: egg, 1st to 6th instar larvae, prepupa, pupa, and adult.
The biological features of BSFL have been exploited industrially for the efficient bioconversion of organic waste. For example, they can accumulate more than 40% of their body weight as lipids during the 14–18 day larval period^2,3^. These lipids are particularly rich in lauric acid (C12:0), which makes BSFL a promising resource for animal feed and biofuel production^4^. Additionally, BSFL are regarded as a high-quality source of protein. Defatted and dried BSFL meal can contain up to 42% crude protein^5^, drawing growing attention for its potential use in aquaculture and livestock feed^6^. Given the environmental challenges posed by conventional protein sources, such as fishmeal and soybeans, BSFL represents a sustainable and scalable alternative that can help address the global protein shortage. Therefore, BSFL is a valuable resource that contributes to the development of a recycling-oriented society.
BSF is believed to have originated in the Neotropical region, where its ancestral genetic diversity is concentrated^7^. Based on these genetic hotspots, this species has expanded its range over ancient times, eventually establishing populations on other continents. This global spread was driven primarily by human-mediated introductions, and BSF established its present-day distribution by the 1960s^8^. Despite the recent establishment of their current distribution, BSF harbours considerable hidden genetic diversity. Genomic studies have revealed the existence of at least two major genetic lineages that diverged more than three million years ago^9^. Substantial intraspecific variation has been observed in mitochondrial sequences^10,11^. Nonetheless, most of the commercial and laboratory populations currently used are thought to have originated from a single North American strain. This genetic uniformity poses a significant challenge for the stable industrial utilisation of BSF. A narrow genetic base may increase vulnerability to disease outbreaks and reduce adaptability to environmental stresses. Genetically diverse populations are crucial for selective breeding programs aimed at improving productivity, enhancing specific nutritional profiles, and conferring disease resistance. A comprehensive understanding of BSF’s genetic diversity and the development of breeding strategies that leverage this diversity are essential for sustainable and efficient industrial applications.
We established a laboratory strain from field-collected individuals in Japan and have since been developing applications for organic waste recycling and the industrial use of BSF, including improving rearing conditions^12^ and enhancing feed quality^13^. Although genomic resources have been developed in other countries^14–16^, no independent genetic studies on the evolutionary history of BSF have been conducted in Japan, and no distinct evolutionary lineages have been identified within the country. In this study, we genetically characterised the Japanese population, assembled a high-quality reference genome, and generated tissue- and age-specific gene expression profiles to support future breeding efforts using genomic and genome-editing technologies.
The BSF whole-genome sequence data of the Japanese strain were constructed using published genome data and long-read genome sequence read data (Fig. 2). The size and N50 value of the constructed genome were approximately 1.05 Gbp and 191 Mbp, respectively. The genome data consisted of 66 contigs, of which the average length and largest contig size were approximately 15 and 234 Mbp, respectively (Table 1). Compared to the previously published genome data, our data have not very different genome size and possess several improved N50 values, and consist of relatively lower numbers of contigs, suggesting that our genome data are reliable for a reference genome (Table 2). The proportion of CG sequences was 42.36%. The repetitive regions and transposable elements (consisting of multiple types of the elements) comprised 68% of the genome sequence regions (Table 3). Using the genome sequence data, 17,892 genes and 18,830 transcripts were predicted (gene set data) (Table 1), and these genes were functionally annotated (functional annotation data) (Fig. 2). RNA-Seq data were prepared for the time-course BSF larval stages (T1–T8 and P); the full gut (FG), midgut (MG), hindgut (HG), Malpighian tubules (MT), white Malpighian tubules (WMT), and fatbodies (FB) of last-day 6th instar larvae; and the whole body (Mw and Fw), head (Mh and Fh), and tarsus (Mt and Ft) of both male and female adults (Table 4). Transcriptome expression value matrix data were prepared using RNA-Seq and gene set data (Fig. 2). As described in the “Technical Validation” section, the constructed genome data and RNA-Seq data were reliable as reference genome and transcriptome data. These data contribute to evolutionary and comparative biology. Furthermore, using these data, genome editing target genes can be determined, which will lead to the breeding of strains possessing beneficial phenotypes for the commercial usage of BSF as food or feed.Fig. 2. Workflow of this study. Schematic workflow of this study blue boxes indicate genomic DNA or total RNA. Red boxes indicate sequence or related data.Table 1. Basic statistics of the constructed H. illucens genome.Total length1,046,446,650 bpN50190,590,078 bpGC content42.36%Number of contigs66Number of predicted genes17,892Number of predicted transcripts18,830Average length15,855,252.27 bpLongest contig234,026,304 bpTable 2Comparison between H. illucens genome data from this study and previously published versions.This studyZhan et al.^14^Costagil et al.^15^Generalovic et al.^16^Total length1,046,446,650 bp1,101,327,485 bp888,595,941 bp1,004,948,288 bpN50190,590,078 bp1,695,701 bp162,194,137 bp180,357,958 bpNumber of contigs66280616921Table 3Repetitive regions and transposable elements in the assembled BSF genome.Number of elementsLength oppcupiedPercentageSINEs23,2944,700,919 bp0.45%LINEs1,034,728459,705,977 bp43.93%LINE230,08312,883,029 bp1.23%L3/CR124,32914,248,601 bp1.36%LTR elements83,21943,817,987 bp4.19%DNA elements124,78942,311,076 bp4.04%Unclassified564,027142,093,847 bp13.58%**Total interspersed repeats692,629,806 bp**66.19%**Small RNA24,4724,809,580 bp0.46%Simple repeats:53,1934,150,315 bp0.40%Low complexity7713370,992 bp0.04%**Total TE and repetetive region67%most repeats fragmented by insertions or deletions have been counted as one element.Table 4RNA-Seq and DNA sample and data list RNA-Seq samples.Sample nameSample name in SRA or GEATissueDevelopmental stageDays after hatchingSexSRA run IDT1A-01Whole body1st-2nd instar larvae1—DRR667142T2A-02Whole body3rd-4th instar larvae3—DRR667143T3A-03Whole body5th instar larvae5—DRR667144T4A-04Whole body5th instar larvae7—DRR667145T5A-05Whole body5th instar larvae9—DRR667146T6A-06Whole body6th instar larvae11—DRR667147T7A-07Whole body6th instar larvae12—DRR667148T8A-08Whole body6th instar larvae16—DRR667149LL-1Whole body6th instar larvae——DRR667134FG1FG1Full Gut6th instar larvae——DRR502194FG2FG2Full Gut6th instar larvae——DRR502195FG3FG3Full Gut6th instar larvae——DRR502196HGB-11Hindgut6th instar larvae20—DRR667150MG1MG1Midgut6th instar larvae——DRR502197MG2MG2Midgut6th instar larvae——DRR502198MG3MG3Midgut6th instar larvae——DRR502199MG4B-12Midgut6th instar larvae20—DRR667151MT1MT1Malpighian tubules6th instar larvae——DRR502200MT2MT2Malpighian tubules6th instar larvae——DRR502201MT3B-13Malpighian tubules6th instar larvae20—DRR667152WMT1WT1White Malpighian tubules6th instar larvae——DRR502202WMT2WT2White Malpighian tubules6th instar larvae——DRR502203WMT3B-14White Malpighian tubules6th instar larvae20—DRR667153FBB-15Fatbody6th instar larvae20—DRR667154PP-1PupaPupa——DRR667141Fh1fh-1HeadAdult—FemaleDRR667128Fh2fh-2HeadAdult—FemaleDRR667129Ft1ft-1TarsusAdult—FemaleDRR667130Ft2ft-2TarsusAdult—FemaleDRR667131Fw1fw-1Whole bodyAdult—FemaleDRR667132Fw2fw-2Whole bodyAdult—FemaleDRR667133Mh1mh-1HeadAdult—MaleDRR667135Mh2mh-2HeadAdult—MaleDRR667136Mt1mt-1TarsusAdult—MaleDRR667137Mt2mt-2TarsusAdult—MaleDRR667138Mw1mw-1Whole bodyAdult—MaleDRR667139Mw2mw-2Whole bodyAdult—MaleDRR667140Long-read DNA sequenceDevelopmental stage**SexSRA run IDAdultMaleDRR680776Numbers added after sample name indicate biological replicate
Methods
Sample preparation
Insect rearing
Black soldier flies were originally collected from Tsukuba, Japan, in 2013. The rearing method was modified from Nakamura et al.^17^. Briefly, adult flies were housed in mesh cages (W 115 × D 85 × H 85 cm) and allowed to mate and oviposit. Eggs were collected using an oviposition device, and the oviposition date was recorded. The collected eggs were transferred to plastic cups and incubated at 28 °C until hatching. The day of hatching was designated day 1 and served as the starting point for all subsequent experiments. Newly hatched larvae were fed an artificial diet^13^ and reared in an incubator maintained at 28 °C.
DNA extraction and sequencing
DNA was extracted from a newly eclosed adult male fly. High-molecular-weight DNA was obtained using a gravity flow extraction kit (Genomic-tip 100/G, Cat. no. 10243; QIAGEN, Hilden, Germany). The extracted DNA was used for long-read sequencing. Samples were prepared following the SMRTbell preparation guide for the PacBio Sequel II System. Sequencing was performed by Macrogen Japan Corp (Tokyo, Japan) using SMRT technology.
RNA Extraction and sequencing
Whole-body samples (6th instar larvae, pupae, and adults; Table 4) were collected from single individuals, whereas specific tissues (head and tarsus) were dissected from three individuals and pooled. All samples were homogenised on ice using a plastic pestle, and RNA was extracted using TRIzol reagent according to the manufacturer’s protocol. Larval samples were collected at distinct developmental stages, with each sample comprising ten individuals. Larvae with recorded hatching dates were reared on an artificial diet and collected at two-day intervals. The body weights of the harvested larvae were measured, and ten individuals with comparable weights were selected for RNA extraction. The larvae were rinsed with tap water followed by ultrapure water, pooled into a single tube, and homogenised using a disposable plastic homogeniser (Nippi, Tokyo, Japan). Total RNA was extracted using an RNeasy Kit (QIAGEN) following the manufacturer’s instructions. Extracted RNA samples were stored at −80 °C until further processing. The sequencing library was prepared using random fragmentation of the DNA or cDNA sample, followed by 5ʹ and 3ʹ adapter ligation. Alternatively, “tagmentation” combines the fragmentation and ligation reactions into a single step, greatly increasing the efficiency of the library preparation process. The adapter-ligated fragments were then PCR-amplified and gel-purified. For cluster generation, the library was loaded into a flow cell, where fragments were captured on a lawn of surface-bound oligos complementary to the library adapters. Each fragment was amplified into distinct clonal clusters using bridge amplification. The templates were ready for sequencing using an Illumina NovaSeq 6000 after cluster generation was complete. Sequencing library construction and sequencing were performed by Macrogen Japan Corp.
Sequence data analysis
All scripts and commands (settings and options) of the data analysis in this study are available via the “Code Availability” section.
Genome sequence construction and gene prediction
De novo assembly was initially performed using CANU version 2.1.1^18^ using long-read sequencing data. The corrected reads generated by CANU were subsequently used as inputs for another de novo genome assembler using Hifiasm version 0.14-r312^19–21^ to improve genome continuity. The resulting contigs were polished with NextPolish version 1.3.1, scaffolded using ragtag version 2.1.0^22^, with reference to the published BSF genome^23^, resulting in the final genome assembly. The repeat regions in the genome were masked for gene model prediction using RepeatModeler version 2.0.2a and RepeatMasker version 4.1.2. pl^24,25^. RNA-Seq reads (L, P, Fh, Ft, Fw, Mh, Mt, and Mw; Table 4) were aligned to the repeat-masked genome using STAR version 2.7.6a to generate hints for gene prediction. Gene prediction was performed using BRAKER version 2.1.6 based on both the mapped RNA-seq hints and Drosophila melanogaster protein data^26^. The two resulting gene predictions were merged into a unified gene prediction using TSEBRA version 1.0.3. Functional annotation of predicted gene sets was performed using various tools. Homologous protein searches by BLASTP version 2.12.0 + with option “-evalue 1e-3”^27^ were conducted for protein sequences of NCBI nr database (retrieved on 2023-10-23) and D. melanogaster^26^. Homologous domain searches were conducted by HMMER version 3.1b2^28^ using Pfam version 35.0^29^. Classification of proteins (identifying related InterPro entries and Gene Ontology (GO) terms) was conducted using InterProScan version 5.55–88.0^30^ with the options “-dp -iprlookup -goterms”.
RNA-seq data analysis
RNA-seq raw reads of each sample were cleaned using BBTools ver 39.06 (https://sourceforge.net/projects/bbmap/) with the bbduk.sh command^31^. Clean reads were mapped to the reference genome constructed in this study using STAR version 2.7.10b^32^. The genome indices of STAR were constructed using the “STAR” command. Mapping clean reads using the STAR genome indices was conducted using the “STAR” command. The expression values (expected count and TPM) of genes and transcripts in each sample were calculated using RSEM version 1.3.3^33^ using the mapping data. The transcriptome indices of RSEM were constructed using the “rsem-prepare-reference” command. Then, the expression values were calculated using the “rsem-calculate-expression” command. A summary of the functional annotations is presented in Table 5.Table 5. Summary of the functional annotation for the predicted gene set (17,892 genes).Analysis ToolDatabaseNo. of annotated genesAnnotation rate (%)BLASTPNCBI nr (2023-10-23)17,34296.92BLASTPDrosophila melanogaster (GCF_000001215.4)13,42875.05HMMERPfam 35.014,00678.28InterProScanInterPro entries in InterProScan 5.55–88.013,60076.01InterProScanGO terms in InterProScan 5.55–88.09,76354.57Total17,40397.27
Unmapped RNA-seq read pairs of the “T1” sample were extracted to narrow down the cause of the low mapping rate (58.61%) observed in “T1” sample by rerunning STAR with an additional option “–outReadsUnmapped Fastx”. Several unmapped read pairs were compared to the NCBI nt database using BLASTN version 2.12.0+. All top-hit sequences in the nt database were derived from mRNA of Saccharomyces cerevisiae. Therefore, the low mapping rate was attributed to the contamination of S. cerevisiae. All unmapped reads were mapped to the reference genome of Saccharomyces cerevisiae strain S288C^34^ using STAR in the same manner as described above to confirm the estimation.
Busco analysis and hierarchical clustering analysis
Busco analysis was performed using BUSCO version 5.2.2, with the insecta_odb10 database and the assembled genome sequence data as input, utilising the default settings^35^. Hierarchical clustering analysis was performed using R (version 4.2.3) in RStudio (version 2023.03.0 + 386), using transcriptome expression matrix data as input. The principal component analysis (PCA) was performed using R.
Data Records
All sequencing data were deposited in the DNA Data Bank of Japan (DDBJ) Sequence Read Archive (SRA). The accession ID of the long-read DNA sequence, and the RNA-Seq IDs are listed in Table 4^36,37^. The constructed genome sequence is available in Genbank (Accession ID: AP041145-AP041210)^38^. The following are available in Figshare: a list of sequence contig names and accession IDs^39^, detailed output data related to RepeatModeler and RepeatMasker^40^, and the predicted gene set data and functional annotation result files (gtf, fasta, and xlsx)^41^. The calculated transcriptome expression value matrix files were deposited into the DDBJ Genomic Expression Archive (GEA) (Accession ID: E-GEAD-1083 and E-GEAD-1084)^42^, and merged files from the two expression matrix files used for hierarchical clustering analysis are available in Figshare^43^.
Technical Validation
Genome sequence data validation
As shown in Table 1, the constructed genome size was approximately 1.05 Gbp, which is comparable to those of the two published BSF genomes (approximately 1.1 Gbp and 1.01 Gbp)(Table 2)^14,16^ while the N50 value was higher than those of the two genome datasets (Table 2). The number of predicted genes (17,892) did not differ significantly from that of a published gene set (16,770 genes)^14^. In addition, BUSCO analysis was performed to assess the quality of the constructed BSF genome data (Table 6). The results showed that ratio of Complete BUSCO was 98.7%, comparable to the BUSCO results of the published other BSF genome data^14,16^. This indicated that the constructed genome data possessed sufficient quality to serve as reference genome data.Table 6. Busco result (Using insecta_odb10, total number of BUSCOs: 1367).BUSCO groupNumber of found BUSCOs (percent of all BUSCOs)Complete BUSCOs (C)1349 (98.7%)Complete and single-copy BUSCOs (S)1290 (98.7%)Complete and duplicated BUSCOs (D)59 (4.3%)Missing BUSCOs (M)13 (0.9%)Fragmented BUSCOs (F)5 (0.4%)Total BUSCOs1367
RNA-seq data validation
The mapping rates of RNA-seq samples ranged from 93 to 98% (Table 7), indicating high mapping rates for the genome assembly. However, exceptionally, the mapping rate of the “T1” sample was 58.61%. Since 88.33% of the unmapped reads in the “T1” sample were mapped to the S. cerevisiae genome assembly, the cause of the low mapping rate was confirmed due to the contamination of S. cerevisiae. Although the mapping rate of the “T1” sample was lower than that of other samples, the expression values of the “T1” sample calculated using their mapped reads can still be useful for comparison with other samples. A PCA analysis of the dataset (RNA samples of T1−T8, HG, MT3, MG4, WMT3 and FB sequenced at the same time) was conducted using the plotPCA function in DESeq2 ver 1.44.0 (Love et al. 2014) to evaluate the validity of the “T1” sample. The expression values (expected counts of all genes) were normalized among the samples using the vst function in DESeq2 ver 1.44.0 (genes with low total expected counts (<10) in all the samples were discarded for the analysis). The results of PCA analysis showed that PC1 and PC2 explained 65% and 11% of the variance, respectively (Fig. 3). The normalized expression values of the “T1” sample were considered suitable for comparison with other samples because the whole-body samples from different larval stages (“T1”–“T8”) formed a distinct cluster. Additionally, the “T1” sample (0 days) was positioned relatively close to the “T2” sample (2 days), compared to the later-stage samples (4–16 days).Table 7RNA-seq sample statistics.Sample IDNo. of raw readsNo. of clean readsMapping rate (%)T163,729,99460,755,90858.61T241,156,59039,466,78497.8T360,949,93458,230,65497.73T455,665,68053,044,80497.63T541,442,09239,324,58697.7T659,675,14456,289,34697.72T718,572,11817,478,75098.49T848,708,95045,743,07297.49L53,824,58050,401,02896.45FG125,932,08424,749,21296.32FG222,308,95221,227,34895.02FG326,192,04424,970,35895.38HG42,655,35440,808,39497.48MG120,066,51219,128,06497.36MG227,409,84026,022,44696.71MG323,538,96222,440,92296.78MG458,465,36655,957,93897.72MT126,502,61225,191,51095.37MT226,218,22424,830,46095.11MT341,279,57239,211,11495.59WMT127,443,39225,924,33896.14WMT225,353,95624,067,09696.65WMT364,523,38861,480,36495.76FB55,842,14453,355,72298P42,762,17639,658,02295.57Fh144,531,78441,177,26293.42Fh240,303,40437,369,62293.48Ft148,375,60845,437,06495.95Ft243,845,06240,884,32295.76Fw152,686,73649,243,66495.84Fw254,095,32850,568,39295.59Mh152,304,92648,500,90293.97Mh244,191,10841,142,49693.69Mt150,471,15247,072,34495.58Mt244,464,02041,218,66495.52Mw140,675,70037,682,22295.38Mw252,490,95049,152,94695.65Fig. 3Principal component analysis (PCA) results of expression data of certain samples. The horizontal and vertical axes are the first and second principal components, respectively. Blue dots indicate time-course larvae samples (WB). Dots representing other tissue samples are shown in various colours, as indicated in the legend on the right side of the PCA plot.
Hierarchical clustering analysis using all transcriptome expression data was performed (Fig. 4) to assess the reliability of transcriptome expression data. Adult, pupal, and larval samples were separated into large left and right clusters, respectively. Time-course larval samples (T1–T8), except T7, formed one cluster, whereas L and T7 samples were placed at different locations from the clusters. This may be because samples L and T7 were in the pupation preparation phase. The MG and FG samples formed independent clusters. WMT, MT, and FB samples formed one cluster, which may be because WMT, MT, and FB are spatially close to each other in the larval body. The Fh and Mh samples formed one cluster, whereas the Ft and Mt samples formed one cluster. In addition, Fw and P formed a single cluster. The Mw samples were separated from those of the other adults. This may be because the Mw samples contained testes, in which expression data are different from those of other tissues in the silkworm^44^. These results indicated that the clustering results were mostly reasonable, suggesting that the RNA-Seq and expression data are reliable as reference expression data.Fig. 4. Dendrogram of hierarchical clustering analysis using transcriptome expression data. The sample names in the dendrogram and metadata are shown in Table 4.
The reference list from the paper itself. Each links out to its DOI / PubMed record.
- 1Diener, E. et al. New Measures of Well-Being. in Assessing Well-Being: The Collected Works of Ed Diener (ed. Diener, E.) 247–266, 10.1007/978-90-481-2354-4_12 (Springer Netherlands, Dordrecht, 2009).
- 2Marshall, S. A., Woodley, N. E. & Hauser, M. The historical spread of the black soldier fly, Hermetia illucens (L.)(Diptera, Stratiomyidae, Hermetiinae), and its establishment in Canada. J. the Entomol. Soc. Ontario 146 (2015).
- 3Generalovic, T. N. et al. Cryptic diversity and signatures of domestication in the Black Soldier Fly (Hermetia illucens). 2023.10.21.563413 Preprint at 10.1101/2023.10.21.563413 (2023).
- 4NCBI genomehttps://www.ncbi.nlm.nih.gov/datasets/genome/GCF_905115235.1/ (2020).
- 5Repeat Modeler 2 for automated genomic discovery of transposable element families | PNAS. https://www.pnas.org/doi/10.1073/pnas.1921046117.10.1073/pnas.1921046117 PMC 719682032300014 · doi ↗ · pubmed ↗
- 6NCBI genomehttps://www.ncbi.nlm.nih.gov/datasets/genome/GCF_000001215.4/ (2014).
- 7BB Map download | Source Forge.net. https://sourceforge.net/projects/bbmap/.
- 8NCBI genbankhttps://www.ncbi.nlm.nih.gov/datasets/genome/GCF_000146045.2/.