Young People’s Subjective Wellbeing in the Wake of the COVID-19 Pandemic: Evidence from a Representative Cohort Study in England
Jake Anders, Erica Holt-White

TL;DR
This study examines how the pandemic affected the wellbeing of young people in England, showing lasting negative impacts and highlighting gender and social inequalities.
Contribution
The paper provides new evidence on the long-term subjective wellbeing of young people, particularly the role of perceived pandemic impact and gender differences.
Findings
Young people who perceived ongoing negative pandemic effects had significantly lower wellbeing scores.
Gender differences in wellbeing persisted even after adjusting for social support and life events.
Adverse pandemic experiences were linked to lower post-pandemic wellbeing, but not mediated by demographics or social support.
Abstract
The COVID-19 pandemic and the disruption it has caused had substantial short-term effects on young people. These effects have been found to be highly unequal, exacerbating existing inequalities in society, including those associated with socio-economic status, gender and ethnicity. But, just as importantly, it is believed that they continue to cast a long shadow over some young people’s lives. In this paper we use data from the COVID Social Mobility & Opportunities study (COSMO) — a representative cohort study of over 13,000 young people in England aged 14–15 at pandemic onset whose education and post-16 transitions were acutely affected by the pandemic’s disruption through their remaining education and subsequent transitions — to highlight inequalities in young people’s subjective wellbeing and mental health in the wake of the pandemic. We document the substantial differences in…
Genes, proteins, chemicals, diseases, species, mutations and cell lines named across the full text — each resolved to its canonical identifier and authoritative record.
Click any figure to enlarge with its caption.
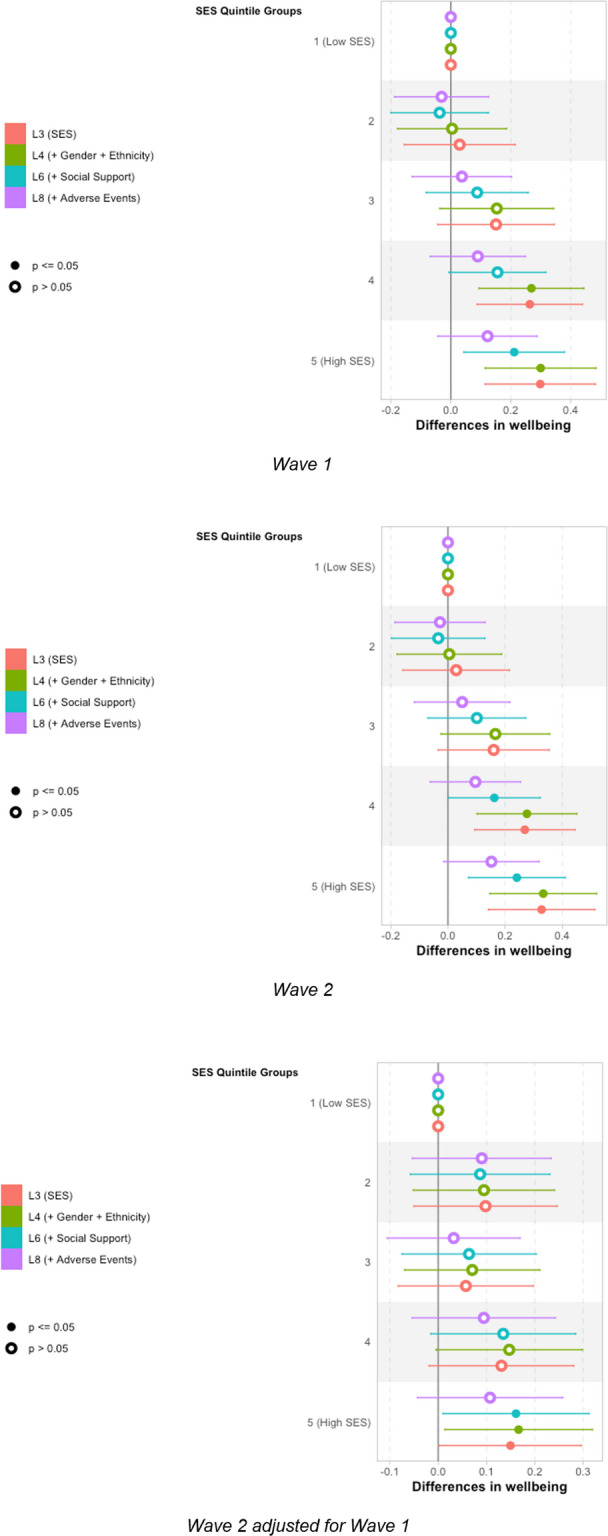 Figure 10
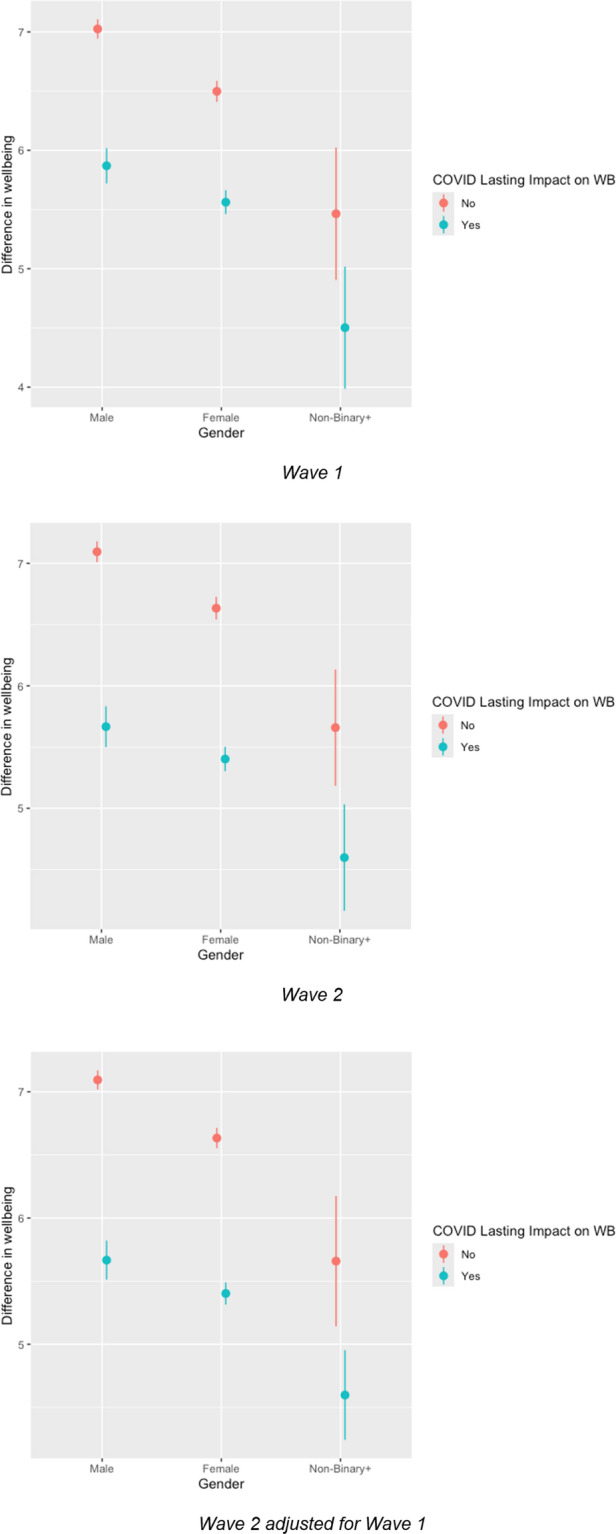 Figure 11
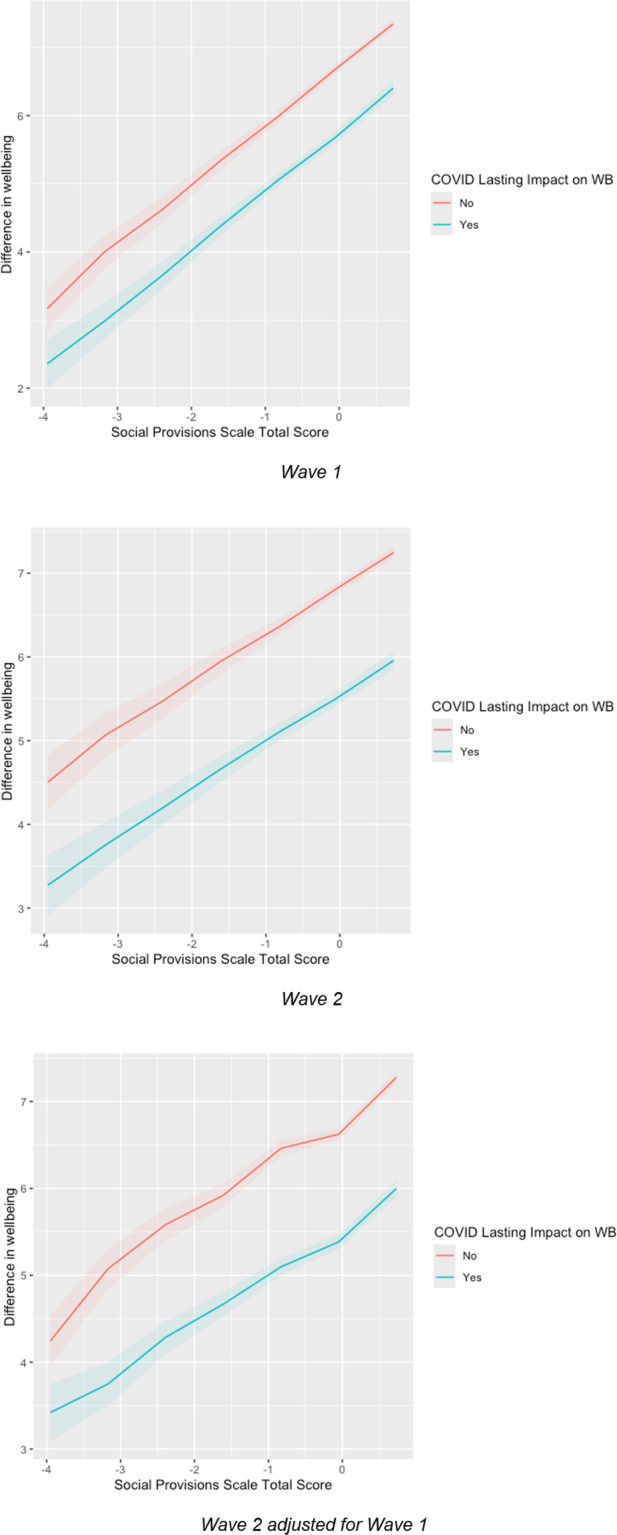 Figure 12
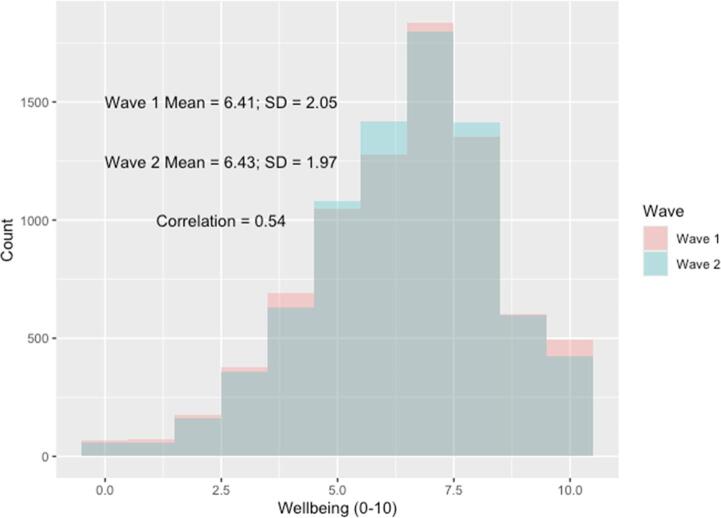 Figure 1
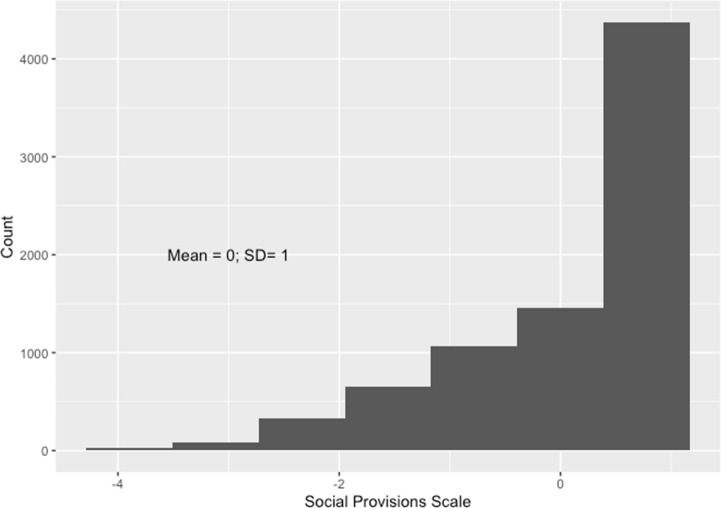 Figure 2
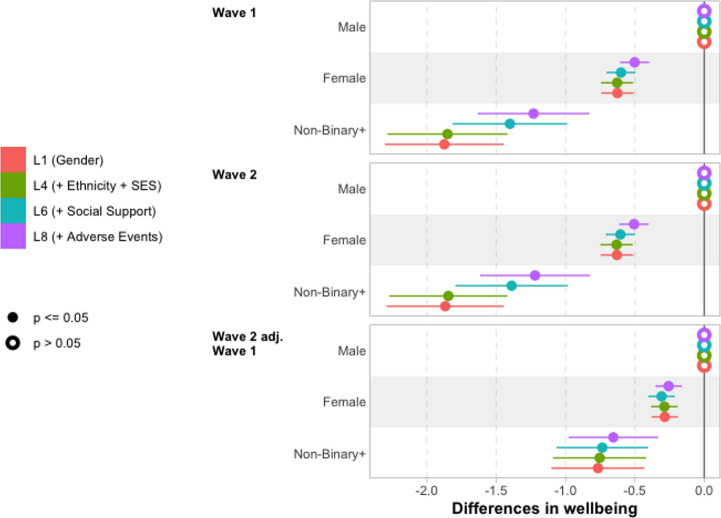 Figure 3
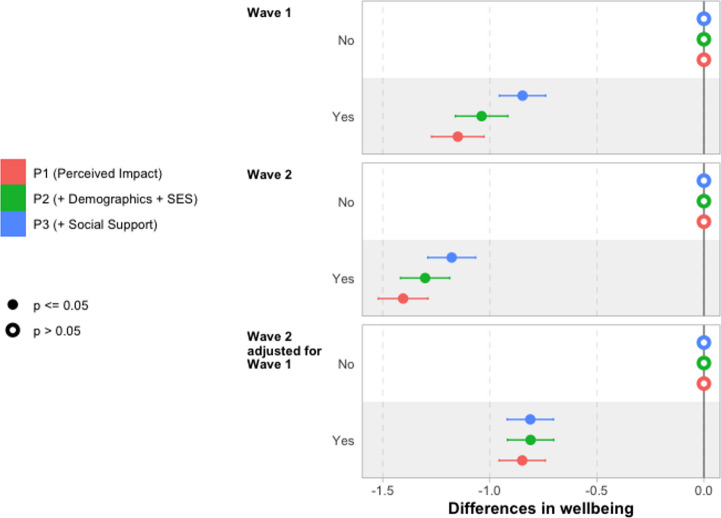 Figure 4
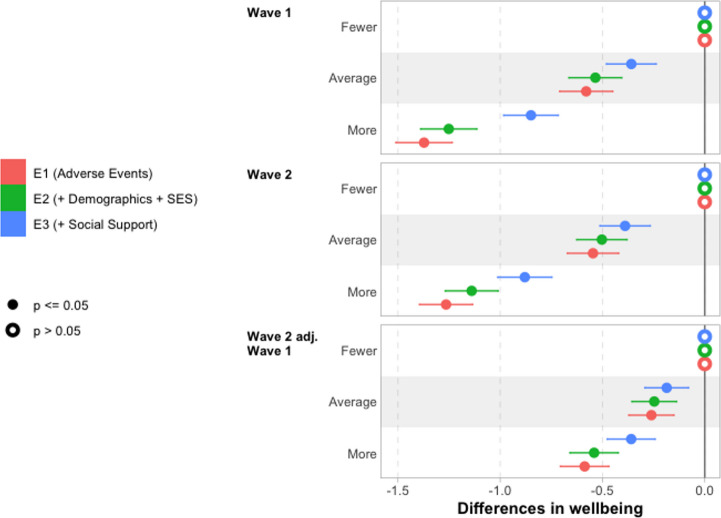 Figure 5
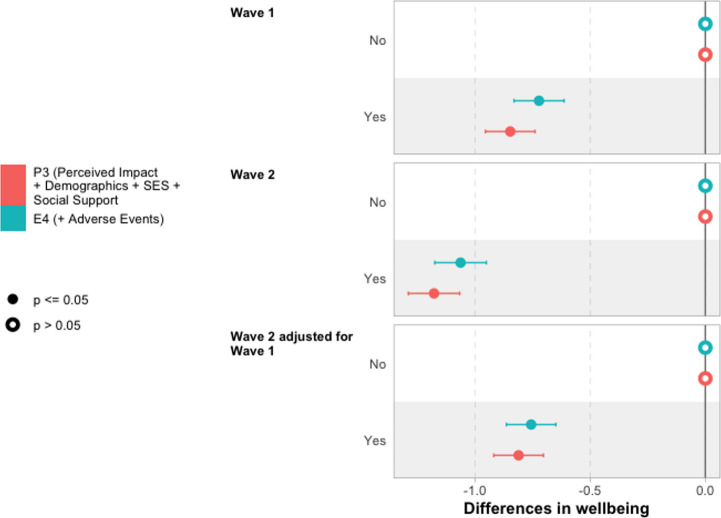 Figure 6
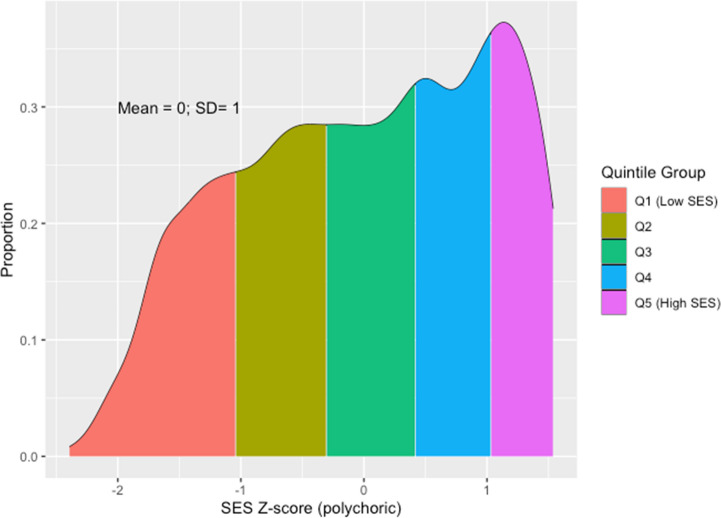 Figure 7
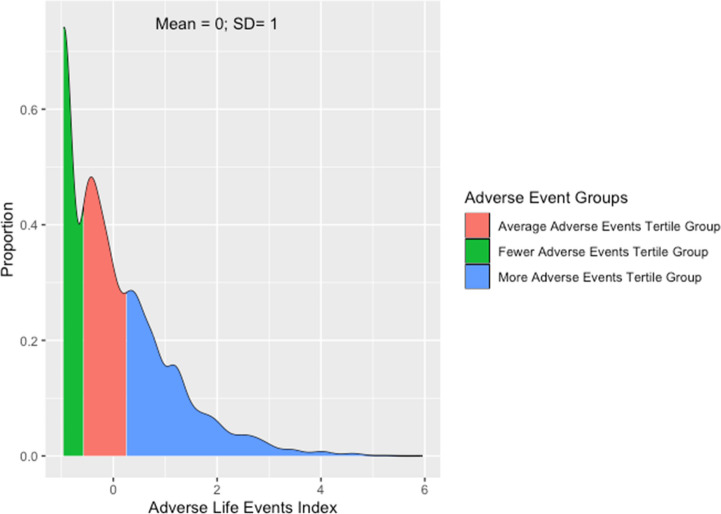 Figure 8
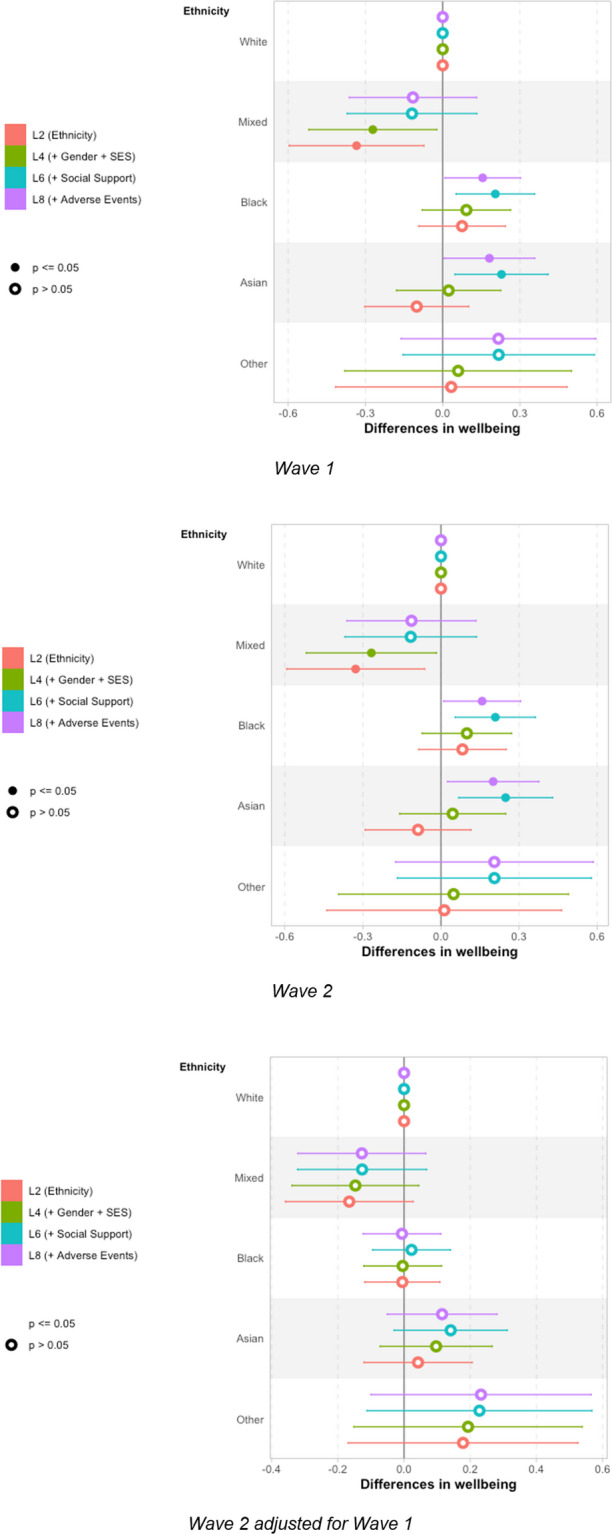 Figure 9
- —http://dx.doi.org/10.13039/501100000269Economic and Social Research Council
- —http://dx.doi.org/10.13039/100014013UK Research and Innovation
Peer Reviews
No public reviews on file for this paper yet. If you reviewed it on a platform where reviews are public (OpenReview, ICLR, NeurIPS, ICML), you can paste yours below so the community can read it here.
Videos
No videos yet. Explain this paper in a talk, walkthrough, or lecture? Add one.
Taxonomy
TopicsCOVID-19 and Mental Health · Youth Education and Societal Dynamics · Psychological Well-being and Life Satisfaction
Introduction
The COVID-19 pandemic and the disruption it caused had substantial short-term effects on young people’s lives around the world, with evidence of significant impacts on young people’s wellbeing and mental health (De France et al., 2022; Wolf & Schmitz, 2024). Young people in England, the focus of this paper, were no exception: extended periods in which in-person schooling was suspended (Anders, 2024) interrupted pupils’ learning (Jakubowski et al., 2025) and social lives (Kalenkoski & Pabilonia, 2024), with consequent rises in loneliness a clear symptom of this (Kung et al., 2023). This widespread disruption had widely documented short-term effects on young people’s wellbeing (e.g. Attwood & Jarrold, 2023; Banks & Xu, 2020; Neugebauer et al., 2024; Newlove-Delgado et al., 2021; Quintana-Domeque & Zeng, 2023), the magnitude of which was found to be linked with the intensity of lockdown restrictions (Owens et al., 2022), and the immediacy of which is reflected in wellbeing increasing and decreasing as restrictions tightened and eased (Creswell et al., 2021). A review by Kauhanen et al. (2023) summarised the international picture as “a longitudinal deterioration in symptoms for different mental health outcomes especially for adolescents and young people”.1
Existing analyses suggest that effects of the disruption were unequal, often exacerbating existing demographic inequalities in society, including those associated with socioeconomic status (e.g., Ravens-Sieberer et al., 2022), gender (e.g., Anders et al., 2023; Davillas & Jones, 2021), and ethnicity (e.g., Proto & Quintana-Domeque, 2021). Wolf and Schmitz (2024) finds that older adolescents were particularly affected, perhaps as these are such formative years for social relationships and critical years for education and subsequent transitions.
Variation in experiences and support during the pandemic has also been found to be important for young people’s wellbeing. Restrictions on social activities and the closure of schools reduced physical activity for some, which has been linked to worse mental health outcomes (Samji et al., 2022); other aspects of the pandemic are likely to have exacerbated the prevalence of adverse life events that previous studies have shown affect wellbeing (Cleland et al., 2016). Conversely, social support has been identified as a potential buffer to negative impacts (Demaray et al., 2005; Racine et al., 2021; Siedlecki et al., 2014) of such negative stressors. These highlight the potential importance of experiences and social support during the pandemic for young people’s wellbeing and, hence, the need to consider these in understanding differences in wellbeing.
While short-term impacts are important, we should be especially concerned if the impacts of the pandemic have continued to affect young people’s lives, including their subjective wellbeing, once restrictions ended. Concern was expressed from early in the pandemic that its negative effects on wellbeing would persist (Sonuga-Barke & Fearon, 2021), something that has been identified in some (Quintana-Domeque & Proto, 2022) but not all (Henseke & Schoon, 2025) studies of the general population. We explore the extent to which young people’s own perceptions of the ongoing impact of the pandemic on their wellbeing are associated with their post-pandemic subjective wellbeing, following in the spirit of research that seeks to understand the informational value of individuals’ own assessments of their situation (e.g. Fernandez-Urbano & Samuel, 2024 on perceived coping with the context of the pandemic).
Moreover, we should care about inequalities in young people’s wellbeing whether or not these are (entirely) due to the pandemic. Indeed, we may be more concerned about the persistence of inequalities that pre-date the pandemic — including in gender (Yoon et al., 2023) and socioeconomic status (Verhulst & Tiemeier, 2020) — for which there is no particular reason to expect them to subside. As such, taking stock of the current situation is important in its own right given correlation between subjective wellbeing and later economic and wider outcomes (Deaton, 2008; Lyubomirsky et al., 2005).
In our analyses of these issues, we are guided by Social Production Function (SPF) theory (Ormel et al., 1999), which enumerates five components contributing to subjective well-being: stimulation, comfort, status, behavioural confirmation, and affection. While this study does not engage individually with all five factors, SPF nevertheless provides a helpful framework, including in distinguishing between long-term factors such as status, linked with socioeconomic and demographic characteristics, and more acute potential impacts of changes to stimulation, comfort and affection presented by the disruption of the pandemic and specific events during its course. Furthermore, the potential buffering role of social support can be seen as integral to the SPF components of status and affection. Focussing particularly on the context of the COVID-19 pandemic, Chesters (2025) posit that its restrictions may have negatively affected young people’s access to affection, when not able to spend time with friends and extended family; stimulation, due to restrictions on activities; comfort, both material through potential financial distress, and emotional through adverse life events; and behavioural confirmation, through the disruption to routines and societal expectations.
Using data from the COVID Social Mobility & Opportunities study (COSMO) — a representative cohort study of over 13,000 young people in England aged 14–15 at pandemic onset whose education and post-16 transitions were acutely affected by the pandemic’s disruption through their remaining education and subsequent transitions — we provide new evidence regarding these issues, specifically through the following research aims:
- to estimate differences in post-pandemic wellbeing among this cohort by demographic characteristics;
- to validate and quantify the informational value of young people’s own perceptions of the impact of the pandemic on their wellbeing, along with the extent to which this may be explained by differences in social support and;
- to explore the role of adverse experiences during the pandemic in explaining differences in post-pandemic wellbeing, again accounting for the potential importance of differences in social support.
The paper proceeds as follows. In Sect. 2, we describe the data that we use, the steps taken to prepare it for analysis, and conduct descriptive analyses to provide initial evidence on our research aims. In Sect. 3, we describe our use of regression modelling, presenting results in Sect. 4. Finally, we discuss our findings and conclude in Sect. 5, noting implications for policy and practice.
Data and Descriptive Analyses
We use data from the COVID Social Mobility & Opportunities study (COSMO), a longitudinal cohort study following a representative sample of young people (and their parents) who were in Year 10 (i.e., aged 14–15) at pandemic onset (March 2020), who participated at both waves 1 (Anders et al., 2024a), carried out October 2021–March 2022 (ages 16–17), and 2 (Anders et al., 2024b), carried out October 2022–March 2023 (ages 17–18). In both cases the majority of interviews were carried out within the first two months of fieldwork; we also control for month of interview in our regression models (further details below).
COSMO has a clustered and stratified design with oversampling of those from smaller (e.g., ethnic minorities), more disadvantaged and harder to reach demographic groups to improve statistical power when exploring inequalities between such groups. Furthermore, there was initial non-response and attrition between the first two waves. As such, it is important to account for the deliberate and modelled sample disproportionalities, as well as implications of clustering and stratification for statistical inference. We take these features into account in analyses using study-provided clustering and stratification variables, and design and non-response weights (Adali et al., 2022, 2023).
To ensure consistency across analyses, we restrict our sample to those with valid data on the key variables for our analyses. This includes the primary outcome of self-reported wellbeing score, along with key predictors and demographic variables. However, we are mindful of the potential implications of sample selection caused by complete case analysis. We robustness check our findings in Sect. 9, re-running our core analyses having only restricted the sample based on the primary outcome (wellbeing score) and the main predictors (impact of pandemic on mental health and adverse life events reporting) and multiply imputing across 10 datasets all other predictors using a highly flexible classification and regression tree approach (Lumley, 2019; van Buuren & Groothuis-Oudshoorn, 2025).
Subjective Wellbeing
To measure self-reported wellbeing, we use the UK Office for National Statistics’ official measure of life satisfaction (Office for National Statistics, 2018), which is widely recognised as an important dimension of subjective wellbeing (Petersen et al., 2022). This asks participants to respond to the prompt “Overall, how satisfied are you with your life nowadays?” on a scale ranging from 0 “Not at all satisfied” to 10 “Completely satisfied”. This measure has been used in national UK surveys since 2011 and increasing numbers of academic studies, hence providing a useful benchmark for this concept in UK-based surveys. This measure is found to be a reliable measure of subjective wellbeing in young people (Levin & Currie, 2014), performing as well as the more in-depth Satisfaction with Life Scale (Jovanović, 2016), for example, although we do recognise that it will not capture all dimensions of wellbeing (Ruggeri et al., 2020). It is also worth noting that, while they are distinct constructs, a clear correlation between lower wellbeing and increased risk of poor mental health (Lombardo et al., 2018).
As COSMO was established in response to the pandemic, there are no pre-pandemic baseline measures. As such, we emphasise that our estimates of differences are between individuals all of whom have experienced the pandemic, but experienced it differently, rather than between their current situation and a counterfactual in which the pandemic did not happen. Others have used survey experiment methods to attempt to get closer to such a counterfactual (Andreoli et al., 2024), or pre-existing longitudinal studies to explore change in mental health across the pandemic period (Henseke & Schoon, 2025).
We have measures of wellbeing from two post-pandemic waves and use these to explore evidence of change in wellbeing between the two waves both overall, and between sub-groups of the data where this might be expected. We plot the overall distribution of reported wellbeing in both Waves 1 (age 16/17) and 2 (age 17/18) in Fig. 1.Fig. 1. Histogram of distribution of subjective wellbeing in Wave 1 and 2. Notes: Histogram weighted for survey design and non-response
Young people report a mean wellbeing score of 6.41 in Wave 1 and 6.43 at Wave 2, with the standard deviation declining slightly from 2.05 to 1.97. These are not particularly substantial changes, providing little evidence of change between these two post-pandemic time points. However, in interpreting this (lack of) aggregate change, we must be mindful of this cohort’s wider context.
One interpretation would be that, as we know there was a decline in mental health and wellbeing among young people at the onset of the pandemic and its restrictions (Newlove-Delgado et al., 2021), we would hope to see an upward trajectory in wellbeing in subsequent years to be confident of a ‘bounce back’, with this lack of change suggesting a plateau at a lower level than before the pandemic. That could be the case. A finding of minimal change is consistent with the findings of Henseke et al. (2022) (albeit for a wider age range of young people aged 16–29). Similarly, the UK Office for National Statistics’ annual population survey also suggests that life satisfaction has not returned to pre-pandemic levels in the general population (Office for National Statistics, 2023).
Fundamentally, using these data alone we are unable to adjudicate between multiple potential plausible scenarios. Others, using a wider range of datasets are better placed to do so. For example, Henseke and Schoon (2025) suggest that young people’s wellbeing may have already returned to pre-pandemic levels, thus explaining a lack of trend for this reason. These findings would also be consistent with an upward post-pandemic trend being cancelled out by a countervailing age effect (for example) implied by the wider literature on life course wellbeing (Blanchflower, 2021).
However, this is not our paper’s focus. Aggregate stability does not mean that there are not individual-level differences or differential change in wellbeing. The correlation between the reported measures in Waves 1 and 2 is 0.54. While some of this likely reflects natural fluctuation in young people’s wellbeing due to daily idiosyncratic shocks, it provides a basis to explore evidence of systematic difference in change between the two waves, along with the differences in levels at each wave.
Social Support
Social support is concerned with the extent to which an individual is, or perceives they are, “cared for, esteemed, and valued by people in [their] social network” (p. 691, Demaray et al., 2005). As such, it directly relates to the SPF framework, specifically status and affection. As such, we anticipate that individuals with greater social support will have higher levels of wellbeing (Li et al., 2021; Magson et al., 2021; Siedlecki et al., 2014). Furthermore, because of the potential for substitution between components of the SPF in the production of wellbeing (Ormel et al., 1999), we also anticipate social support buffering shocks to other aspects; this has been observed empirically with social support buffering shocks to wellbeing in the face of adversity (Aksoy et al., 2024; Kearns et al., 2015; McMahon et al., 2023).
To capture this factor, we use the social provisions scale (Cutrona & Russell, 2018), specifically a shortened three-item variant available in COSMO in which young people are asked to respond (using the categories “Not true”, “Partly true” or “Very true”) to the statements:
- I have family and friends who help me feel safe, secure and happy.
- There is someone I trust whom I would turn to for advice if I were having problems.
- There is no one I feel close to [Negatively coded].
Following standard practice, we sum over the values of the three items and standardise the resulting variable (mean zero; standard deviation one) for the purposes of interpretation. We plot the distribution of the social provisions scale in Fig. 2. There is some evidence of a ceiling effect — most respondents score the maximum of 6 — but with a decent spread below this. We use this as a continuous measure in our analyses.Fig. 2. Distribution of social provisions scale. Notes: Distribution of social provisions scale. The scale is standardised to have mean 0 and standard deviation 1 in the analysis sample. Weighted for survey design and non-response
Demographic Characteristics
The impact of the pandemic on young people’s wellbeing differed depending upon their demographic characteristics (e.g., Anders et al., 2023). Both to estimate differences between young people based on these characteristics, and to control for these measures in other analyses, we make use of the rich set of demographic measures collected in COSMO. Specifically, we construct the following measures of demographic characteristics.
- Gender: There are longstanding concerns about differences in wellbeing by gender (Yoon et al., 2023), which have only been exacerbated by the pandemic (Davillas & Jones, 2021). We use young people’s reported gender at either wave (giving precedence to the subsequent reports if they differ) and group cohort members into ‘female’, ‘male’ and ‘non-binary+’, where the final category is a combination of those who explicitly report being non-binary or choose to identify in any other way (since these other groups are too small for analysis).
- Ethnicity: As with gender, our measure is based on self-reports at either wave (where a subsequent report is given precedence if they differ), young people are grouped into ‘White’, ‘Mixed’, ‘Black’, ‘Asian’ and ‘Other’. While these categories are broad, they are chosen for consistency with the UK’s major ethnic group classifications while avoiding groups that are too small for analysis purposes.
- Parental education: Generally viewed as a core component of socioeconomic status, which may affect wellbeing through the status component of the SPF (Ormel et al., 1999), we construct our measure using the highest level of education reported by either parent at either wave, grouping parents into ‘Graduate’, ‘Below Graduate’ and ‘No Quals’.
- Housing tenure: Housing tenure is another component of socioeconomic status, hence with potential implications for young people’s wellbeing. Our measure is based on parental reports at either wave (giving precedence to the subsequent if they differ), grouping families into those who own their home (either with a mortgage or outright; ‘Own House’) and all others (predominantly social and private renting; ‘Other’).
- Area deprivation: We also include an area-based measure of deprivation of participants’ homes, both as a correlate of socioeconomic stats due to residential sorting and given more direct implications this can have for potentially wellbeing-enhancing amenities. COSMO provides decile groups of the UK’s Income Deprivation Affecting Children Index (IDACI), constructed at the ‘lower-layer super-output area’ (the smallest geographical areas in UK statistical geography, containing an average population of 1,500).
To allow exploration of differences in wellbeing by socioeconomic status (SES) in a simple way, we create a combined index of SES (with mean 0 and standard deviation 0 in our analysis sample) across our measures of parental education, housing tenure and home neighbourhood deprivation. We describe how we do this and demonstrate that it captures the underlying SES measures on which it is based in Sect. 6.1.
Having constructed this set of measures, we report the prevalence of demographics in our cohort along with mean levels of self-reported wellbeing by these categories at Wave 1, Wave 2, and mean difference between the two in Table 1.Table 1. Mean subjective wellbeing score by demographic characteristicsCharacteristicNPrevalence (%)Wave 1Wave 2DifferenceOverall7,7236.416.430.017GenderMale3,475506.766.760.007Female4,030486.136.150.021Non-Binary+2182.64.905.040.136EthnicityWhite4,877776.436.440.014Mixed4775.76.096.09−0.008Black1,503106.516.48−0.030Asian6845.06.346.430.094Other1822.26.446.640.201Parental EducationGraduate3,807556.486.45−0.024Below Graduate2,962366.356.370.024No Quals8717.66.256.540.286Unknown830.86.426.37−0.049Housing TenureOwn House4,224656.506.540.037Other3,499356.246.22−0.020Unknown00IDACI Quintile Group1 (High Deprivation)2,306226.246.23−0.00721,678196.396.420.03231,351196.346.460.11841,231206.546.560.0235 (Low Deprivation)1,157206.566.49−0.072SES Quintile Groups1 (Low SES)2,257206.266.260.00521,770206.286.370.08831,405206.426.40−0.01941,266216.536.530.0065 (High SES)1,025196.586.580.002Reporting means except where otherwise specified. All estimates are weighted and account for the complex survey design. The difference is calculated as Wave 2 - Wave 1
50% of the sample are male, 48% are female and 2.6% are non-binary or report in another way. Average reported wellbeing differs substantially between these groups with boys (6.76 in Wave 1) reporting higher levels of wellbeing than girls (6.13). This is consistent with existing work on inequalities in young people’s wellbeing (e.g. Anders et al., 2023, Davillas & Jones, 2021), both before the pandemic and as a result of its impact. Non-binary + young people report lower levels of wellbeing still than girls, although there is evidence of an increase for this group between Waves 1 and 2; we should be mindful, however, of the smaller sample size for this group.
By ethnicity, the highest levels of reported wellbeing are for Black young people (6.51 in Wave 1), followed by White young people (6.43), with the lowest among young people who reported a Mixed ethnicity. These differences are small and, other than the small group of young people placed into the Other category, there is little evidence of change over time.
There is a broadly consistent gradient in wellbeing across our quintile groups of socioeconomic status, from 6.26 to 6.58 (both for Wave 1 but with a similar picture in Wave 2). Again, these appear to be rather small differences and there is no evidence of consistent change between the two waves.
Overall, this initial analysis highlights gender as the most important demographic difference in wellbeing for this sample of young people in England.
Perceived Ongoing Impact
Next, we seek to quantify differences in young people’s wellbeing by their own perceptions of the ongoing impact of the pandemic. This takes seriously young people’s own reports of the ongoing impact of the pandemic on their wellbeing. To capture these perceptions, we use a question asked to young people at the second wave of COSMO, asking “Would you say the pandemic is still having an effect on [your mental wellbeing], whether positive or negative?” If they agree with this question then they are subsequently asked to distinguish whether this impact is positive, negative or they don’t know.
Table 2 shows that 64% of young people report that the pandemic is continuing to have an impact on their mental wellbeing, with 32% of these reporting that this impact is negative. Perhaps unsurprisingly, much smaller proportion of young people report that the ongoing impact is positive (2%) or that they don’t know if the impact is positive or negative (2%).Table 2. Mean subjective wellbeing score by whether and how the pandemic continues to affect mental wellbeingVariable, N = 7723No (64%)^1^Negative (32%)^1^Don’t know (2%)^1^Positive (2%)^1^Overall (100%)^1^p-value^2^Wave 16.815.626.376.406.41< 0.001Wave 26.915.466.296.486.43< 0.001Difference0.11−0.16−0.080.080.02< 0.001^1^Mean^2^Design-based KruskalWallis testAll estimates are weighted and account for the complex survey design. The difference is calculated asWave 2 - Wave 1
Those who report no impact of the pandemic on their mental wellbeing have the highest self-reported wellbeing (6.81 in Wave 1; 6.91 in Wave 2), while those who report that it had a negative impact on their mental wellbeing report the lowest (5.62 in Wave 1; 5.46 in Wave 2). Those who say it is still having an impact but that it is positive, or that they don’t know if it is positive or negative, report somewhere between the other two groups but, as noted, these are a very small proportion of the sample.
These groups are also distinguished by changes in reported wellbeing between Waves 1 and 2. Those who report that the pandemic is continuing to have a negative impact on their mental wellbeing do, indeed, report a decline in wellbeing (−0.16) between the two waves, while those who report that it has had no impact (0.11) or that it is having a positive impact report an increase (0.08). Those who report that it is still having an impact but that they don’t know if it is positive or negative report a slight decline (−0.08). These last two groups are small, so these estimates should be treated with caution. In subsequent analyses we combine these two groups with the group who report no impact, for an overall comparison of those who report an ongoing negative impact with the rest of the sample.
Adverse Life Events
Finally, we explore whether subjective wellbeing is associated with experiencing adverse life events during the COVID-19 pandemic. We report details of the construction of this measure in Sect. 6.2, creating a composite index of adverse life events using polychoric principal component analysis (PCA) of the ten adverse life events available in the data and dividing the sample into tertile groups based on the resulting index.
We find that mean wellbeing score differs by experience of such events (Table 3). Wellbeing is lower for those who experience a higher prevalence of adverse life events, ranging from 7.04 for those in the fewer adverse life events tertile group to 5.67 for those in the more adverse life events tertile group. This pattern is consistent across Waves 1 and 2, but there is no significant evidence of difference in the patterns of change over time.Table 3. Mean subjective wellbeing score by experience of adverse life events reported since onset of pandemicVariable, N = 7723Fewer (36%)^1^Average (30%)^1^More (33%)^1^Overall (100%)^1^p-value^2^Wave 17.046.465.676.41< 0.001Wave 27.026.475.756.43< 0.001Difference−0.030.000.080.020.2^1^Mean^2^Design-based KruskalWallis testAll estimates are weighted and account for the complex survey design
However, as with all our descriptive analyses, we are mindful that there is the potential for differences in socioeconomic and demographic characteristics between by experience of adverse life events. For this reason, as well as for our other analyses, we use regression modelling to unpack these findings further.
Analytical Approach
To extend our descriptive analyses and, hence, provide a more nuanced understanding of the factors associated with young people’s wellbeing since the pandemic, we use regression modelling. All analyses are carried out using R (R Core Team, 2024), with the survey package (Lumley et al., 2024) used to account for the complex survey design of the data, including design and non-response weights, and adjustments to statistical inference due to stratification and clustering of the sample.
We break this section into three sub-sections, aligned with the research aims in this paper: demographic differences in subjective wellbeing; the importance of perceived ongoing impact of the pandemic; and the importance of adverse life events during the pandemic.
Demographic Differences in Subjective Wellbeing
First, we use linear regression models to explore differences in young people’s wellbeing. These models all take the form
\documentclass[12pt]{minimal} \usepackage{amsmath} \usepackage{wasysym} \usepackage{amsfonts} \usepackage{amssymb} \usepackage{amsbsy} \usepackage{mathrsfs} \usepackage{upgreek} \setlength{\oddsidemargin}{-69pt} \begin{document}$$\begin{array}{c}\:LifeSat_{it}={\beta\:}_0+\beta\:{'\:}_1SES_i+\\\beta\:{'\:}_2Gender_i+\beta\:{'\:}_3Ethnicity_i\\+X{'\:}_i+{\epsilon\:}_{it}\:\end{array}$$\end{document}where \documentclass[12pt]{minimal} \usepackage{amsmath} \usepackage{wasysym} \usepackage{amsfonts} \usepackage{amssymb} \usepackage{amsbsy} \usepackage{mathrsfs} \usepackage{upgreek} \setlength{\oddsidemargin}{-69pt} \begin{document}$$\:LifeSat$$\end{document} is wellbeing score for person \documentclass[12pt]{minimal} \usepackage{amsmath} \usepackage{wasysym} \usepackage{amsfonts} \usepackage{amssymb} \usepackage{amsbsy} \usepackage{mathrsfs} \usepackage{upgreek} \setlength{\oddsidemargin}{-69pt} \begin{document}$$\:i$$\end{document} at time \documentclass[12pt]{minimal} \usepackage{amsmath} \usepackage{wasysym} \usepackage{amsfonts} \usepackage{amssymb} \usepackage{amsbsy} \usepackage{mathrsfs} \usepackage{upgreek} \setlength{\oddsidemargin}{-69pt} \begin{document}$$\:t$$\end{document} , \documentclass[12pt]{minimal} \usepackage{amsmath} \usepackage{wasysym} \usepackage{amsfonts} \usepackage{amssymb} \usepackage{amsbsy} \usepackage{mathrsfs} \usepackage{upgreek} \setlength{\oddsidemargin}{-69pt} \begin{document}$$\:SES$$\end{document} is a vector of binary variables for quintile groups of SES (leaving the highest SES quintile group as the omitted category), \documentclass[12pt]{minimal} \usepackage{amsmath} \usepackage{wasysym} \usepackage{amsfonts} \usepackage{amssymb} \usepackage{amsbsy} \usepackage{mathrsfs} \usepackage{upgreek} \setlength{\oddsidemargin}{-69pt} \begin{document}$$\:Gender$$\end{document} is a vector of binary variables for gender (Female and Non-binary+, leaving Male as the omitted category), \documentclass[12pt]{minimal} \usepackage{amsmath} \usepackage{wasysym} \usepackage{amsfonts} \usepackage{amssymb} \usepackage{amsbsy} \usepackage{mathrsfs} \usepackage{upgreek} \setlength{\oddsidemargin}{-69pt} \begin{document}$$\:Ethnicity$$\end{document} is a vector of binary variables for ethnicity (Asian, Black, Mixed, Other, leaving the largest category, White, omitted as the baseline), \documentclass[12pt]{minimal} \usepackage{amsmath} \usepackage{wasysym} \usepackage{amsfonts} \usepackage{amssymb} \usepackage{amsbsy} \usepackage{mathrsfs} \usepackage{upgreek} \setlength{\oddsidemargin}{-69pt} \begin{document}$$\:X$$\end{document} is a vector of covariates varying between model specifications discussed below, and \documentclass[12pt]{minimal} \usepackage{amsmath} \usepackage{wasysym} \usepackage{amsfonts} \usepackage{amssymb} \usepackage{amsbsy} \usepackage{mathrsfs} \usepackage{upgreek} \setlength{\oddsidemargin}{-69pt} \begin{document}$$\:\epsilon\:$$\end{document} is the error term. We estimate these models separately for each time point of the survey, and then again for Wave 2 with an additional covariate of Wave 1 wellbeing score to provide estimates of difference adjusting for Wave 1 wellbeing as a baseline.
We estimate a series of models summarised in Table 4, beginning with simple models including gender (L1), ethnicity (L2), and SES (L3) entered separately, replicating the descriptive analyses and unconditional estimates of differences in wellbeing reported in Table 1. Next, we include all three demographic characteristics at the same time in L4, along with the addition of a month of interview variable to allow for potential confounding due to the timing of the survey. This model, hence, provides estimates of demographic differences in wellbeing, conditional on the other demographic characteristics included. We then explore potential intersectional differences in wellbeing between demographics in L5 (Codiroli Mcmaster & Cook, 2019) by including a full set of interaction terms between our SES, gender and ethnicity variables.Table 4. Model specifications for regression analysis of subjective wellbeingVariableL1L2L3L4L5L6L7L8GenderIncludedIncludedInteracted w/Ethnicity and SESIncludedInteracted w/Social SupportIncludedEthnicityIncludedIncludedInteracted w/Gender and SESIncludedInteracted w/Social SupportIncludedSESIncludedIncludedInteracted w/Gender and EthnicityIncludedInteracted w/Social SupportIncludedSocial SupportIncludedInteracted w/Gender, Ethnicity and SESIncludedAdverse EventsIncludedL1-L7 refer to the model number. SES = Socioeconomic status
Next, motivated by understanding the potential importance of social support in explaining these differences, we add social provisions score in L6. Differences between the coefficients on our demographic characteristics between L4 and L6 will, hence, provide information on the extent to which differences in social support explain the unadjusted differences.
L7 explores whether the importance of social support varies by demographic characteristics. As with L5, we include interaction terms, this time between our demographic characteristics and the two social support measures to allow for the moderation of the relationship between these measures and wellbeing.
Finally, L8 explores the importance of adverse life events in explaining demographic differences in wellbeing. We include the adverse life events index in this model, along with the demographic characteristics and social support measures. Comparing coefficients on the demographic characteristics in L6 and L8 hence provides information on the extent to which differences in adverse life events may explain demographic differences in wellbeing. We do not model the interaction between adverse life events and demographic characteristics at this point as we explore this in a subsequent section.
Importance of Perceived Impact of the Pandemic on Wellbeing
In this section, we again use linear regression models to estimate differences in subjective wellbeing. However, this time we focus on differences explained by young people’s perceptions of the ongoing impact of the pandemic on their life. The models take the form:
\documentclass[12pt]{minimal} \usepackage{amsmath} \usepackage{wasysym} \usepackage{amsfonts} \usepackage{amssymb} \usepackage{amsbsy} \usepackage{mathrsfs} \usepackage{upgreek} \setlength{\oddsidemargin}{-69pt} \begin{document}$$\:LifeSat_{it}={\beta\:}_0+\beta\:{'\:}_1PandemicImpactPercep_i+X{'\:}_i+{\epsilon\:}_{it}\:\:\\$$\end{document}where definitions are per Eq. 1, and \documentclass[12pt]{minimal} \usepackage{amsmath} \usepackage{wasysym} \usepackage{amsfonts} \usepackage{amssymb} \usepackage{amsbsy} \usepackage{mathrsfs} \usepackage{upgreek} \setlength{\oddsidemargin}{-69pt} \begin{document}$$\:PandemicImpactPercep$$\end{document} is a binary variable indicating that person \documentclass[12pt]{minimal} \usepackage{amsmath} \usepackage{wasysym} \usepackage{amsfonts} \usepackage{amssymb} \usepackage{amsbsy} \usepackage{mathrsfs} \usepackage{upgreek} \setlength{\oddsidemargin}{-69pt} \begin{document}$$\:i$$\end{document} reports that the pandemic is continuing to have a negative impact on their life. We, again, estimate separate models for each time point, as well as for Wave 2 adjusting for Wave 1.
The series of models is summarised in Table 5, with the first model (P1) replicating our descriptive findings by including no additional covariates, meaning the coefficient on \documentclass[12pt]{minimal} \usepackage{amsmath} \usepackage{wasysym} \usepackage{amsfonts} \usepackage{amssymb} \usepackage{amsbsy} \usepackage{mathrsfs} \usepackage{upgreek} \setlength{\oddsidemargin}{-69pt} \begin{document}$$\:PandemicImpactPercep$$\end{document} reports the difference between those who report that the pandemic had a negative impact on their mental wellbeing and the rest of the cohort.Table 5. Model specifications for regression analysis of subjective wellbeingVariableP1P2P3P4Perceived ImpactIncludedIncludedIncludedInteracted with Demographics, SES and Social SupportDemographicsIncludedIncludedInteracted with Perceived ImpactSESIncludedIncludedInteracted with Perceived ImpactSocial SupportIncludedInteracted with Perceived ImpactP1-P4 refer to the model number. SES = Socioeconomic status
Next, in P2, we include demographic (gender, ethnicity), methodological (month of survey) and socioeconomic status (parental education, housing tenure, and area-level deprivation) covariates. We do this, rather than including combined SES quintile groups, now that we are not trying to interpret an overall SES association but rather adjust for these as flexibly as possible. Our focal coefficient from this model thus estimates the difference in wellbeing associated with a continuing negative perception of the pandemic on wellbeing among those with similar socio-demographic characteristics.
We then explore the extent to which differences in wellbeing associated with a negative perceived impact of the pandemic are explained by social support. In P3, we add social provisions score and compare the estimate on our focal variable coefficient between models P2 and P3.
Finally, in P4, we explore evidence of variation in the difference in wellbeing associated with a negative perceived impact of the pandemic by demographic and social support measures. We do this by including a full set of interaction terms between our focal variable and the socio-demographic and social support variables in P3.
Importance of Adverse Life Events During the Pandemic
For our final aim, we explore the importance of adverse life events during the pandemic in explaining young people’s wellbeing post-pandemic.
To do so, we use linear regression models to explore the extent to which differences in self-reported wellbeing depend on the adverse life experiences they faced, including conditional on their perception of the impact of the pandemic on their wellbeing. The models used for this purpose take the form:
\documentclass[12pt]{minimal} \usepackage{amsmath} \usepackage{wasysym} \usepackage{amsfonts} \usepackage{amssymb} \usepackage{amsbsy} \usepackage{mathrsfs} \usepackage{upgreek} \setlength{\oddsidemargin}{-69pt} \begin{document}$$\:LifeSat_{it}={\beta\:}_0+\beta\:{'\:}_1TAdverseEventIndex_i+X{'\:}_i+{\epsilon\:}_{it}$$\end{document}where definitions are per Eq. 1, and \documentclass[12pt]{minimal} \usepackage{amsmath} \usepackage{wasysym} \usepackage{amsfonts} \usepackage{amssymb} \usepackage{amsbsy} \usepackage{mathrsfs} \usepackage{upgreek} \setlength{\oddsidemargin}{-69pt} \begin{document}$$\:TAdverseEventIndex$$\end{document} is a vector of binary variables indicating person \documentclass[12pt]{minimal} \usepackage{amsmath} \usepackage{wasysym} \usepackage{amsfonts} \usepackage{amssymb} \usepackage{amsbsy} \usepackage{mathrsfs} \usepackage{upgreek} \setlength{\oddsidemargin}{-69pt} \begin{document}$$\:i$$\end{document} ’s location in the distribution of the adverse life event index (more and average, leaving fewer as a baseline). We, again, estimate separate models for each time point, as well as for Wave 2 adjusting for Wave 1. When modelling Wave 1 wellbeing, a variant of our events index is used based on Wave 1 event reports only.
Our models are summarised in Table 6, with the first model (E1) again replicating our descriptive findings by including only the tertile groups of the adverse life events index. In preliminary work, we explored alternative modelling approaches including using the index as a continuous variable or including the individual adverse life events, as listed in Sect. 6.2. Including tertile groups provided the most interpretable results without substantively affecting model fit.Table 6. Model specifications for regression analysis of subjective wellbeing by life eventsVariableE1E2E3E4E5Adverse EventsIncludedIncludedIncludedIncludedInteracted with Demographics, SES, Social Support and Perceived ImpactDemographicsIncludedIncludedIncludedInteracted with Adverse EventsSESIncludedIncludedIncludedInteracted with Adverse EventsSocial SupportIncludedIncludedInteracted with Adverse EventsPerceived ImpactIncludedInteracted with Adverse EventsE1-E5 refer to the model number. SES = Socioeconomic status
Next, in E2, we add demographic characteristics (gender, ethnicity), socioeconomic status (parental education, housing tenure, and area-level deprivation), and month of survey. This model thus estimates the difference in wellbeing associated with greater experiences of adverse life events during the pandemic among those with similar socio-demographic characteristics, as well how much distribution of events across socio-demographic groups explains wellbeing differences.
We then explore how much differences in wellbeing associated with adverse life events are explained by social support. In E3, we add social provisions score and compare the estimate on our focal variable between models E2 and E3. This is very similar to model L6, but with adverse life events as our focus so these are entered using the tertile groups to aid interpretation.
Next, we include perceived ongoing impact of the pandemic (focal variable in the previous section). As we hypothesise that at least some of the formation of ongoing perceptions of negative impact from the pandemic is due to experience of adverse events, this model (E4) is not a reliable guide to the association between adverse events and wellbeing: including the perception variable is over-controlling. However, the model is useful in comparison with P3 in demonstrating how much of the difference in wellbeing associated with a negative perception of the ongoing impact of the pandemic on wellbeing is explained by experience of adverse life events.
Finally, analogously to previous sections, we include interactions of our focal variables (experience of adverse life events) with our socio-demographic and social support measures in model E5.
Results
In this section, we report results from the regression models outlined in the previous section, beginning with demographic differences in wellbeing Sect. 4.1, then the importance of perceived ongoing impact of the pandemic Sect. 4.2 and, finally, the importance of adverse life events during the pandemic Sect. 4.3. We report our results graphically, focussing attention on the estimates pertinent to addressing our research aims and allowing for easy comparison across models. We provide full regression tables of the results for each model, which are included in Sect. 7 for reference.
Demographic Differences in Subjective Wellbeing
First, we explore overall differences in wellbeing, through the series of models summarised in Table 4. The core results are plotted in Fig. 3 for gender, Fig. 9 for ethnicity, and Fig. 10 for SES. In each case, results are presented for Wave 1, Wave 2, and Wave 2 adjusted for Wave 1, with the discussion starting out with Wave 1 in each case, before discussing notable differences in Wave 2, or Wave 2 adjusted for Wave 1. Full results tables for these models are reported in Sect. 7: Table 9 for Wave 1, Table 10 for Wave 2, and Table 11 for Wave 2 adjusted for Wave 1.Fig. 3. Differences in wellbeing by gender Notes: Reporting coefficients from underlying regression models reported in Tables 9 and 10, and Table 11
In the case of gender (Fig. 3), we essentially replicate the descriptive findings (Table 1) in L1, finding that girls’ wellbeing is 0.63 points lower than for boys, and a larger reduction for those grouped as non-binary + where the reduction is 1.9 points compared to boys. There is essentially no change when we adjust for ethnicity and SES in L4, with the differences remaining 0.63 points for girls and 1.9 points for non-binary + young people.
Part of the difference in wellbeing among non-binary + young people is explained by variation in social support: when including social provisions in L6 the difference reduces to 1.4 points compared to boys. This makes a similar difference at Wave 2, but no difference for girls at any wave, nor for non-binary + youth when considering Wave 2 wellbeing adjusted for Wave 1 wellbeing.
A small part of the remaining difference is explained by experiences of adverse life events, reducing to 1.2 for non-binary + young people and to 0.5 for girls, although the difference between L6 and L8 is not statistically significant for the non-binary + group, nor quite statistically significant at the 5% level for girls.
We do not find consistent differences in wellbeing by ethnicity or gender after adjusting for covariates; reporting of these results may be found in Sect. 8.
Perceived Continuing Impact of the Pandemic on Wellbeing
Next, we discuss differences in wellbeing by perceived continuing impact of the pandemic using the models summarised in Table 5. Core results are plotted in Fig. 4. Full tables of results for these models are reported in Sect. 7, Table 12 (Wave 1), Table 13 (Wave 2) and Table 14. (Wave 2 adjusting for Wave 1).Fig. 4. Differences in wellbeing by perceived continuing impact of pandemic on wellbeing Notes: Reporting coefficients from underlying regression models reported in Tables 12 and 13, and Table 14.
Results from unconditional model P1 indicate that young people who perceive a negative continuing impact of the pandemic on their wellbeing report 1.1 points lower wellbeing score than those who do not perceive such an impact. Perhaps surprisingly, given the greater time that has elapsed since the pandemic, this difference is larger at Wave 2, with a 1.4-point difference between these two groups. However, we should recall that the report of a negative continuing impact of the pandemic is collected at Wave 2, so may reflect this being more contemporary with the report.
A fairly small part of the difference in wellbeing score is explained by inclusion of demographic characteristics (in P2) and social support (in P3). The differences are reduced to 0.85 points and 1.2 points at Wave 1 and Wave 2, respectively, once all of these covariates have been included. This highlights a significant unexplained component of wellbeing unexplained by young people’s observable characteristics and social support — although we will return to whether more of this difference can be explained by adverse life events during the pandemic in the next section.
The unconditional difference in wellbeing by perceived continuing impact of the pandemic on wellbeing at Wave 2 is lower in models where we have adjusted for Wave 1 wellbeing (0.85 points). However, demographic and social support controls make essentially no difference for this outcome, with the difference remaining 0.81 points once these have been included, with a very similar magnitude to that seen in the fully adjusted model for Wave 1.
We do not find evidence that social support mediates differences in wellbeing by perceived impact of the pandemic (see Fig. 12 in Sect. 8), nor that the differences in wellbeing associated with perceived impact of the pandemic are moderated by young people’s demographic characteristics of socioeconomic background (see Sect. 7).
Adverse Life Events
Next, we turn to the importance of adverse life events for young people’s wellbeing. This is explored through the series of models summarised in Table 6; full results are reported in Tables 15, 16 and 17. in Sect. 7. The core results are plotted in Fig. 5, demonstrating the association unconditionally (E1), adjusting for demographic measures (E2), and adjusting also for social support (E3).Fig. 5. Differences in wellbeing by experience of adverse life events. Notes: Reporting coefficients from underlying regression models reported in Tables 15 and 16, and Table 17.
Those who experienced more adverse life events during the pandemic report substantially lower wellbeing, with the unconditional difference between the “fewer” and “more” adverse life events tertile groups being 1.4 points at Wave 1 and 1.3 points at Wave 2. A small part of this is explained by demographics (in E2), while more is explained by social support (in E3), especially for those who experienced the most adverse life events (i.e., the More Adverse Events Tertile Group), bringing the gap between low and high groups to 0.85 points at Wave 1 and 0.88 points at Wave 2.
The patterns are similar but substantially attenuated when considering Wave 2 differences controlling for Wave 1 wellbeing. Nevertheless, there remains a substantial difference (0.36 points) in wellbeing at Wave 2 by adverse events experienced after controlling for Wave 1 wellbeing, demographic characteristics and social support.
Building on the models reported in Fig. 5, we also explore whether the association between adverse life events and wellbeing is mediated by the perceived ongoing impact of the pandemic on wellbeing, plotting results in Fig. 6. We find only a small part of perceived ongoing impact of the pandemic on wellbeing is explained by experience of adverse life events during the pandemic.Fig. 6. Differences in wellbeing by perceived ongoing negative impact of the pandemic, with and without controlling for adverse life events. Notes: Reporting coefficients from underlying regression models reported in Tables 12 and 13, and Table 14. (for P3), and Tables 15 and 16, and Table 17. (for E4)
We also explored whether there was evidence that adverse events matter more for some groups than others, but find little evidence of this. These results are reported in column E5 of Tables 15, 16 and 17. in Sect. 7.
Discussion, Conclusions and Limitations
This study contributes to existing literature on young people’s wellbeing in England in the aftermath of the COVID-19 pandemic by exploring levels of wellbeing at two time points since the pandemic and the factors associated with these levels. We build on existing work showing that the pandemic has had a negative impact on young people’s wellbeing (e.g., Mansfield et al., 2022), along with evidence of recovery in wellbeing in the latter phases of the pandemic (Henseke et al., 2022; Henseke & Schoon, 2025), although we emphasise that our findings about the state of post-pandemic inequalities do not imply that these have been caused by the pandemic and its restrictions. We have, however, explored the ongoing role of the pandemic through the importance of young people’s own perceptions of its ongoing impact on their wellbeing, as well as the role of adverse life events experienced during the period.
Our results contribute to evidence on gender differences in wellbeing (e.g., Davillas & Jones, 2021). Girls and those who identify as non-binary or in another way report lower wellbeing scores (on a scale from 1 to 10 around 0.5 for girls; around 1.5 for non-binary + young people) than boys. This persists after adjusting for other demographic characteristics, self-reported levels of social support, and experience of adverse life events, contributing to a picture of these inequalities as grounded in a complex set of societally-mediated causes (Guo et al., 2024), which also raise the possibility of variations by gender in the relative importance of different aspects of the social production function (SPF) itself (Steverink et al., 2020), rather than simply that the function’s inputs differ by gender. That said, without analysis of all dimensions of the SPF, this study is not well-placed to provide strong evidence on this point. These inequalities are substantial and relevant to the higher rates of mental health challenges for those in these groups (Yoon et al., 2023). Our findings for non-binary + young people support limited existing evidence (Marquez et al., 2023), but we emphasise that the small sample size of this group in our data means exercising caution in its interpretation.
Our analysis makes innovative use of young people’s own perceptions of the ongoing impact of the pandemic on their mental wellbeing in order to validate and quantify these reports. Our findings illustrate the importance of taking such reports seriously: those who indicate an ongoing negative impact in their lives have substantially lower subjective wellbeing scores — more than 1 point on a 1–10 scale — with similar differences across demographic groups. Moreover, these differences are only partially explained by demographic characteristics, social support, or adverse life events experienced during the pandemic, while there is also little evidence of differential response to a perceived negative impact by socioeconomic background or demographic characteristics. This leaves a substantial difference in wellbeing associated with this perception demonstrating that such perceptions are informative in their own right, analogously to how educational expectations (Anders, 2017) and aspirations (Hart, 2016) can be informative of young people’s educational trajectories over and above other factors. As with that literature, our finding should not be taken to mean such perceptions should be considered causal (Gorard, 2012). While it is probable that there are elements of the SPF that underly these young people’s perceptions, we argue that this does not diminish their informational value and, hence, the importance of taking them seriously (Morgan, 1998). This implies that, nuancing our previous point, there are limits on the extent to which we can target support based on demographic characteristics alone. Self-identification is likely necessary to find those most in need of support, albeit with risks since self-reporting behaviour in a survey likely differs from self-reporting for the purposes of intervention. These findings are similar in spirit to those of Fernandez-Urbano and Samuel (2024), who identify contemporaneous links between how well young people report coping with the pandemic and their subjective wellbeing. We emphasise that the analogy is far from perfect: we are not claiming that a perception of continuing negative impact on wellbeing is the same thing as reporting not coping with the situation, for example. Moreover, unlike Fernandez-Urbano and Samuel (2024), we do not find evidence of differences in response by young people’s socioeconomic status. Nevertheless, these findings align in illustrating the role of such reports in understanding young people’s wellbeing.
Adverse life events experienced during the pandemic are also found to predict lower subjective wellbeing. This is consistent with these undermining aspects of the SPF, such as affection (for events such as arguments within the home) or comfort (in situations of financial distress) (Chesters, 2025), along with previous findings that adverse life events are associated with lower wellbeing (Hombrados-Mendieta et al., 2019; McKnight et al., 2002). However, contrary to our expectations, and others’ findings (Aksoy et al., 2024; Ferreira et al., 2021; Kearns et al., 2015), we did not find evidence that social support mediates or buffers the impact of adverse life events in the context of this study. One potential reason for this is that the source of the social support matters: Lee and Goldstein (2016) find that only support from friends (not family or partners) matters in a study of the stress-buffering role of social support for loneliness. We would expect this to be the source of social support most likely to be cut off by COVID-19 restrictions, although we note that this will not be entirely the case due to the compensatory mechanism of increased use of digital contact between friends in the context of the pandemic (Juvonen et al., 2022). Nevertheless, we contend that this is unlikely entirely successfully to replicate the benefits of in-person contact (Flannery et al., 2021; Long et al., 2022). More methodologically, with hindsight we note that, while our measures of social support are contemporaneous with our wellbeing measures, they are not contemporaneous with the timing of the adverse events themselves, which may mean they are not providing an accurate depiction of perceived social support during pandemic disruption.
This study benefits from a large, representative, longitudinal dataset, with direct reports from both young people and parents to improve the quality of data collected. Nevertheless, we are mindful of the limitations of this study, most particularly that our data lacks pre-pandemic baseline measures of wellbeing, which would substantially increase our ability to understand the longer-term dynamics of the changes (or lack thereof) in wellbeing that we have observed. Furthermore, our data is drawn from a single cohort of young people in England, whose final years in compulsory education were especially disrupted by the impacts of the pandemic, which is important context in any attempt to generalise our findings to other populations. As noted above, we also emphasise the small sample size of our non-binary + group, which limits the robustness of findings for this group.
Our findings indicate continuing challenges of inequalities in young people’s wellbeing and, hence, the importance of ongoing targeted support to overcome these. We reiterate, however, that we do not link these inequalities particularly with lingering effects of the pandemic since we did not find evidence of differences in the association between perceived continuing impact of the pandemic on wellbeing and young people’s socioeconomic or demographic characteristics. However, in some ways inequalities not linked to the pandemic are of greater concern, given little reason to expect them to subside without intervention. As such, the large differences in wellbeing associated with identifying as non-binary or in another way may suggest a particular need for support among this group, although we reiterate the small sample sizes involved in findings for those identifying as neither male nor female, making further evidence for this group especially important. The practicalities of providing support at scale are now much harder for our specific cohort, since many have now left education entirely. Nevertheless, the issues discussed will apply similarly to those still working their way through the education system who could be reached through schools and colleges. As well as the negative implications for the life experiences of these young people, ignoring this issue has potential implications for national economic performance (Deaton, 2008), including via increased risk of mental health challenges (Lombardo et al., 2018).
The reference list from the paper itself. Each links out to its DOI / PubMed record.
- 1Adali, T., Anders, J., Calderwood, L., Cullinane, C., Hamlyn, B., Kennett, J., Shao, X., Taylor, L., & Xu, D. (2022). COVID social mobility & opportunities study (COSMO): Wave 1 user guide (Version 1) [User guide]. UCL Centre for Education Policy; Equalising Opportunities. https://cosmostudy.uk/assets/9000_cosmo_w 1_user_guide_v 2.pdf
- 2Adali, T., Anders, J., Calderwood, L., Cullinane, C., Hamlyn, B., Kennett, J., Shao, X., Taylor, L., & Xu, D. (2023). COVID social mobility & opportunities study (COSMO): Wave 2 user guide (Version 1) [User guide]. UCL Centre for Education Policy; Equalising Opportunities. https://cosmostudy.uk/assets/cosmo-w 2-user-guide-v 1.pdf
- 3Anders, J. (2017). The influence of socioeconomic status on changes in young people’s expectations of applying to university. Oxford Review of Education, 43(4), 1–21. 10.1080/03054985.2017.1329722
- 4Anders, J. (2024). The pandemic, socioeconomic disadvantage, and learning outcomes in England. In S. V. Schnepf, D. A. Klinger, O. Giancola, & L. Salmieri (Eds.), The pandemic, socioeconomic disadvantage, and learning outcomes: Cross national impact analyses of education policy reforms. Publications Office of the European Union. https://data.europa.eu/doi/10.2760/800165
- 5Anders, J., Calderwood, L., Crawford, C., Cullinane, C., Goodman, A., Macmillan, L., Patalay, P., & Wyness, G. (2024 a). COVID social mobility and opportunities study: Wave 1, 2021–2022 (4th ed.) [Dataset]. UK Data Service. 10.5255/UKDA-SN-9000-4
- 6Anders, J., Calderwood, L., Crawford, C., Cullinane, C., Goodman, A., Macmillan, L., Patalay, P., & Wyness, G. (2024 b). COVID social mobility and opportunities study: Wave 2, 2022-2023 (2nd ed.) [Dataset]. UK Data Service. 10.5255/UKDA-SN-9158-2
- 7Chesters, J. (2025). The Impact of COVID-19 on Young People’s Levels of Subjective Well-being: Evidence from HILDA 2001–2020. In C. Suter, J. Chesters, & S. Fachelli (Eds.), Well-being During the Pandemic: Comparative Perspectives from the Global North and South (pp. 279–295). Springer Nature Switzerland. 10.1007/978-3-031-63440-6_13
- 8Cutrona, C. E., & Russell, D. W. (2018). Social Provisions Scale [dataset]. American Psychological Association. 10.1037/t 06213-000