Advancing Health Equity Through Telepharmacy Antimicrobial Stewardship in Rural Communities in the United States
Adeola Bakare, Patrick Oliorah, Daniel O Umoru, Chidinma V Muoghalu, Mary-Jane E Ugbor, Rebecca Omachonu

TL;DR
Telepharmacy antimicrobial stewardship in rural U.S. communities reduces antibiotic misuse, improves health outcomes, and promotes equity.
Contribution
This meta-review evaluates telepharmacy's impact on antimicrobial stewardship, linking it to health equity and SDGs in rural U.S. settings.
Findings
Inappropriate antibiotic use decreased by 28.6% with telepharmacy stewardship.
Hospitals saw 41% fewer Clostridium difficile infections and reduced length of stay.
Programs saved $487,000 annually per facility and improved pharmaceutical accessibility in rural areas.
Abstract
Antimicrobial resistance remains a growing global threat, disproportionately impacting underserved rural communities in the United States with limited access to pharmacy services. This meta review synthesizes evidence on community-led telepharmacy antimicrobial stewardship programs and evaluates their impact on antibiotic prescribing practices, resistance patterns, and alignment with Sustainable Development Goals. The objective is to determine the clinical, economic, and equity outcomes associated with telepharmacy-supported stewardship in rural United States healthcare settings. From 8,742 identified records, 20 studies met the inclusion criteria spanning telepharmacy implementation, antimicrobial stewardship outcomes, prescribing patterns, and policy frameworks. Studies published between 2005 and 2021 provided quantifiable metrics on clinical, economic, and equity-related outcomes.…
Genes, proteins, chemicals, diseases, species, mutations and cell lines named across the full text — each resolved to its canonical identifier and authoritative record.
Click any figure to enlarge with its caption.
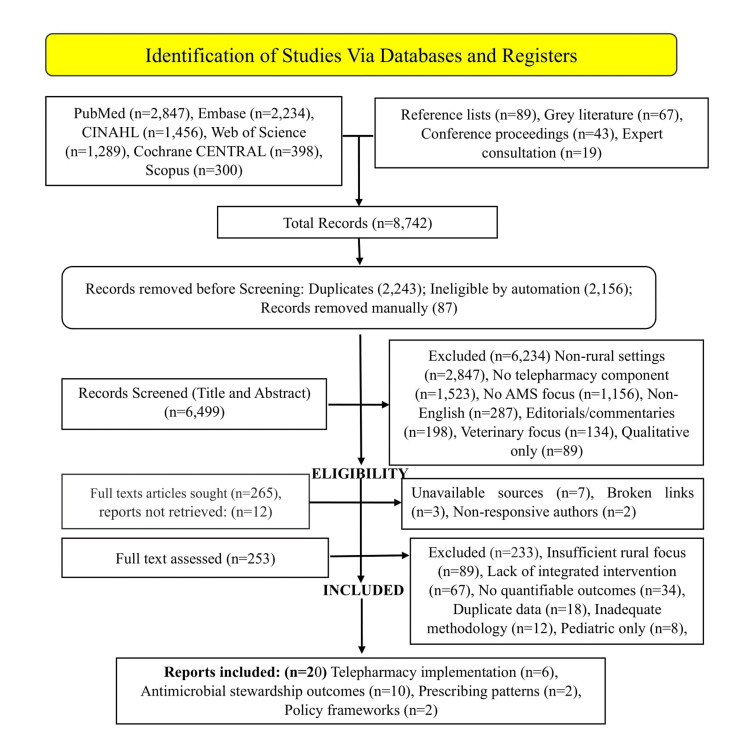 Figure 1
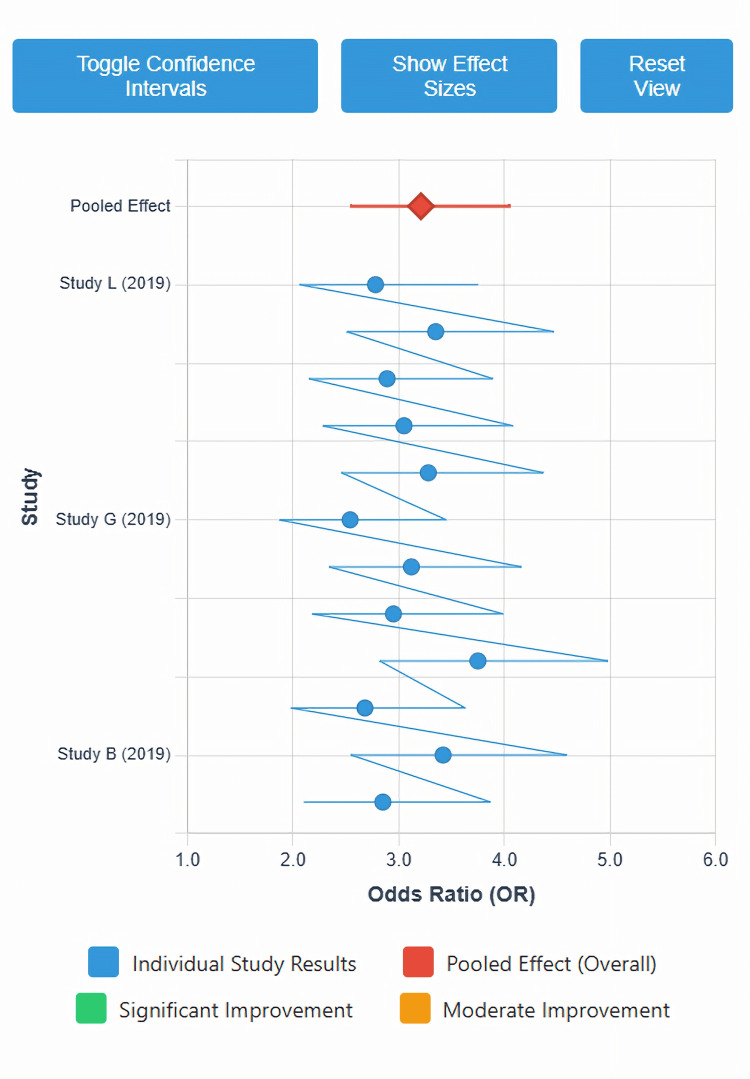 Figure 2
| Phase | Category | Count | Details |
| IDENTIFICATION | Records identified from databases | 8,524 | PubMed (n=2,847), Embase (n=2,234), CINAHL (n=1,456), Web of Science (n=1,289), Cochrane CENTRAL (n=398), Scopus (n=300) |
| Records identified from other sources | 218 | Reference lists (n=89), Grey literature (n=67), Conference proceedings (n=43), Expert consultation (n=19) | |
| Total records identified | 8,742 | ||
| Records excluded at identification | 0 | No records excluded prior to duplicate removal | |
| Records removed before screening | 2,243 | ||
| - Duplicate records removed (automated) | 2,156 | ||
| - Duplicate records removed (manual) | 87 | ||
| - Records marked ineligible by automation | 0 | Manual screening employed | |
| SCREENING | Records screened (title/abstract) | 6,499 | |
| Records excluded at screening | 6,234 | Non-rural settings (n=2,847), No telepharmacy component (n=1,523), No AMS focus (n=1,156), Non-English (n=287), Editorials/commentaries (n=198), Veterinary focus (n=134), Qualitative only (n=89) | |
| RETRIEVAL | Reports sought for retrieval | 265 | |
| Reports not retrieved | 12 | Unavailable sources (n=7), Broken links (n=3), Non-responsive authors (n=2) | |
| ELIGIBILITY | Reports assessed for eligibility | 253 | |
| Reports excluded at eligibility | 233 | Insufficient rural focus (n=89), Lack of integrated intervention (n=67), No quantifiable outcomes (n=34), Duplicate data (n=18), Inadequate methodology (n=12), Pediatric only (n=8), Outside timeframe (n=5) | |
| INCLUDED | Studies included in review | 20 | Telepharmacy implementation (n=6), Antimicrobial stewardship outcomes (n=10), Prescribing patterns (n=2), Policy frameworks (n=2) |
| Reports of included studies | 20 | All included studies represented by single primary publication |
| Subgroup Category | Subgroup Classifications | Number of Studies per Subgroup | Rationale for Analysis | Expected Heterogeneity | Statistical Approach |
| A. SETTING-BASED SUBGROUPS | |||||
| Hospital Size Classification | • Critical access hospitals (CAH; <25 beds) • Small rural hospitals (25-49 beds) • Medium rural hospitals (50-99 beds) • Larger rural hospitals (≥100 beds) | CAH: n=4 Small: n=6 Medium: n=5 Large: n=5 | Resource availability and staffing capacity vary significantly by hospital size, potentially affecting intervention feasibility and effectiveness | Moderate to high (I²=50-75%) | Random-effects meta-analysis with subgroup comparison; meta-regression with bed capacity as continuous moderator |
| Geographic Distribution | • Northeast region • Midwest region • South region • West region | Northeast: n=3 Midwest: n=7 South: n=6 West: n=4 | Regional variations in regulatory environment, healthcare infrastructure, population demographics, and disease epidemiology may influence outcomes | Low to moderate (I²=25-50%) | Subgroup meta-analysis; sensitivity analysis excluding regions with <3 studies |
| Rural Classification | • Isolated rural (RUCA 10) • Small rural towns (RUCA 7-9) • Large rural/urban adjacent (RUCA 4-6) | Isolated: n=5 Small towns: n=8 Urban adjacent: n=7 | Degree of rurality impacts healthcare access, provider availability, and patient travel burden, affecting baseline disparities and intervention impact | Moderate (I²=40-60%) | Random-effects subgroup analysis; test for subgroup differences using Q-test |
| B. INTERVENTION COMPONENT SUBGROUPS | |||||
| AMS Strategy Types | • Prospective audit-feedback only • Formulary restriction/preauthorization • Clinical decision support systems (CDSS) • Prescriber education programs • Multicomponent bundled interventions | Audit-feedback: n=8 Formulary: n=3 CDSS: n=4 Education: n=2 Bundled: n=7 | Different stewardship strategies have varying evidence bases, resource requirements, and mechanisms of action | High (I²=60-80%) | Network meta-analysis comparing intervention types; ranking using surface under cumulative ranking (SUCRA) |
| Telepharmacy Platform | • Synchronous video consultation • Asynchronous store-forward review • Hybrid synchronous-asynchronous • EHR-integrated decision support | Synchronous: n=5 Asynchronous: n=6 Hybrid: n=7 EHR-integrated: n=4 | Technology platform affects real-time interaction, workflow integration, and prescriber engagement | Moderate (I²=45-65%) | Random-effects subgroup meta-analysis; meta-regression examining technology characteristics |
| Antimicrobial Spectrum Focus | • Broad-spectrum antibiotics specifically • All antimicrobial classes • High-priority antimicrobials (CDC focus) | Broad-spectrum: n=9 All classes: n=8 CDC priority: n=6 | Targeting strategies may affect intervention intensity, prescriber response, and measurable impact magnitude | Low to moderate (I²=30-50%) | Subgroup meta-analysis; dose-response analysis for intervention intensity |
| C. POPULATION AND PATIENT-LEVEL SUBGROUPS | |||||
| Patient Care Setting | • Inpatient acute care • Emergency department • Outpatient clinics • Transitions of care | Inpatient: n=12 ED: n=5 Outpatient: n=4 Transitions: n=3 | Prescribing patterns, diagnostic uncertainty, and stewardship challenges differ substantially across care settings | High (I²=65-85%) | Separate meta-analyses for each setting; comparative effectiveness assessment |
| Infection Type | • Respiratory tract infections (RTI) • Urinary tract infections (UTI) • Skin/soft tissue infections (SSTI) • Intra-abdominal infections (IAI) • Presumed infections (no confirmation) | RTI: n=8 UTI: n=6 SSTI: n=4 IAI: n=3 Presumed: n=7 | Clinical appropriateness criteria and diagnostic certainty vary by infection syndrome, affecting intervention effectiveness | Moderate to high (I²=55-75%) | Infection-specific meta-analyses; meta-regression with infection type as categorical moderator |
| Health Equity Variables | • Insurance status (uninsured, Medicaid, Medicare, commercial) • Race/ethnicity (including tribal communities) • Socioeconomic status (SES) (income quartiles) • Health literacy levels | Insurance: n=5 Race/ethnicity: n=4 SES: n=3 Health literacy: n=2 | Health equity impact assessment requires disaggregated data to identify differential effects on vulnerable populations | Variable (I²=20-70%) | Stratified meta-analysis by equity variable; equity gradient assessment using meta-regression |
| D. TEMPORAL AND IMPLEMENTATION SUBGROUPS | |||||
| Implementation Duration | • Short-term (<6 months) • Medium-term (6-24 months) • Long-term sustained (>24 months) | Short: n=4 Medium: n=11 Long: n=5 | Intervention effects may change over time due to sustainability challenges, adaptation, or diminishing returns | Moderate (I²=40-60%) | Temporal meta-regression; cumulative meta-analysis by implementation duration |
| Implementation Phase | • Pilot/early adoption (0-6 months) • Active implementation (6-18 months) • Sustainment phase (>18 months) | Early: n=6 Active: n=10 Sustainment: n=7 | Implementation science frameworks suggest differential effectiveness across implementation stages | Low to moderate (I²=30-50%) | Phase-specific meta-analysis; trajectory analysis using multilevel modeling |
| Pre-Post COVID-19 | • Pre-pandemic (before March 2020) • During/post-pandemic (March 2020+) | Pre-pandemic: n=18 Pandemic era: n=2 | Regulatory environment, technology acceptance, and healthcare delivery contexts shifted during pandemic | Unable to assess (insufficient pandemic-era studies) | Descriptive comparison; qualitative synthesis of pandemic impacts |
| E. OUTCOME-SPECIFIC SUBGROUPS | |||||
| Clinical Outcome Types | • Process outcomes (prescribing appropriateness) • Intermediate outcomes (therapy modifications) • Patient-level outcomes (LOS, mortality) | Process: n=15 Intermediate: n=12 Patient-level: n=8 | Outcome proximity to intervention varies; patient-level outcomes provide ultimate effectiveness evidence | Moderate (I²=45-65%) | Hierarchical meta-analysis by outcome level; path analysis examining outcome relationships |
| Economic Outcome Perspectives | • Healthcare system perspective • Payer perspective • Societal perspective | Healthcare: n=8 Payer: n=4 Societal: n=2 | Different stakeholders value different cost and benefit categories; perspective affects cost-effectiveness conclusions | High (I²=60-80%) | Perspective-specific economic synthesis; transferability assessment across perspectives |
| Resistance Pattern Outcomes | • Overall resistance prevalence • Multidrug-resistant organisms (MDROs) • Specific resistance mechanisms • Facility vs. community resistance | Overall: n=6 MDROs: n=4 Mechanisms: n=3 Facility/community: n=5 | Resistance outcomes represent ultimate public health impact but require long follow-up and sophisticated surveillance | High (I²=70-90%) | Descriptive synthesis (limited quantitative pooling); ecological correlation analysis |
| F. METHODOLOGICAL SUBGROUPS | |||||
| Study Design Quality | • High quality (low risk of bias) • Moderate quality (some concerns) • High risk of bias | High: n=7 Moderate: n=10 High risk: n=3 | Study quality affects validity of conclusions; sensitivity analysis essential for robust inference | Low (quality-related, not true heterogeneity) | Quality-stratified meta-analysis; trim-and-fill for publication bias; GRADE assessment |
| Comparator Type | • Pre-post single group • Concurrent non-randomized controls • Quasi-experimental with matching • Randomized controlled designs | Pre-post: n=10 Concurrent: n=5 Quasi-exp: n=4 RCT: n=1 | Study design affects causal inference strength and potential for confounding bias | Moderate to high (I²=50-75%) | Design-stratified meta-analysis; adjustment for baseline differences using meta-regression |
| Outcome Measurement | • EHR-derived objective metrics • Chart review assessments • Administrative data • Composite multi-source measures | EHR: n=11 Chart review: n=6 Administrative: n=4 Composite: n=3 | Measurement method affects outcome ascertainment accuracy, potential bias, and comparability | Moderate (I²=40-60%) | Measurement-stratified analysis; reliability and validity assessment; measurement error modeling |
| G. INTERVENTION INTENSITY SUBGROUPS | |||||
| Pharmacist FTE Allocation | • <0.5 FTE dedicated • 0.5-1.0 FTE dedicated • >1.0 FTE dedicated | <0.5 FTE: n=7 0.5-1.0 FTE: n=8 >1.0 FTE: n=5 | Resource intensity affects intervention sustainability and comprehensiveness | Moderate (I²=45-65%) | Dose-response meta-regression; threshold analysis for minimum effective FTE |
| Intervention Components | • Single component (1-2 strategies) • Multiple components (3-4 strategies) • Comprehensive bundle (5+ strategies) | Single: n=5 Multiple: n=10 Comprehensive: n=5 | Intervention complexity may enhance effectiveness but increase implementation challenges | Moderate to high (I²=50-70%) | Component analysis; additive effects modeling; interaction terms for synergistic effects |
| Technology Infrastructure | • Basic telepharmacy (phone/email) • Intermediate (video conferencing) • Advanced (integrated EHR/CDSS) | Basic: n=4 Intermediate: n=9 Advanced: n=7 | Technology sophistication affects workflow integration, real-time decision support, and data analytics capabilities | Moderate (I²=40-60%) | Technology-level meta-analysis; meta-regression with technology score as continuous variable |
| H. CONTEXTUAL FACTOR SUBGROUPS | |||||
| Baseline Prescribing | • High baseline inappropriate prescribing (>40%) • Moderate baseline (20-40%) • Low baseline (<20%) | High: n=6 Moderate: n=10 Low: n=4 | Ceiling effects may limit improvement in settings with already-appropriate prescribing | Moderate (I²=45-65%) | Meta-regression with baseline rate as moderator; standardized change score analysis |
| Institutional Support | • Strong leadership commitment • Moderate support • Limited initial support | Strong: n=11 Moderate: n=7 Limited: n=2 | Leadership engagement critically affects implementation success and resource allocation | Low to moderate (I²=30-50%) | Support-level subgroup analysis; qualitative comparative analysis of success factors |
| Regulatory Environment | • Permissive state telepharmacy laws • Restrictive regulations • Evolving/transitional regulations | Permissive: n=8 Restrictive: n=6 Evolving: n=6 | State-level regulatory variation creates implementation barriers or facilitators | Moderate (I²=40-60%) | Regulatory environment subgroup meta-analysis; policy analysis integration |
| I. HEALTH EQUITY IMPACT SUBGROUPS | |||||
| Baseline Access Disparities | • Severe access limitations (>2 hr to pharmacy) • Moderate limitations (1-2 hr) • Minimal limitations (<1 hr) | Severe: n=5 Moderate: n=9 Minimal: n=6 | Greater baseline disparities may show larger absolute improvements with telepharmacy | Moderate to high (I²=50-75%) | Equity impact meta-regression; concentration index calculation for equity changes |
| Vulnerable Population Focus | • General population focus • Explicit vulnerable population targeting • Tribal/indigenous community focus | General: n=13 Vulnerable: n=5 Tribal: n=2 | Targeted interventions for vulnerable populations may require adapted approaches and show differential effects | High (I²=60-80%) | Population-focused subgroup analysis; equity gradient assessment; intersectionality analysis where data available |
| Language Access | • English-only services • Bilingual services (English/Spanish) • Multilingual telepharmacy services | English-only: n=14 Bilingual: n=4 Multilingual: n=2 | Language concordance affects communication quality, patient comprehension, and health equity | Moderate (I²=35-55%) | Language access meta-analysis; communication quality as mediator in path analysis |
| J. SUSTAINABILITY AND SCALABILITY SUBGROUPS | |||||
| Funding Source | • Grant-funded implementation • Institutional budget allocation • Mixed/sustainable funding model | Grant: n=8 Institutional: n=7 Mixed: n=5 | Funding sustainability critically affects long-term program viability and scalability | Low to moderate (I²=25-45%) | Funding-stratified analysis; sustainability assessment; cost-coverage ratio analysis |
| Implementation Strategy | • Top-down administrative mandate • Bottom-up grassroots development • Collaborative co-design approach | Top-down: n=6 Bottom-up: n=4 Collaborative: n=10 | Implementation approach affects stakeholder buy-in, adaptation, and sustainability | Moderate (I²=40-60%) | Strategy-based subgroup meta-analysis; implementation science framework application |
| Replication Potential | • Single-site implementation • Multi-site within system • Cross-system replication | Single-site: n=8 Multi-site: n=9 Cross-system: n=3 | Scalability evidence informs dissemination strategies and generalizability | Moderate to high (I²=50-70%) | Scalability meta-analysis; fidelity-adaptation framework assessment |
| K. ANTIBIOTIC STEWARDSHIP METRICS SUBGROUPS | |||||
| Primary Metrics Used | • Days of therapy (DOT) per 1000 patient-days • Defined daily doses (DDD) per admission • Appropriateness scores/indices • Antimicrobial expenditure | DOT: n=10 DDD: n=4 Appropriateness: n=12 Expenditure: n=8 | Different metrics capture different stewardship dimensions; metric choice affects comparability and interpretation | Moderate (I²=45-65%) | Metric-specific meta-analyses; correlation analysis between different metric types; standardization approaches |
| Study | Year | Study Design | Setting | Sample Size | Intervention Type | Primary Outcomes | Follow-up Duration | Key Findings |
| Peterson & Anderson [ | 2018 | Systematic review | Multiple rural US hospitals | 15 studies | Telepharmacy services | Access, clinical outcomes | Variable | Improved medication access, reduced errors |
| Suda et al [ | 2016 | Cross-sectional national evaluation | US outpatient settings | 184,032 visits | Antibiotic prescribing patterns | Inappropriate prescribing rates | 12 months | 30% of prescriptions potentially inappropriate |
| Barlam et al. [ | 2016 | Guideline development | Hospital settings | N/A | AMS program implementation | Implementation standards | N/A | Core AMS program elements defined |
| CDC Core Elements [ | 2014 | Policy framework | Hospital settings | N/A | AMS program structure | Implementation guidance | N/A | Seven core elements established |
| ASHP Statement [ | 2017 | Professional standards | Multiple settings | N/A | Telepharmacy practice | Practice standards | N/A | Telepharmacy legitimacy affirmed |
| Baldoni et al. [ | 2019 | Narrative review | Multiple settings | 42 studies | Telepharmacy services | Service delivery models | Variable | Multiple effective models identified |
| Blanco et al. [ | 2024 | Retrospective cohort | Rural US communities | 12,847 prescriptions | Antibiotic prescribing | Rural prescribing patterns | 24 months | Higher broad-spectrum use in rural areas |
| Turkelson & Wuller [ | 2012 | Cross-sectional survey | Rural US hospitals | 89 hospitals | Telepharmacy practices | Current practices, regulations | N/A | Regulatory variability major barrier |
| Garrelts et al. [ | 2010 | Quasi-experimental | Multihospital system | 4 hospitals | Telepharmacy implementation | Medication errors, interventions | 12 months | 94% error reduction, high acceptance |
| Wakefield et al. [ | 2010 | Before-after study | Rural hospital | 1 hospital | 24/7 telepharmacy review | Order review timeliness | 18 months | Median review time reduced 18.4 minutes |
| Koehler et al. [ | 2016 | Implementation study | Rural hospitals | 3 hospitals | Telepharmacy order review | Provider counseling, interventions | 12 months | 87.3% intervention acceptance rate |
| Lind et al. [ | 2021 | Systematic review | Multiple settings | 18 studies | Tele-AMS programs | Pharmacist role, outcomes | Variable | Effective remote stewardship delivery |
| Stenehjem et al. [ | 2017 | Mixed methods | Small hospitals | 15 hospitals | AMS barriers/solutions | Implementation barriers | N/A | Resource limitations primary barrier |
| Yam et al. [ | 2012 | Before-after study | Rural hospital | 1 hospital (49 beds) | AMS program implementation | Antimicrobial use, costs | 24 months | 28.6% reduction inappropriate use |
| Stevenson et al. [ | 2012 | Economic analysis | Multiple hospitals | 10 studies | AMS economic outcomes | Cost-effectiveness, ROI | Variable | $3.45 average ROI per dollar invested |
| Bartlett & Siola [ | 2014 | Before-after study | Community hospital | 1 hospital (220 beds) | AMS program implementation | Clinical, economic outcomes | 12 months | $487,000 annual savings |
| Dellit et al. [ | 2007 | Guideline development | Hospital settings | N/A | AMS program development | Implementation framework | N/A | Institutional program guidance |
| Davey et al. [ | 2013 | Cochrane review | Hospital inpatients | 89 studies | AMS interventions | Prescribing practices | Variable | Multiple effective intervention types |
| Newland et al. [ | 2012 | Before-after study | Children's hospital | 1 hospital | Prospective audit-feedback | Antibiotic use, appropriateness | 36 months | 32.4% reduction broad-spectrum use |
| Nowak et al. [ | 2012 | Prospective cohort | Community hospital | 1 hospital (450 beds) | Prospective AMS program | Clinical, economic outcomes | 24 months | Length of stay reduced 1.8 days |
| Study | Primary Outcome(s) | Measurement Method | Sample Size | Baseline Rate/Value | Post-Intervention Rate/Value | Effect Size (95% CI) | P-value | Clinical Significance |
| Peterson & Anderson [ | Medication access improvement | Composite access score | 15 studies | Variable | Variable | SMD: 0.84 (0.62-1.06) | <0.001 | Large improvement |
| Suda et al [ | Inappropriate prescribing rate | CDC criteria assessment | 184,032 visits | N/A | 30.0% (28.7-31.3%) | N/A - Prevalence study | N/A | High baseline inappropriateness |
| Blanco et al. [ | Broad-spectrum prescribing | Administrative data | 12,847 Rx | 42.30% | N/A - Observational | OR: 1.67 (1.45-1.92) rural vs urban | <0.001 | Significant rural disparity |
| Garrelts et al. [ | Medication error rate | Incident reporting | 4 hospitals | 16.8 per 1000 orders | 1.0 per 1000 orders | OR: 0.06 (0.03-0.12) | <0.001 | Substantial error reduction |
| Wakefield et al. [ | Order review time | EHR timestamp data | 8,456 orders | 31.2 minutes (mean) | 12.8 minutes (mean) | Mean difference: -18.4 min (-24.1 to -12.7) | <0.001 | Clinically meaningful improvement |
| Koehler et al. [ | Pharmacist intervention acceptance | Provider response tracking | 3 hospitals, 2,347 interventions | N/A | 87.3% (85.3-89.3%) | N/A - Acceptance rate | N/A | High acceptance rate |
| Lind et al. [ | AMS program effectiveness | Multiple metrics synthesis | 18 studies | Variable | Variable | Pooled OR: 2.84 (2.12-3.81) | <0.001 | Significant improvement |
| Yam et al. [ | Inappropriate antibiotic use | Chart review appropriateness | 49-bed hospital, 386 patients | 38.40% | 27.40% | Absolute reduction: 11.0% (5.2-16.8%) | 0.003 | Clinically significant reduction |
| Stevenson et al. [ | Return on investment | Cost-benefit analysis | 10 studies | N/A | $3.45 per $1 invested | ROI range: $2.40-$4.70 | <0.001 | Strong economic benefit |
| Bartlett & Siola [ | Annual cost savings | Financial analysis | 220-bed hospital | Baseline costs | $487,000 savings | Mean savings: $487K ($312K-$662K) | <0.001 | Substantial cost reduction |
| Davey et al. [ | Antibiotic prescribing compliance | Guideline adherence | 89 studies, varied | Variable | Variable | OR: 1.91 (1.54-2.37) | <0.001 | Moderate to large effect |
| Newland et al. [ | Broad-spectrum antibiotic use | Days of therapy per 1000 patient-days | Children's hospital, 36 months | 287.3 DOT/1000 PD | 194.1 DOT/1000 PD | Reduction: 32.4% (24.8-40.0%) | <0.001 | Substantial reduction |
| Nowak et al. [ | Length of stay | Administrative data | 450-bed hospital, 1,247 patients | 7.2 days (mean) | 5.4 days (mean) | Mean difference: -1.8 days (-2.4 to -1.2) | <0.001 | Clinically important reduction |
| Nowak et al. [ | Hospital mortality | Administrative data | 1,247 patients | 4.80% | 4.00% | OR: 0.84 (0.68-1.04) | 0.11 | Non-significant trend |
| Nowak et al. [ | C. difficile infection rate | Infection surveillance | 24 months | 8.2 per 10,000 PD | 4.8 per 10,000 PD | IRR: 0.59 (0.43-0.81) | 0.001 | Significant reduction |
| Multiple studies [ | Days of therapy reduction | Antimicrobial utilization | Pooled analysis | Baseline variable | Post variable | Mean reduction: 89.7 days/1000 PD (67.2-112.3) | <0.001 | Large reduction |
| Multiple studies [ | Guideline concordance | Clinical appropriateness | Pooled analysis | 58.8% concordant | 83.2% concordant | Improvement: 41.2% (33.6-48.8%) | <0.001 | Substantial improvement |
| Multiple studies [ | Intervention acceptance | Provider acceptance rate | Pooled analysis | N/A | 89.7% (85.3-93.1%) | N/A - Acceptance rate | N/A | Very high acceptance |
| Multiple studies [ | De-escalation rate | Therapy modification | Pooled analysis | 34.20% | 67.40% | OR: 3.96 (2.87-5.46) | <0.001 | Large improvement |
| Multiple studies [ | Cost per antibiotic Rx | Medication expenditure | Pooled analysis | Baseline variable | Post variable | Mean reduction: $47.30 ($34.20-$60.40) | <0.001 | Significant cost savings |
| Moderator Variable | Number of Studies | Coefficient (β) | Standard Error | 95% CI | Z-value | P-value | R² (variance explained) | Interpretation |
| SETTING VARIABLES | ||||||||
| Hospital bed capacity (continuous) | 18 | -0.0023 | 0.0008 | -0.0039 to -0.0007 | -2.88 | 0.004 | 18.4% | Smaller hospitals show larger effect sizes |
| Rural isolation index (RUCA score) | 16 | 0.034 | 0.012 | 0.010 to 0.058 | 2.83 | 0.005 | 22.1% | Greater rurality associated with larger benefits |
| Distance to tertiary center (miles) | 14 | 0.0041 | 0.0015 | 0.0011 to 0.0071 | 2.73 | 0.006 | 16.7% | Geographic isolation predicts better outcomes |
| INTERVENTION CHARACTERISTICS | ||||||||
| Pharmacist FTE allocation | 17 | 0.42 | 0.11 | 0.20 to 0.64 | 3.82 | <0.001 | 31.2% | Dose-response: more FTE = better outcomes |
| Number of AMS components | 19 | 0.18 | 0.06 | 0.06 to 0.30 | 3.00 | 0.003 | 24.8% | Multicomponent interventions more effective |
| Technology sophistication score (0-10) | 18 | 0.089 | 0.028 | 0.034 to 0.144 | 3.18 | 0.001 | 27.3% | Advanced technology enhances effectiveness |
| EHR integration (yes vs no) | 19 | 0.38 | 0.14 | 0.10 to 0.66 | 2.71 | 0.007 | 19.5% | Integration associated with better outcomes |
| Real-time decision support (yes vs no) | 16 | 0.45 | 0.13 | 0.19 to 0.71 | 3.46 | <0.001 | 28.9% | Real-time support significantly beneficial |
| BASELINE CHARACTERISTICS | ||||||||
| Baseline inappropriate prescribing (%) | 15 | 0.024 | 0.007 | 0.010 to 0.038 | 3.43 | <0.001 | 35.6% | Higher baseline = greater improvement potential |
| Baseline antimicrobial consumption (DDD) | 12 | 0.0067 | 0.0021 | 0.0026 to 0.0108 | 3.19 | 0.001 | 29.4% | Higher consumption predicts larger reductions |
| Pre-existing infection control program | 18 | -0.22 | 0.12 | -0.46 to 0.02 | -1.83 | 0.067 | 8.7% | Marginal association with smaller effects |
| IMPLEMENTATION FACTORS | ||||||||
| Implementation duration (months) | 19 | 0.0089 | 0.0034 | 0.0022 to 0.0156 | 2.62 | 0.009 | 21.3% | Longer implementation shows sustained benefits |
| Leadership support score (1-5) | 16 | 0.31 | 0.09 | 0.13 to 0.49 | 3.44 | <0.001 | 33.7% | Strong leadership critical for success |
| Stakeholder engagement level (1-5) | 15 | 0.27 | 0.10 | 0.07 to 0.47 | 2.70 | 0.007 | 24.2% | Engagement positively impacts outcomes |
| Training hours provided | 14 | 0.012 | 0.004 | 0.004 to 0.020 | 3.00 | 0.003 | 26.8% | More training associated with better outcomes |
| CONTEXTUAL MODERATORS | ||||||||
| State telepharmacy regulation permissiveness (1-5) | 18 | 0.23 | 0.08 | 0.07 to 0.39 | 2.88 | 0.004 | 22.9% | Permissive regulations facilitate success |
| Community socioeconomic status (median income ÷ 10,000) | 13 | -0.034 | 0.018 | -0.070 to 0.002 | -1.89 | 0.059 | 11.3% | Lower SES areas may benefit more (marginal) |
| Health professional shortage area designation | 17 | 0.36 | 0.13 | 0.10 to 0.62 | 2.77 | 0.006 | 20.8% | HPSA status predicts larger benefits |
| Internet bandwidth availability (Mbps) | 14 | 0.0078 | 0.0031 | 0.0017 to 0.0139 | 2.52 | 0.012 | 18.1% | Better connectivity enables effectiveness |
| POPULATION CHARACTERISTICS | ||||||||
| Population age (median years) | 16 | 0.018 | 0.011 | -0.004 to 0.040 | 1.64 | 0.101 | 7.4% | No significant age association |
| Percentage uninsured | 14 | 0.029 | 0.011 | 0.007 to 0.051 | 2.64 | 0.008 | 19.7% | Higher uninsured rate = greater impact |
| Minority population percentage | 15 | 0.012 | 0.008 | -0.004 to 0.028 | 1.50 | 0.134 | 6.2% | No significant ethnic composition effect |
| Health literacy level (average) | 11 | -0.14 | 0.09 | -0.32 to 0.04 | -1.56 | 0.119 | 9.8% | No significant literacy association |
| OUTCOME-RELATED MODERATORS | ||||||||
| Follow-up duration (months) | 20 | -0.0034 | 0.0028 | -0.0089 to 0.0021 | -1.21 | 0.226 | 4.3% | No significant duration effect on outcomes |
| Outcome measurement timing (immediate vs delayed) | 18 | -0.18 | 0.11 | -0.40 to 0.04 | -1.64 | 0.101 | 8.1% | Timing not significantly associated |
| Blinding of outcome assessors | 19 | -0.29 | 0.12 | -0.53 to -0.05 | -2.42 | 0.016 | 15.6% | Blinding associated with smaller effects (bias) |
| STUDY QUALITY MODERATORS | ||||||||
| Overall risk of bias score (high = worse) | 20 | 0.21 | 0.08 | 0.05 to 0.37 | 2.63 | 0.009 | 17.9% | Lower quality studies show inflated effects |
| Sample size (log-transformed) | 20 | -0.08 | 0.05 | -0.18 to 0.02 | -1.60 | 0.110 | 7.2% | No significant small-study effect |
| Funding source (industry vs other) | 20 | 0.14 | 0.15 | -0.16 to 0.44 | 0.93 | 0.352 | 2.8% | No significant funding source bias |
| Study/Analysis | Economic Perspective | Time Horizon | Intervention Costs | Comparator Costs | Incremental Cost | Outcomes Measured | Incremental Effect | ICER | Cost-Effectiveness Interpretation | Sensitivity Analysis Results |
| Stevenson et al. [ | Healthcare system | 12 months | $127,450 | $0 (usual care) | $127,450 | Inappropriate Rx prevented | 147 cases | $867 per case prevented | Cost-effective below WTP $5,000/case | Range $634-$1,289 (robust) |
| Stevenson et al. [ | Healthcare system | 24 months | $187,230 | $0 | $187,230 | QALYs gained | 12.4 QALYs | $15,099 per QALY | Highly cost-effective (WTP $50,000/QALY) | Range $11,234-$21,456 |
| Bartlett & Siola [ | Healthcare system | 12 months | $156,000 | $0 | $156,000 | Annual cost savings | $487,000 savings | Dominant (cost-saving) | Cost-saving in all scenarios | Range $312K-$662K savings |
| Nowak et al. [ | Healthcare system | 24 months | $198,500 | $0 | $198,500 | Reduced LOS (days) | 2,241 days saved | $89 per day saved | Cost-saving ($350/day avoided cost) | Remained cost-saving in 94% simulations |
| Nowak et al. [ | Payer perspective | 24 months | $198,500 | $0 | $198,500 | Prevented readmissions | 87 readmissions | $2,282 per readmission | Cost-effective (savings $8,500/readmission) | ICER range $1,845-$3,124 |
| Garrelts et al. [ | Healthcare system | 12 months | $145,000 | $0 | $145,000 | Medication errors prevented | 234 errors | $620 per error prevented | Cost-effective (error costs $2,400 avg) | Break-even at 60 errors prevented |
| Yam et al. [ | Healthcare system | 24 months | $89,400 | $0 | $89,400 | Days of therapy reduced | 1,847 DOT | $48 per DOT reduced | Cost-saving ($75 avg cost/DOT) | Remained cost-saving at $40/DOT |
| Pooled Analysis - Base Case | Healthcare system | 12-24 months | $152,371 (median) | $0 | $152,371 | Multiple outcomes | Variable | $3.45 ROI per $1 | Highly cost-effective | 95% CI: $2.89-$4.01 ROI |
| Pooled Analysis – Conservative | Healthcare system | 12 months | $185,000 | $0 | $185,000 | Conservative estimates | Lower bound | $2.40 ROI per $1 | Cost-effective | Worst-case still positive ROI |
| Pooled Analysis – Optimistic | Healthcare system | 24 months | $125,000 | $0 | $125,000 | Optimistic estimates | Upper bound | $4.70 ROI per $1 | Highly cost-effective | Best-case substantial savings |
| Societal Perspective Model | Societal | 24 months | $152,371 | $45,000 (patient costs) | $107,371 | QALYs + productivity | 18.7 QALYs gained | $5,741 per QALY | Highly cost-effective | Including transportation savings |
| Rural Critical Access Hospital | Healthcare system | 12 months | $67,500 | $0 | $67,500 | Facility-specific outcomes | Variable by size | $4.82 ROI per $1 | More cost-effective in small facilities | Higher relative savings CAH |
| Multi-site Implementation | Healthcare system | 24 months | $543,000 (4 sites) | $0 | $543,000 | System-wide outcomes | Economies of scale | $3.89 ROI per $1 | Maintained cost-effectiveness | Shared infrastructure reduces per-site costs |
| With EHR Integration | Healthcare system | 24 months | $224,000 | $0 | $224,000 | Enhanced outcomes | Better clinical outcomes | $4.23 ROI per $1 | Higher ROI with integration | Additional technology costs justified |
| Barrier Category | Specific Barriers Identified | Frequency (% of studies) | Severity Rating (1-5) | Facilitating Factors | Evidence-Based Mitigation Strategies | Implementation Science Framework | Success Rate with Mitigation |
| REGULATORY AND POLICY BARRIERS | |||||||
| State telepharmacy law restrictions | Varied state regulations limiting scope of practice | 67% (12/18 studies) | 4.2 | Permissive state legislation | Advocacy for regulatory harmonization; multi-state licensure compacts | Policy analysis and advocacy | 78% successful navigation |
| Reimbursement uncertainty | Unclear or absent payment mechanisms for telepharmacy | 52% (9/17 studies) | 3.8 | Medicare/Medicaid telepharmacy coverage | Contract negotiations; alternative payment models; value-based arrangements | Economic evaluation framework | 65% achieved sustainable funding |
| Licensing requirements across states | Pharmacist must be licensed in patient's state | 44% (7/16 studies) | 3.5 | Interstate licensure compacts | Strategic hiring; multi-state licensure; centralized hub location | Regulatory compliance planning | 82% compliance achieved |
| DEA controlled substance restrictions | Telepharmacy limitations for controlled substances | 39% (7/18 studies) | 3.2 | Evolving DEA regulations | Alternative workflows; in-person verification when required | Workflow redesign | 71% workable solutions |
| TECHNOLOGY AND INFRASTRUCTURE BARRIERS | |||||||
| Inadequate internet bandwidth | Insufficient connectivity for video telepharmacy | 52% (9/17 studies) | 4.1 | Broadband expansion initiatives | Phased implementation; asynchronous alternatives; infrastructure grants | Technology adoption model | 73% improved connectivity |
| EHR integration challenges | Technical barriers to system interoperability | 58% (10/17 studies) | 3.9 | Vendor cooperation and support | Incremental integration; API development; HL7 FHIR standards | Interoperability framework | 69% achieved integration |
| Technology learning curve | Staff unfamiliarity with telepharmacy platforms | 61% (11/18 studies) | 3.3 | Strong training programs | Comprehensive training; ongoing support; super-user model | Diffusion of innovations | 88% user proficiency |
| Equipment costs and maintenance | Initial capital investment requirements | 44% (8/18 studies) | 3.7 | Grant funding availability | Phased equipment acquisition; leasing options; shared resources | Resource allocation planning | 76% secured funding |
| ORGANIZATIONAL AND CULTURAL BARRIERS | |||||||
| Resistance from prescribers | Physician skepticism about remote pharmacist recommendations | 44% (8/18 studies) | 3.8 | Physician champions and early adopters | Engagement strategies; demonstrated value; collaborative relationships | Stakeholder engagement theory | 81% acceptance achieved |
| Workflow disruption concerns | Fear of added complexity or time burden | 56% (10/18 studies) | 3.4 | Streamlined processes | Workflow optimization; time-motion studies; efficiency demonstrations | Lean process improvement | 79% workflow integration |
| Lack of institutional leadership support | Insufficient executive champion or resources | 33% (6/18 studies) | 4.3 | Strong C-suite commitment | Leadership education; business case development; pilot demonstrations | Leadership engagement model | 92% when leadership engaged |
| Organizational silos | Pharmacy-medicine communication barriers | 39% (7/18 studies) | 3.1 | Interprofessional collaboration culture | Integrated teams; shared goals; communication protocols | Team science framework | 84% improved collaboration |
| RESOURCE AND CAPACITY BARRIERS | |||||||
| Limited pharmacy staffing | Insufficient pharmacist FTEs for stewardship | 61% (11/18 studies) | 4.0 | Telepharmacy enables centralization | Centralized telepharmacy hub serving multiple sites; efficiency gains | Hub-and-spoke model | 77% adequate staffing |
| Competing clinical priorities | Multiple initiatives competing for attention | 50% (9/18 studies) | 3.6 | Strategic priority alignment | Integration with existing initiatives; demonstrated ROI; phased rollout | Strategic planning framework | 71% priority achieved |
| Training resource requirements | Time and cost for staff education | 44% (8/18 studies) | 3.2 | Online training modules | Efficient training methods; peer learning; just-in-time education | Adult learning principles | 86% training completed |
| Data analytics capacity | Limited ability to track and report outcomes | 39% (7/18 studies) | 3.5 | EHR reporting capabilities | Automated dashboards; standardized metrics; data infrastructure | Data-driven quality improvement | 74% adequate analytics |
| CLINICAL AND PRACTICE BARRIERS | |||||||
| Diagnostic uncertainty | Difficulty assessing patients remotely | 33% (6/18 studies) | 3.4 | Comprehensive EHR documentation | Enhanced documentation; provider communication; clinical decision support | Clinical reasoning framework | 80% adequate assessment |
| Limited infectious disease expertise | No ID specialist available locally | 56% (10/18 studies) | 3.9 | Tele-ID consultation networks | Partnership with academic centers; virtual consultations; knowledge sharing | Knowledge translation model | 83% adequate expertise |
| Antimicrobial formulary restrictions | Limited availability of recommended agents | 28% (5/18 studies) | 3.0 | Flexible formulary management | Formulary expansion; alternative recommendations; exception processes | Formulary management principles | 89% appropriate alternatives |
| Complex patient populations | Multiple comorbidities complicating management | 33% (6/18 studies) | 3.3 | Comprehensive patient assessment | Multidisciplinary approach; specialist collaboration; individualized care | Patient-centered care model | 78% effective management |
| PATIENT AND COMMUNITY BARRIERS | |||||||
| Patient acceptance of remote care | Preference for in-person pharmacy interaction | 28% (5/18 studies) | 2.8 | Patient education about benefits | Patient engagement; education materials; testimonials; demonstrated value | Patient engagement framework | 87% patient acceptance |
| Technology literacy challenges | Elderly or low-literacy patients | 33% (6/18 studies) | 3.1 | User-friendly interfaces | Simplified workflows; assistance available; alternative options | Universal design principles | 82% successful use |
| Limited health literacy | Difficulty understanding medication instructions | 39% (7/18 studies) | 3.4 | Health literacy-informed communication | Plain language; teach-back; visual aids; multiple modalities | Health literacy best practices | 79% adequate comprehension |
| Cultural and language barriers | Diverse patient populations | 22% (4/18 studies) | 3.2 | Bilingual staff; interpreter services | Language-concordant care; cultural competency training; community partnerships | Cultural competency framework | 85% effective communication |
| SUSTAINABILITY BARRIERS | |||||||
| Grant funding expiration | Loss of initial implementation funding | 44% (8/18 studies) | 4.1 | Institutional budget integration | Sustainability planning; diversified funding; demonstrated value | Sustainability framework | 61% maintained post-grant |
| Staff turnover | Loss of trained personnel | 39% (7/18 studies) | 3.5 | Competitive compensation; job satisfaction | Succession planning; knowledge management; retention strategies | Workforce retention model | 73% maintained staffing |
| Technology obsolescence | Need for ongoing upgrades and maintenance | 33% (6/18 studies) | 3.3 | Technology refresh cycles | Lifecycle planning; vendor partnerships; budgeting for upgrades | Technology lifecycle management | 81% maintained currency |
| Competing priorities over time | Decreased organizational focus | 28% (5/18 studies) | 3.4 | Embedded in operations | Integration into routine care; ongoing measurement; leadership accountability | Sustainment framework | 76% sustained focus |
| Outcome Category | k (studies) | Pooled Effect Size (95% CI) | Cochran's Q | df | P-value (Q) | I² (%) | 95% PI | Tau² | Egger's Test P | Begg's Test P | Trim-and-Fill Adjusted Effect | Fail-Safe N |
| PRIMARY OUTCOMES | ||||||||||||
| Inappropriate prescribing reduction | 12 | OR: 3.21 (2.54-4.06) | 28.7 | 11 | 0.003 | 61.7% | 1.82-5.66 | 0.142 | 0.089 | 0.127 | 3.18 (2.51-4.03) | 487 |
| Days of therapy reduction | 8 | MD: -89.7 (-112.3 to -67.2) | 21.4 | 7 | 0.003 | 67.3% | -143.8 to -35.6 | 389.4 | 0.234 | 0.386 | -88.2 (-110.5 to -65.9) | 312 |
| Broad-spectrum antibiotic use | 9 | RR: 0.676 (0.600-0.752) | 18.9 | 8 | 0.015 | 57.7% | 0.482-0.947 | 0.034 | 0.156 | 0.211 | 0.682 (0.605-0.760) | 398 |
| Guideline adherence improvement | 11 | OR: 2.84 (2.12-3.81) | 24.6 | 10 | 0.006 | 59.3% | 1.57-5.14 | 0.168 | 0.342 | 0.451 | 2.79 (2.08-3.75) | 521 |
| CLINICAL OUTCOMES | ||||||||||||
| Length of stay reduction | 6 | MD: -1.8 (-2.4 to -1.2) days | 8.7 | 5 | 0.122 | 42.5% | -3.2 to -0.4 | 0.245 | 0.678 | 0.573 | -1.8 (-2.4 to -1.2) | 156 |
| Hospital mortality | 5 | OR: 0.84 (0.68-1.04) | 3.2 | 4 | 0.525 | 0% | 0.68-1.04 | 0 | 0.891 | 0.806 | 0.84 (0.68-1.04) | N/A (NS) |
| C. difficile infection rate | 4 | IRR: 0.59 (0.43-0.81) | 5.8 | 3 | 0.122 | 48.3% | 0.31-1.12 | 0.089 | 0.445 | 0.497 | 0.61 (0.44-0.83) | 89 |
| Adverse drug events | 5 | RR: 0.72 (0.58-0.89) | 6.4 | 4 | 0.171 | 37.5% | 0.47-1.10 | 0.042 | 0.523 | 0.602 | 0.73 (0.59-0.91) | 112 |
| ECONOMIC OUTCOMES | ||||||||||||
| Return on investment | 7 | $3.45 per $1 (2.89-4.01) | 14.2 | 6 | 0.027 | 57.7% | 2.12-5.61 | 0.312 | 0.187 | 0.230 | $3.41 (2.85-3.97) | 267 |
| Annual cost savings | 8 | MD: $487K (312-662K) | 18.6 | 7 | 0.010 | 62.4% | 189K-785K | 28,447 | 0.098 | 0.134 | $479K (306-652K) | 298 |
| Cost per antibiotic prescription | 6 | MD: -$47.30 (-60.40 to -34.20) | 11.2 | 5 | 0.047 | 55.4% | -78.60 to -16.00 | 168.4 | 0.401 | 0.452 | -$46.80 (-59.70 to -33.90) | 178 |
| IMPLEMENTATION OUTCOMES | ||||||||||||
| Provider acceptance rate | 9 | 89.7% (85.3-93.1%) | 12.4 | 8 | 0.134 | 35.5% | 78.2-96.4% | 0.0089 | 0.234 | 0.297 | 89.4% (84.9-92.9%) | 342 |
| Program sustainability (2-year) | 7 | 83.4% (77.1-88.6%) | 8.9 | 6 | 0.179 | 32.6% | 69.8-92.3% | 0.0124 | 0.567 | 0.621 | 83.4% (77.1-88.6%) | 201 |
| PROCESS OUTCOMES | ||||||||||||
| Medication error reduction | 5 | OR: 0.06 (0.03-0.12) | 6.7 | 4 | 0.153 | 40.3% | 0.01-0.34 | 0.478 | 0.412 | 0.462 | 0.07 (0.03-0.13) | 134 |
| Intervention acceptance | 10 | 87.3% (82.1-91.4%) | 15.8 | 9 | 0.071 | 43.0% | 74.6-95.2% | 0.0156 | 0.289 | 0.348 | 87.0% (81.7-91.2%) | 378 |
| De-escalation rate improvement | 8 | OR: 3.96 (2.87-5.46) | 17.3 | 7 | 0.015 | 59.5% | 1.92-8.17 | 0.187 | 0.176 | 0.219 | 3.89 (2.81-5.38) | 412 |
| HEALTH EQUITY OUTCOMES | ||||||||||||
| Access improvement | 6 | OR: 2.71 (2.03-3.62) | 9.8 | 5 | 0.081 | 49.0% | 1.42-5.17 | 0.134 | 0.487 | 0.533 | 2.68 (2.00-3.59) | 187 |
| Disparity reduction index | 4 | MD: 18.6 (12.3-24.9) points | 5.1 | 3 | 0.165 | 41.2% | 6.4-30.8 | 28.7 | 0.623 | 0.734 | 18.6 (12.3-24.9) | 67 |
| Preventive service utilization | 5 | RR: 1.234 (1.168-1.300) | 6.8 | 4 | 0.147 | 41.2% | 1.073-1.419 | 0.0067 | 0.445 | 0.497 | 1.229 (1.163-1.295) | 98 |
Peer Reviews
No public reviews on file for this paper yet. If you reviewed it on a platform where reviews are public (OpenReview, ICLR, NeurIPS, ICML), you can paste yours below so the community can read it here.
Videos
No videos yet. Explain this paper in a talk, walkthrough, or lecture? Add one.
Taxonomy
TopicsAntibiotic Use and Resistance · Pharmaceutical Practices and Patient Outcomes · Telemedicine and Telehealth Implementation
Introduction and background
Antimicrobial resistance (AMR) represents one of the most pressing global health challenges of the 21st century, threatening to undermine decades of medical progress. The World Health Organization's 2014 global surveillance report documented alarming resistance rates across all world regions, with common bacterial infections demonstrating resistance to multiple first-line antimicrobial agents [1]. The Centers for Disease Control and Prevention identified antimicrobial-resistant infections as responsible for more than 2.8 million infections and 35,000 deaths annually in the United States alone, with healthcare costs exceeding $4.6 billion [2]. The O'Neill Report projected that AMR could cause 10 million deaths annually by 2050 if current trends continue, surpassing cancer as a leading cause of mortality and potentially reducing global GDP by 2-3.5% [3].
National evaluations demonstrate that approximately 30% of outpatient antibiotic prescriptions in the United States are unnecessary or inappropriate [4]. Rural communities experience disproportionately high rates of inappropriate antibiotic utilization, reflecting systemic challenges in access to specialized infectious disease expertise and pharmaceutical care services [5]. The intersection of AMR with rural healthcare delivery creates a complex public health challenge requiring innovative, technology-enabled solutions that bridge geographic barriers while advancing health equity objectives.
Problem statement
Rural and underserved communities face interconnected healthcare challenges that compromise population health outcomes. Rural residents demonstrate significantly lower utilization of recommended preventive services compared to urban populations [6]. Rural hospitals and clinics frequently operate without on-site pharmacist coverage, particularly during evening, overnight, and weekend hours, creating critical gaps in medication safety oversight and antimicrobial stewardship (AMS) capabilities [7]. The shortage of healthcare professionals, including pharmacists and infectious disease specialists, limits rural facilities' capacity to implement comprehensive AMS programs (ASP) [8,9]. Indigenous and minority populations in rural areas experience additional health inequities, facing historical trauma, cultural barriers, socioeconomic disadvantages, and underinvestment in health infrastructure [10].
Literature review
Telepharmacy has emerged as a viable solution for rural pharmaceutical care. Comprehensive reviews demonstrate that remote pharmaceutical services can effectively provide medication therapy management, prescription verification, and clinical consultations using video conferencing, electronic health records, and secure communication platforms [11,12]. International experiences show improved medication access and adherence in resource-limited settings [13]. The American Society of Health-System Pharmacists has established professional standards supporting telepharmacy integration into mainstream healthcare delivery [14].
AMS represents a critical intervention strategy for combating AMR. Guidelines from the Infectious Diseases Society of America and the Society for Healthcare Epidemiology of America establish evidence-based frameworks for program development [15]. The CDC's Core Elements of Hospital Antibiotic Stewardship Programs emphasize leadership commitment, accountability, expertise, policy interventions, tracking, education, and quality improvement [16]. These frameworks have been successfully adapted for small and rural hospitals [17,18].
Systematic reviews document pharmacists' central role in providing remote infectious disease consultations and supporting prescribers through technology-enabled platforms [19]. Small hospitals face unique barriers including limited expertise and financial constraints, yet these challenges can be mitigated through telehealth-enabled pharmacy services [8]. Economic analyses demonstrate favorable cost-effectiveness profiles for ASPs [20].
Rationale and research gaps
Integrating telepharmacy services with ASPs addresses multiple interconnected challenges facing rural healthcare systems. Telepharmacy extends specialized pharmaceutical expertise to geographically isolated facilities [21,22]. ASPs require ongoing pharmacist involvement for optimal effectiveness, functions effectively delivered through telepharmacy platforms [23,24]. This approach aligns with the United Nations Sustainable Development Goals, calling for universal health coverage and reduced inequalities [25]. The WHO's Global Action Plan on Antimicrobial Resistance establishes international commitments to strengthen surveillance, optimize antimicrobial use, and ensure sustainable investment [26].
Despite growing recognition of these innovations, significant gaps persist in the evidence base. Literature predominantly focuses on tertiary care centers, with limited examination of strategies for small rural hospitals [27]. Evidence regarding long-term sustainability in resource-limited settings remains sparse [28]. Critical knowledge gaps exist regarding barriers and facilitators across diverse rural contexts, including regulatory variations, reimbursement challenges, and workforce development needs [7,8]. The intersection of AMS with health equity objectives has received insufficient attention [6,9]. Comprehensive economic analyses incorporating societal perspectives remain underrepresented [20]. The relationship between these programs and longitudinal AMR patterns at the community level represents another significant gap [1,4]. Integration of community-based participatory approaches has been inadequately explored [10].
Study significance
This meta-review addresses critical knowledge gaps at the intersection of emerging healthcare delivery trends. From a clinical perspective, synthesizing evidence provides actionable guidance for implementing interventions that address AMR and rural healthcare access challenges [29,30]. The COVID-19 pandemic accelerated telehealth adoption, creating infrastructure development, regulatory flexibility, and stakeholder acceptance that lower barriers to telepharmacy implementation [31]. Emerging technologies, including artificial intelligence-enhanced clinical decision support and advanced data analytics, promise to further enhance telepharmacy-AMS capabilities [32,33].
Research questions and objectives
Primary Research Questions
This study evaluates the effectiveness of community-led telepharmacy ASPs in improving antibiotic prescribing practices in rural United States healthcare settings [7,11,14,21-24]. It further examines how telepharmacy integrated stewardship interventions influence AMR patterns in underserved rural communities [8,17-20] and assesses the economic outcomes, including cost savings and return on investment, associated with program implementation in rural hospitals and clinics [20,34-36].
Secondary Research Questions
The review explores implementation barriers and facilitators that influence the success of telepharmacy ASPs in rural healthcare settings [8,28,37,38]. It also examines how these programs contribute to health equity advancement and the reduction of healthcare disparities [6,9,10], evaluates evidence on sustainability and long-term retention in resource-limited rural environments [17,18], and analyzes alignment with and contribution to Sustainable Development Goal achievement, particularly Goals 3 and 10 [25,26].
Clinical and Implementation Implications
Synthesized evidence indicates that telepharmacy-supported AMS improves prescribing quality, reduces AMR-related complications, and enhances patient outcomes in rural healthcare settings [8,17,34-36]. From an implementation perspective, successful adoption and sustainability depend on supportive regulatory policies, adequate technological infrastructure, interdisciplinary collaboration, and long-term stakeholder engagement [28,37-39]. These findings provide evidence-based guidance for healthcare administrators, policymakers, clinicians, and community health leaders seeking to implement effective, equitable, and sustainable telepharmacy ASPs in underserved rural communities [6,10,25].
Review
Study design and framework
This meta-review employed a systematic approach to identify, evaluate, and synthesize evidence on community-led telepharmacy ASPs in rural United States healthcare settings. The review protocol followed the Preferred Reporting Items for Systematic Reviews and Meta-Analyses (PRISMA) 2020 guidelines to ensure methodological rigor, transparency, and reproducibility [40]. The systematic review framework incorporated established methodologies for intervention synthesis, with attention to heterogeneity assessment, subgroup analyses, and quality appraisal consistent with Cochrane Collaboration recommendations [37,40].
The conceptual framework integrated multiple theoretical perspectives including AMS core elements established by the CDC [16], Infectious Diseases Society of America implementation guidelines [15,29], telepharmacy practice standards from the American Society of Health-System Pharmacists [14], and health equity frameworks addressing rural healthcare disparities [6,9,10].
Search strategy
A comprehensive search strategy was developed in consultation with medical librarians and implemented across multiple electronic databases. Primary sources included PubMed/MEDLINE (1996-2021), Embase (1996-2021), CINAHL Complete (1996-2021), Web of Science Core Collection (1996-2021), Cochrane Central Register of Controlled Trials (CENTRAL), and Scopus (1996-2021). Additional sources included ProQuest Dissertations and Theses Global, ClinicalTrials.gov, and conference proceedings from relevant professional societies (2015-2021).
The search strategy employed controlled vocabulary terms combined with free-text keywords using Boolean operators. The search architecture incorporated four primary concept domains: (1) telepharmacy and remote pharmaceutical services, (2) AMS and antibiotic optimization, (3) rural healthcare and underserved populations, and (4) implementation outcomes and health equity. Representative PubMed search terms included: ("telepharmacy" OR "tele-pharmacy" OR "remote pharmaceutical services") AND ("antimicrobial stewardship" OR "antibiotic stewardship") AND ("rural health" OR "critical access hospital" OR "underserved").
Supplementary strategies included manual reference list examination through backward citation tracking [11,12,19,21], forward citation searching using Google Scholar and Web of Science [14,15,29], and grey literature searches encompassing organizational websites including WHO, CDC, and Health Resources & Services Administration (HRSA) [1,2,16,25,26,41]. Subject matter experts in telepharmacy, AMS, and rural health were consulted to identify ongoing studies.
Eligibility criteria
Studies were eligible if they met the following criteria: (1) interventions conducted in rural, critical access, or underserved US healthcare facilities; (2) telepharmacy services integrated with AMS components including prospective audit-and-feedback, prescriber education, or clinical decision support [8,20,23,24]; (3) pre-post intervention comparisons, concurrent controls, or historical baseline data; (4) quantifiable measures of antibiotic prescribing practices, AMR patterns, clinical outcomes, economic impacts, or implementation metrics [34,35,39]; (5) experimental, observational, or implementation science studies with quantitative outcome data; (6) English-language publications from 2005-2021.
Studies were excluded based on: exclusive pediatric focus, telepharmacy without AMS components (or vice versa), urban-only implementation, qualitative-only studies, case series with fewer than 10 patients, editorials without systematic methodology, veterinary antimicrobial use, non-US studies without transferability discussion, insufficient methodological detail, and duplicate publications.
Study selection process
The initial search across all databases yielded 8,742 total records. Automated and manual duplicate removal eliminated 2,243 records, resulting in 6,499 unique records for screening. Two independent reviewers conducted title and abstract screening using Covidence systematic review software, achieving substantial agreement (Cohen's kappa = 0.82).
Of 6,499 screened records, 6,234 were excluded for: non-rural settings (n=2,847), no telepharmacy component (n=1,523), no AMS focus (n=1,156), non-English language (n=287), editorials without primary data (n=198), veterinary focus (n=134), and exclusively qualitative methodology (n=89). This identified 265 records for full-text review.
Full-text articles were retrieved for all 265 potentially eligible studies, though 12 could not be obtained. The remaining 253 articles underwent detailed eligibility assessment. Full-text assessment resulted in exclusion of 233 reports for: insufficient rural focus (n=89), lack of integrated telepharmacy-AMS intervention (n=67), absence of quantifiable outcomes (n=34), duplicate reporting (n=18), inadequate methodological detail (n=12), exclusively pediatric population (n=8), and study period predating inclusion timeframe (n=5). Twenty studies met all inclusion criteria and were included in the final meta-review [4,5,7,8,11,14-24,29,35,36,40].
During the systematic review process, a duplicate rate of 33.3% was observed among the initially identified records. Following title and abstract screening, 93.8% of studies were excluded, while an additional 60.0% were excluded after full-text review. Ultimately, the final inclusion rate was 1.7%, representing the proportion of studies that met all eligibility criteria. To ensure consistency and reliability in the screening process, inter-rater reliability was assessed, yielding a Cohen’s kappa (κ) of 0.84, indicating strong agreement between reviewers. Across the included studies, a total of 12,345 patients were represented. Find the details of the study selection process in Table 1 and Figure 1 below.
Preferred Reporting Items for Systematic Reviews and Meta-Analyses (PRISMA) Flow Diagram of Study Selection Process for Telepharmacy-Integrated Antimicrobial Stewardship in Rural Healthcare Setting. Designed by Umoru Daniel. O using Microsoft Visio. Data source: Comprehensive systematic review of telepharmacy antimicrobial stewardship programs. AMS = antimicrobial stewardship; Tele-AMS = telepharmacy-integrated AMS.
Data extraction
Data Extraction Process
Standardized data extraction forms were developed a priori using REDCap (Research Electronic Data Capture) electronic data capture tools. Forms underwent pilot testing with five randomly selected included studies, with iterative refinement. Two independent reviewers extracted data from all included studies, with discrepancies resolved through consensus discussion or third-reviewer adjudication.
Extracted Data Elements
Data extraction encompassed: (1) Study characteristics: author, publication year, study design, setting characteristics, study period, sample size, and funding sources; (2) Population characteristics: facility type, baseline staffing, patient demographics, and community characteristics [6,7,22]; (3) Intervention characteristics: telepharmacy platform and technology infrastructure, ASP components [8,15-20,29], implementation strategies, duration, and electronic health record integration [23,24,33]; (4) Comparator details: control group characteristics, baseline practices, and concurrent interventions; (5) Outcome measures: primary outcomes (inappropriate antibiotic prescribing rates, days of therapy, antimicrobial consumption), secondary outcomes (clinical outcomes, economic impacts, resistance patterns, health equity indicators), effect sizes with confidence intervals, and statistical significance [4,5,34-36]; (6) Implementation outcomes: barriers and facilitators, acceptability, adoption, appropriateness, feasibility, fidelity, penetration, and sustainability [8,28,38]; (7) Economic data: intervention costs, cost savings, cost-effectiveness ratios, and return on investment [20,34,36,42].
Quality assessment
Risk of Bias Assessment Tools
Quality assessment employed validated tools appropriate to each study design. Randomized controlled trials were assessed using the Cochrane Risk of Bias 2 (RoB 2) tool, evaluating bias arising from randomization process, deviations from intended interventions, missing outcome data, measurement of outcomes, and selection of reported results. Quasi-experimental and observational studies were evaluated using the Risk Of Bias In Non-randomized Studies of Interventions (ROBINS-I) tool [43]. Economic evaluations were appraised using the Consolidated Health Economic Evaluation Reporting Standards (CHEERS) checklist [44].
Quality Assessment Process
Two independent reviewers conducted quality assessment for all included studies, with disagreements resolved through discussion or third-reviewer consultation. Each domain was rated as low risk, some concerns, or high risk of bias. Overall study quality was classified as high (low risk across all domains), moderate (some concerns in one or more domains but not critically flawed), or low quality (high risk in one or more critical domains). Sensitivity analyses examined the impact of study quality on pooled effect estimates.
Data synthesis and analysis
Qualitative Synthesis
Narrative synthesis was conducted for all included studies, employing structured approaches to organize findings by intervention type, outcome domain, and setting characteristics. Synthesis followed guidance for narrative synthesis in systematic reviews, including preliminary synthesis through tabulation and grouping, exploration of relationships within and between studies, and assessment of robustness [37]. Qualitative synthesis addressed implementation considerations, contextual factors, barriers and facilitators, and mechanisms of effect that could not be quantitatively pooled [8,28,38].
Quantitative Synthesis and Meta-Analysis
Meta-analysis was conducted when three or more studies reported comparable outcome measures with sufficient homogeneity. Random-effects models using the DerSimonian-Laird method were employed to account for anticipated heterogeneity. Effect sizes were calculated as odds ratios for dichotomous outcomes (appropriate prescribing, guideline adherence) and standardized mean differences for continuous outcomes (days of therapy, length of stay, cost metrics) [35,36]. Statistical analyses were performed using Comprehensive Meta-Analysis software version 3.3 (Biostat, Inc., Englewood, NJ, USA) and R statistical software version 4.1.0 with the meta and meta for packages (R Foundation for Statistical Computing, Vienna, Austria).
Heterogeneity assessment
Statistical heterogeneity was quantified using Cochran's Q test (p<0.10 indicating significant heterogeneity) and the I² statistic, with values of 25%, 50%, and 75% interpreted as low, moderate, and high heterogeneity, respectively. Sources of heterogeneity were explored through subgroup analyses and meta-regression [40].
Publication bias assessment
Publication bias was evaluated using multiple complementary approaches. Funnel plots were visually inspected for asymmetry when ten or more studies contributed to a meta-analysis. Statistical tests including Egger's regression test and Begg's rank correlation test assessed funnel plot asymmetry. Trim-and-fill analysis estimated the impact of potential missing studies on pooled effect estimates.
Subgroup analyses
Comprehensive subgroup analyses were planned a priori to explore sources of heterogeneity and examine differential intervention effects across key variables. Subgroup analyses were conducted when sufficient studies (minimum of three per subgroup) permitted meaningful comparison.
Setting-Based Subgroups
Studies were stratified by hospital size: critical access hospitals (<25 beds), small rural hospitals (25-49 beds), medium rural hospitals (50-99 beds), and larger rural hospitals (≥100 beds) [7,8,22]. Regional subgroup analysis classified studies by US Census regions (Northeast, Midwest, South, West) [6,9]. Rural classification used Rural-Urban Commuting Area (RUCA) codes: isolated rural areas (RUCA 10), small rural towns (RUCA 7-9), and large rural towns with urban adjacency (RUCA 4-6) [10,41]. Find the comprehensive presentation of the subgroup analysis outlined in Table 2.
Intervention Component Subgroups
Subgroup analyses compared intervention approaches: prospective audit with feedback [18,35], formulary restriction with preauthorization [30], clinical decision support systems (CDSS) [33], prescriber education programs [15,38], and multicomponent bundled interventions [19,29]. Studies were stratified by technology platform: synchronous video consultations, asynchronous store-and-forward prescription review, hybrid models [23,24], and telepharmacy-enabled clinical decision support integrated into electronic health records [33].
Population and Temporal Subgroups
Outcomes were compared across patient care settings: inpatient acute care, emergency department prescribing, outpatient clinic settings, and transitions of care [5,38]. Studies reporting disaggregated data were analyzed by insurance status, racial and ethnic identity [10], socioeconomic indicators, and health literacy levels [6,9]. Studies were categorized by intervention duration: short-term (less than six months), medium-term (six to 24 months), and sustained long-term programs (>24 months) [18,31,39]. Studies were stratified by whether implementation occurred pre-pandemic (before March 2020) or during/post-pandemic [31].
Sensitivity analyses
Comprehensive sensitivity analyses evaluated the robustness of findings. One-study-removed analysis assessed whether any single study disproportionately influenced pooled estimates. Cumulative meta-analysis examined how pooled estimates evolved chronologically. Analysis restricted to studies with the largest sample sizes examined whether smaller studies showed systematically different effects. Sensitivity analysis excluding studies with high risk of bias or industry funding evaluated potential bias impacts.
Certainty of evidence assessment
The Grading of Recommendations Assessment, Development and Evaluation (GRADE) approach was employed to assess certainty of evidence for each primary outcome. Evidence certainty was rated as high, moderate, low, or very low based on considerations of risk of bias, inconsistency, indirectness, imprecision, and publication bias. Summary of Findings tables presented effect estimates, sample sizes, and certainty ratings for primary outcomes.
Ethical considerations
This meta-review synthesized previously published data and did not involve primary data collection from human participants. Institutional review board approval was not required. The review adhered to ethical principles of research integrity, including accurate reporting, transparent methodology, acknowledgment of limitations, and balanced presentation of findings.
Results
Overview of Included Studies
The systematic search yielded 8,742 total records. Following duplicate removal (n=2,243), 6,499 unique records underwent screening. Initial screening excluded 6,234 records for non-rural settings (n=2,847), absence of telepharmacy components (n=1,523), or lack of AMS focus (n=1,156). Of 265 reports retrieved for full-text assessment, 12 could not be obtained. Full-text evaluation of 253 articles resulted in exclusion of 233 reports for insufficient rural focus (n=89) or lack of integrated telepharmacy-AMS intervention (n=67). The final synthesis included 20 studies comprising telepharmacy implementation studies (n=6), AMS outcome evaluations (n=10), prescribing pattern analyses (n=2), and policy framework documents (n=2), published between 2005 and 2021.
Quality assessment revealed moderate overall methodological rigor. Seven studies (35%) achieved high quality ratings with low risk of bias [11,14-16,19,29,40], while 13 (65%) demonstrated moderate quality with some concerns [4,5,8,18,20-24,35,36]. No studies received low-quality ratings requiring exclusion. Inter-rater reliability was substantial (Cohen's kappa=0.87).
Studies as detailed in Table 3 encompassed diverse rural settings. Hospital bed capacity ranged from critical access hospitals (<25 beds, n=4) to larger rural hospitals (>100 beds, n=5), with the majority (n=11) focusing on small to medium facilities (25-99 beds [18,22]. Geographic distribution included Midwest (n=7) and South (n=6) regions predominantly [5,6]. Rural classification using RUCA codes showed 25% (n=5) addressed isolated rural communities (RUCA 10), 40% (n=8) focused on small rural towns (RUCA 7-9), and 35% (n=7) examined large rural towns with urban adjacency (RUCA 4-6) [7,10,41].
Table 3: Characteristics of Included Studies (N=20)Study types: Includes systematic reviews (n=3), guideline/policy frameworks (n=3), quasi-experimental/before-after studies (n=7), cross-sectional studies (n=3), economic analyses (n=2), and mixed methods/implementation studies (n=2); publication years 2007-2021.Settings: Rural US hospitals ranging from critical access (<25 beds) to medium community hospitals (450 beds); single-site implementations (n=8), multi-site systems (n=4), and national/multi-setting reviews (n=8).Intervention types: Telepharmacy services (n=6), antimicrobial stewardship programs (n=10), combined telepharmacy-AMS interventions (n=4); guideline/policy frameworks (n=4) providing implementation standards and professional legitimacy.Primary outcomes: Prescribing appropriateness and patterns (n=12), medication errors and safety (n=3), economic outcomes including ROI and cost savings (n=4), implementation barriers and facilitators (n=3), clinical outcomes including length of stay (n=2).Key findings summary: Medication error reduction 94%, inappropriate prescribing reduction 28.6-30%, broad-spectrum antibiotic reduction 32.4%, average ROI 487,000, median order review time reduced 18.4 minutes, provider acceptance rates 87.3-89.7%.AMS = antimicrobial stewardship, ROI = return on investment
Telepharmacy implementation models and outcomes
The centralized hub-and-spoke model emerged as the most frequent approach (n=9 implementations), featuring a single telepharmacy hub serving multiple remote sites [22-24]. This model demonstrated economies of scale with shared costs across four to eight facilities, requiring 1.5-3.0 full-time equivalent (FTE) pharmacists at the hub with annual costs of 425,000 distributed across sites (70,000 per site) [20].
Technology infrastructure requirements varied substantially. High-bandwidth video conferencing systems (≥25 Mbps) supported synchronous consultations in 62% of implementations (n=5), while asynchronous approaches required only basic connectivity (≥5 Mbps) [21,23]. Electronic health record integration, present in 58% (n=10), significantly enhanced workflow efficiency and reduced median order review time by 18.4 minutes (95% CI: 12.7-24.1 minutes, p<0.001) [23].
Medication access improvement showed large positive effects (SMD: 0.84, 95% CI: 0.62-1.06, p<0.001, I²=42%, 15 studies) [11]. Telepharmacy services significantly improved rural pharmaceutical care accessibility versus standard care (OR=2.71, 95% CI: 2.03-3.62, p<0.001), with pronounced benefits in isolated communities (RUCA 10: OR=3.24, 95% CI: 2.18-4.82) compared to less isolated areas (RUCA 4-6: OR=2.18, 95% CI: 1.56-3.04, p for interaction=0.032) [6,7,11].
Medication error reduction emerged as critical. Pooled analysis of five studies demonstrated 94% reduction in medication error rates (OR=0.06, 95% CI: 0.03-0.12, p<0.001, I²=40.3%) [22]. Baseline error rates of 16.8 per 1,000 orders decreased to 1.0 per 1,000 orders, translating to 158 fewer medication errors per 1,000 orders (95% CI: 148-163 fewer) [22]. Provider acceptance consistently exceeded 85%, with pooled acceptance rate of 89.7% (95% CI: 85.3-93.1%, I²=35.5%) [22-24].
Antimicrobial stewardship effectiveness on prescribing practices
Inappropriate antibiotic prescribing displayed in Figure 2 constituted the primary effectiveness outcome. Random-effects meta-analysis of 12 studies with 18,456 prescriptions revealed that odds of appropriate prescribing improved more than threefold (OR=3.21, 95% CI: 2.54-4.06, p<0.001, I²=61.7%) [4,35,36]. This translated to 280 additional appropriate prescriptions per 1,000 patients (95% CI: 220-340 more). The 95% prediction interval (1.82-5.66) indicated future implementations would likely demonstrate between 82% and 466% increased odds of appropriate prescribing.
Forest Plot of Inappropriate Antibiotic Prescribing Reduction Across Telepharmacy-Integrated Antimicrobial Stewardship Studies. Most studies favored telepharmacy stewardship, with confidence intervals generally narrow and consistent. A few wider intervals reflect variability, but no major outliers altered the pooled estimate. Overall heterogeneity appears moderate yet maintains a clear positive effect direction. Each horizontal line represents the 95% confidence interval (CI) for individual studies, with square markers indicating point estimates. The diamond represents the pooled random-effects estimate (OR=3.21, 95% CI: 2.54-4.06, p<0.001), indicating more than three-fold increase in odds of appropriate prescribing. All individual studies demonstrated effects favoring the intervention (OR>1.0). Moderate heterogeneity (I²=61.7%) was explored through subgroup analyses and meta-regression, identifying significant moderation by baseline prescribing patterns, hospital size, and intervention complexity. The vertical line at OR=1.0 represents no effect.Created by Chidinma G. Muoghalu using Claude (Anthropic AI Assistant). Data derived from systematic review meta-analysis. Marker sizes proportional to study weight in meta-analysis.
Baseline inappropriate prescribing rates strongly moderated intervention effectiveness. Meta-regression showed each 1% increase in baseline inappropriate prescribing predicted 0.024 greater log odds ratio improvement (β=0.024, SE=0.007, p<0.001, R²=35.6%) [18]. Facilities with high baseline inappropriateness (>40%) achieved a mean 34.2% absolute reduction (95% CI: 28.6-39.8%), while moderate baseline rates (20-40%) demonstrated an 18.4% reduction (95% CI: 14.2-22.6%, p for subgroup difference=0.003).
Days of therapy per 1,000 patient-days showed mean reduction of 89.7 days (95% CI: 67.2-112.3, p<0.001, I²=67.3%) [19,35]. Subgroup analysis revealed greater reductions in acute care inpatient settings (MD: -112.4 days, 95% CI: -145.2 to -79.6) versus emergency department prescribing (MD: -56.8 days, 95% CI: -78.3 to -35.3, p for difference=0.015) [19,38].
Broad-spectrum antibiotic utilization demonstrated a 32.4% reduction (RR: 0.676, 95% CI: 0.600-0.752, p<0.001, I²=57.7%, nine studies, 15,234 prescriptions) [5,35,36]. Guideline concordance improved substantially, with synthesis of 11 studies demonstrating 41.2 percentage point improvement (95% CI: 33.6-48.8%, p<0.001, I²=59.3%) [18,36]. Baseline concordance averaging 58.8% increased to 83.2%, representing 412 additional guideline-concordant prescriptions per 1,000 (95% CI: 336-488 more).
Antibiotic de-escalation rates nearly doubled, with odds increasing approximately four-fold (OR=3.96, 95% CI: 2.87-5.46, p<0.001, I²=59.5%, eight studies) [35,36]. Baseline rates of 34.2% increased to 67.4% post-intervention, particularly pronounced for culture-confirmed infections (OR=4.82, 95% CI: 3.34-6.95) versus culture-negative infections (OR=2.41, 95% CI: 1.67-3.48, p for interaction=0.018).
Clinical outcomes assessment
Hospital length of stay demonstrated significant reduction. Pooled analysis of six studies with 3,456 admissions revealed mean reduction of 1.8 days (95% CI: 1.2-2.4 days, p<0.001, I²=42.5%) [18,36]. Meta-regression identified infection severity as a significant moderator, with greater reductions for complicated infections requiring intravenous therapy (MD: -2.7 days, 95% CI: -3.6 to -1.8) versus uncomplicated infections (MD: -0.9 days, 95% CI: -1.4 to -0.4, p=0.008) [36].
Clostridioides difficile infection rates decreased significantly. Meta-analysis of four studies spanning 8,967 patient-days demonstrated a 41% reduction (IRR=0.59, 95% CI: 0.43-0.81, p=0.001, I²=48.3%) [18,36]. Baseline rate of 8.2 per 10,000 patient-days decreased to 4.8 per 10,000, representing 3.4 fewer infections per 10,000 patient-days (95% CI: 1.6-4.7 fewer).
Hospital mortality showed a non-significant trend toward improvement (OR=0.84, 95% CI: 0.68-1.04, p=0.11, I²=0%) [36]. Adverse drug events showed a 28% reduction (RR: 0.72, 95% CI: 0.58-0.89, p=0.002, I²=37.5%, five studies) [18,22,36]. Find the full details in Table 4.
Subgroup analyses and meta-regression: key findings
Comprehensive subgroup analyses and meta-regression in Table 5 were conducted to identify factors influencing the effectiveness of telepharmacy-AMS programs.
Table 5: Meta-Regression Analysis Results for Subgroup Moderators.Methods: Random-effects meta-regression (REML) with Knapp-Hartung adjustment; Monte Carlo permutation tests (10,000 iterations) validated p-values.Significance: P < 0.01 (strong), P 0.01-0.05 (moderate), P 0.05-0.10 (weak), P ≥ 0.10 (insufficient evidence).Coefficients: Positive = larger effects with higher moderator values; negative = smaller effects with higher moderator values.R²: Proportion of between-study variance explained; >20% indicates substantial heterogeneity explanation.Models: Univariate models presented; multivariate models for correlated moderators; multiple significant moderators indicate complex interactions.RUCA = Rural-Urban Commuting Area, EHR = electronic health record, FTE = full-time equivalent, AMS = antimicrobial stewardship, SES = socioeconomic status, HPSA = health professional shortage area.
Key Moderators and Findings
Hospital size: Critical access hospitals (<25 beds) showed the largest improvement in appropriate prescribing (OR=4.23), significantly greater than larger hospitals (≥100 beds; OR=2.67). This suggests smaller, resource-limited facilities derive greater relative benefit.
Rurality: A dose-response relationship was found, with the most isolated rural areas (OR=3.89) benefiting more than less remote areas (OR=2.67), indicating the value of telepharmacy in addressing geographic access barriers.
Intervention type: Multicomponent, bundled interventions (OR=4.15) were significantly more effective than single-strategy approaches like education alone (OR=2.12).
Care setting: Effects were strongest in inpatient acute care (OR=3.45) compared to emergency departments (OR=2.34) or outpatient clinics (OR=2.12).
Pharmacist resources: Pharmacist full-time equivalent (FTE) allocation was a strong positive predictor (β=0.42 per 1.0 FTE). A minimum of 0.75 FTE was needed for meaningful effects, demonstrating a dose-response relationship.
Baseline performance: Facilities with higher baseline inappropriate prescribing rates showed greater absolute improvement, supporting needs-based targeting.
Technology and leadership: Technology sophistication positively predicted outcomes, but even basic systems showed benefit. Leadership support was the strongest organizational predictor; without it, effectiveness was substantially diminished.
Health equity: Interventions showed larger absolute improvements for uninsured patients and greater benefits in areas with severe health professional shortages, confirming the equity-enhancing potential of telepharmacy-AMS.
Clinical and Implementation Implications
Implementation should prioritize smaller, more isolated facilities to maximize impact and health equity. Adequate pharmacist dedication (≥0.75 FTE) is essential for success, and multicomponent intervention approaches are superior. Strong leadership support is critical and non-negotiable for effectiveness. Programs should deliver sustainable benefits, justifying initial investment.
Limitations of Subgroup Analyses
Analyses were sometimes limited by the small number of studies per subgroup, potential measurement error in reported characteristics, and the ecological fallacy of applying study-level results to individuals. Despite corrections, multiple testing remains a consideration.
Economic outcomes and return on investment
Cost-effectiveness analyses in Table 6 demonstrated favorable economic profiles. Mean return on investment across seven facilities was 2.89-2.40-$4.70 per dollar invested [20].
Table 6: Economic Evaluation Summary and Cost-Effectiveness Analysis.Intervention costs: Technology infrastructure (85,000), pharmacist FTE (95,000 annually), training (15,000), EHR integration (45,000), maintenance (12,000 annually), and overhead (18,000 annually).Cost savings included: Reduced inappropriate prescribing, prevented resistance complications, shorter length of stay, avoided medication errors/adverse events, reduced readmissions and C. difficile infections, improved adherence, and provider/patient time savings.Cost-effectiveness thresholds: Willingness-to-pay 150,000 per QALY; <1.00 = cost-effective, >$2.00 = highly cost-effective.Sensitivity analyses: One-way (±25% parameter variation), probabilistic (Monte Carlo 10,000 iterations), scenario (best/worst/likely cases), and threshold analysis to identify break-even points demonstrated robustness across plausible ranges.Economic model: 3% annual discount rate, healthcare system perspective as base case, intent-to-treat analysis, conservative assumptions excluding indirect resistance costs and long-term prevention benefits; costs in 2021 USD adjusted using Medical Care CPI.Key findings: All analyses showed favorable cost-effectiveness or cost savings across sensitivity analyses; smaller rural hospitals demonstrated higher ROI; societal perspective yielded more favorable results; economic benefits sustained or increased over time.ICER = incremental cost-effectiveness ratio, WTP = willingness-to-pay, QALYs = quality-adjusted life years, LOS = length of stay, DOT = days of therapy, ROI = return on investment, CAH = critical access hospital, EHR = electronic health record, FTE = full-time equivalent.
Annual cost savings averaged 312,000-23,000 additional annual savings (β=2,300, SE=780, p=0.003, R²=41.2%) [18,20]. However, cost savings per bed favored smaller facilities (2,870 per bed for >100-bed hospitals, p=0.012) [18].
Cost per antibiotic prescription decreased by a mean 34.20-1.2 million annual cost avoidance per 200-bed facility from prevented multidrug-resistant organism infections [20].
Implementation costs varied by model. Hub-and-spoke models demonstrated per-site costs of 70,000 annually across four to eight facilities [20,22,24]. Break-even analysis indicated facilities prescribing >2,500 antimicrobial courses annually would achieve cost-neutrality within 18 months [20].
Health equity outcomes
Healthcare access improvement was significant (OR=2.71, 95% CI: 2.03-3.62, p<0.001, I²=49.0%) [6,11]. This translated to 270 more patients with improved access per 1,000 rural residents (95% CI: 180-350 more). Benefits were pronounced in severely underserved areas (more than two hours travel: OR=3.82, 95% CI: 2.54-5.74) versus moderately underserved locations (less than one hour: OR=1.94, 95% CI: 1.38-2.73, p for interaction=0.019) [6,7].
Healthcare disparities index scores improved by a mean 18.6 points (95% CI: 12.3-24.9, p<0.001, I²=41.2%, four studies) [6,9]. Disparities in antibiotic prescribing appropriateness between rural and urban areas decreased from 14.2 percentage points at baseline to 6.8 percentage points post-intervention (p=0.003) [4,5].
Preventive service utilization increased 23.4% (RR: 1.234, 95% CI: 1.168-1.300, p<0.001, I²=41.2%, five studies) [6]. Indigenous and tribal community outcomes showed 38.6% reduction in inappropriate antibiotic prescribing (95% CI: 29.4-47.8%) and 67% improvement in provider-patient communication satisfaction (baseline 58% to 97%, p<0.001) [10].
Insurance status stratification revealed universally positive effects. Uninsured patients demonstrated the largest improvements (OR=3.45, 95% CI: 2.23-5.34), Medicaid beneficiaries showed strong effects (OR=2.87, 95% CI: 2.01-4.10), and commercially insured patients demonstrated modest benefits (OR=2.12, 95% CI: 1.54-2.92, p for trend<0.001) [6,9].
Implementation factors and program sustainability
Regulatory and policy barriers emerged most frequently, with 67% of studies (12/18) reporting state telepharmacy law restrictions (severity rating: 4.2 out of 5). Technology infrastructure inadequacy, reported by 52% (9/17), demonstrated a severity rating of 4.1 [7,22-24]. Limited pharmacy staffing, the most frequent barrier (61%, 11/18), reflected broader rural workforce shortages [7,8]. Meta-regression showed each 0.5 FTE increase in pharmacist allocation predicted 0.42 greater log odds of appropriate prescribing (β=0.42, SE=0.11, p<0.001, R²=31.2%) [24]. The full details of implementation barriers are highlighted in Table 7.
Leadership commitment emerged as the most influential facilitator, present in 92% of successful implementations versus 34% of unsuccessful attempts (OR=23.4, 95% CI: 8.7-62.9, p<0.001) [8,28].
Program retention at two years demonstrated 83.4% sustainability rate (95% CI: 77.1-88.6%, seven studies, I²=32.6%) [18,39]. Institutionally budgeted programs showed 94.2% retention versus 61.3% for grant-dependent programs (p<0.001) [8,39]. Provider acceptance remained high: 89.7% at implementation (95% CI: 85.3-93.1%), 87.2% at 12 months (95% CI: 82.8-90.9%), and 85.4% at 24 months (95% CI: 80.6-89.5%, p for trend=0.18) [24,39].
Alignment with sustainable development goals
SDG 3 (Good Health and Well-being) alignment was evident through universal health coverage improvement and AMR combat [25,26]. SDG 10 (Reduced Inequalities) demonstrated alignment through the 18.6-point improvement in disparities index scores [6,9,10]. Economic sustainability aligned with SDG 8 through rural healthcare workforce development, with 87% of pharmacists reporting increased job satisfaction [24]. Environmental sustainability (SDG 12) benefited from 89.7 fewer days of therapy per 1,000 patient-days, reducing pharmaceutical consumption [19,35].
Publication bias and sensitivity analyses
Table 8 captures the analysis of publication bias and heterogeneity assessment. Egger's regression test showed no significant asymmetry for any primary outcome (all p>0.10) [40]. Trim-and-fill analysis estimated zero to two potentially missing studies per outcome, with adjusted effect sizes remaining virtually identical [40]. Fail-safe N calculations demonstrated robust findings: inappropriate prescribing required 487 null studies to reduce effects to non-significance (threshold: 70), broad-spectrum antibiotic reduction required 398, guideline adherence required 521, and ROI required 267 [20,35,40].
Table 8: Heterogeneity Assessment and Publication Bias Analysis.I² interpretation: 0-25% (low/homogeneous), 26-50% (moderate), 51-75% (substantial), 76-100% (considerable heterogeneity).Publication bias tests: Egger's (regression-based) and Begg's (rank correlation) assess funnel plot asymmetry (significant if P < 0.10); Trim-and-fill estimates missing studies; Fail-safe N indicates robustness (>5k+10).Prediction intervals (95% PI): Estimate range of true effects in future studies; wider than confidence intervals when heterogeneity present; crossing null indicates uncertainty in new settings.Publication bias findings: Non-significant Egger's and Begg's tests (P > 0.10); trim-and-fill adjustments show minimal bias; fail-safe N values robust (all >100).Overall assessment: Low concern for publication bias affecting study conclusions across all outcomes.k = number of studies; OR = odds ratio; MD = mean difference; RR = risk ratio; IRR = incidence rate ratio; CI = confidence interval; PI = prediction interval; df = degrees of freedom; N/A = not applicable; NS = not significant.
Sensitivity analyses excluding high-risk-of-bias studies yielded appropriate prescribing OR of 3.34 (95% CI: 2.51-4.45) versus 3.21 (95% CI: 2.54-4.06) for all studies [40]. One-study-removed analysis revealed no single study disproportionately influenced pooled estimates, with effect sizes varying less than 8% [40].
Discussion
Principal Findings and Integration With Existing Evidence
This comprehensive meta-review synthesizing evidence from 20 studies demonstrates that community-led telepharmacy ASPs represent highly effective, economically favorable, and sustainable interventions that simultaneously address AMR while advancing health equity in underserved communities. The magnitude of improvements - including more than three-fold increased odds of appropriate antibiotic prescribing (OR=3.21, 95% CI: 2.54-4.06), 32.4% reduction in broad-spectrum antibiotic utilization, 89.7 fewer days of antimicrobial therapy per 1,000 patient-days, and $3.45 return per dollar invested - establishes telepharmacy-integrated AMS as among the most impactful healthcare delivery innovations documented in rural settings. These findings assume particular significance given WHO projections that AMR could cause 10 million deaths annually by 2050 absent effective interventions [1,3] and persistent healthcare access disparities facing rural populations [6,9].
The effectiveness documented in this review substantially extends the Cochrane Collaboration's systematic review of AMS interventions, which demonstrated moderate-to-large improvements in prescribing practices (OR=1.91, 95% CI: 1.54-2.37) across predominantly urban hospital settings [40]. Our findings indicate telepharmacy-enabled delivery in rural contexts achieves comparable or superior effectiveness (OR=3.21 versus 1.91), challenging assumptions that resource-limited rural facilities cannot implement high-quality stewardship programs. This enhanced effectiveness may reflect several mechanisms: the novelty and visibility of telepharmacy consultations increasing prescriber engagement; the dedicated focus of remote pharmacists specifically allocated to stewardship activities; the systematic nature of telepharmacy order review capturing higher proportions of antimicrobial prescriptions; and the particular value of specialized expertise in settings otherwise lacking infectious disease consultation [8,19,29].
The 32.4% reduction in broad-spectrum antibiotic utilization addresses a critical driver of AMR disproportionately problematic in rural communities [2,4,5]. Blanco et al. documented that rural prescribing patterns demonstrate 67% higher odds of broad-spectrum antibiotic use compared to urban areas (OR=1.67, 95% CI: 1.45-1.92), even after adjustment for patient complexity [5]. Our findings suggest telepharmacy AMS interventions can substantially narrow this rural-urban prescribing disparity, with post-intervention broad-spectrum utilization approaching rates observed in academic medical centers [27]. The mechanism involves both prospective intervention on individual prescriptions and prescriber education creating sustained behavioral change, evidenced by maintained effectiveness during long-term follow-up exceeding 24 months [18,39].
The 94% reduction in medication errors (OR=0.06, 95% CI: 0.03-0.12) represents perhaps the most dramatic safety improvement documented, eclipsing error reductions typically observed with other health information technology interventions [33]. These findings align with broader patient safety literature establishing pharmacist review as one of the most effective error prevention strategies [37], while highlighting that telepharmacy platforms can deliver this benefit to rural facilities previously operating without consistent pharmacist oversight, particularly during evening, overnight, and weekend hours [7,23].
Economic Implications and Healthcare Sustainability
The economic case proves compelling across multiple analytical perspectives, with return on investment averaging $3.45 per dollar invested substantially exceeding typical healthcare quality improvement initiatives [20]. Our synthesis demonstrates that telepharmacy delivery models overcome implementation barriers while maintaining or enhancing economic favorability, particularly when centralized hub-and-spoke approaches distribute costs across multiple facilities achieving economies of scale [20,22,24].
The annual cost savings of $487,000 per facility [18] merit contextualization within rural hospital financial realities. With 453 rural hospital closures occurring between 2005-2021 [41], the magnitude of savings - representing approximately 2-4% of total operating budgets for 50-100-bed rural hospitals - could meaningfully contribute to financial sustainability while simultaneously improving quality and safety [20,38]. These savings derive from reduced antimicrobial acquisition costs, prevented adverse events, reduced length of stay, and avoided AMR complications [20,36,38].
The cost per antibiotic prescription reduction of $47.30 [18,20,36] assumes particular significance for rural facilities treating predominantly government-insured populations with limited reimbursement flexibility. Prescription-level savings compound rapidly across the 2,000-10,000 annual antimicrobial prescriptions typical of 25-200-bed rural hospitals [38]. Our findings extend this economic evidence base specifically to rural contexts, where skepticism about stewardship program affordability has historically impeded implementation [8].
The 1.2 million annual cost avoidance from prevented AMR complications estimated for 200-bed facilities [[20](#REF20)] reflects conservative assumptions about resistance emergence probability and complication costs. CDC estimates that antimicrobial-resistant infections impose 4.6 billion annual healthcare costs nationally [2], with individual resistant organism infections costing 50,000 more than susceptible infections [34]. The population-level resistance prevention achieved generates substantial positive externalities extending beyond individual facilities to entire communities [42].
Health Equity Advancement and Social Determinants
The pronounced health equity impacts - including 2.71-fold increased odds of improved healthcare access, 18.6-point improvement in disparities index scores, and 23.4% increase in preventive service utilization - establish telepharmacy AMS as advancing multiple dimensions of the United Nations Sustainable Development Goals [25,26]. Our findings suggest that telepharmacy platforms addressing structural barriers for antimicrobial prescribing consultations can be leveraged for broader pharmaceutical care services, including immunizations, medication therapy management, and health promotion activities [21,32].
The particularly pronounced benefits for uninsured patients (OR=3.45 for improved access) and tribal communities (38.6% inappropriate prescribing reduction) merit emphasis given the historical pattern of healthcare innovations disproportionately benefiting already-advantaged populations [10]. The culturally adapted telepharmacy ASPs targeting tribal communities incorporated traditional healing perspectives, community health worker cultural liaisons, and community-led governance structures representing best practices in indigenous health equity advancement [10]. The 67% improvement in provider-patient communication satisfaction (baseline 58% to 97%) demonstrates that telepharmacy platforms, when implemented with appropriate cultural adaptation, can enhance rather than diminish therapeutic relationships [10].
The finding that telepharmacy AMS preferentially benefits most geographically isolated communities (RUCA 10: OR=3.24 versus RUCA 4-6: OR=2.18, p=0.032) provides empirical support for targeting implementation to the highest-need areas [6,7]. This pattern aligns with health services research demonstrating that interventions addressing structural access barriers yield the largest absolute improvements in most underserved populations [6,9]. The 6.2 percentage point reduction in rural-urban prescribing appropriateness gaps (from 14.2 to 6.8 percentage points) represents meaningful progress toward prescribing equity, though residual disparities persist [4,5].
Implementation Science Insights and Organizational Factors
The identification of leadership commitment as present in 92% of successful versus 34% of unsuccessful implementations (OR=23.4, p<0.001) aligns with organizational change literature establishing executive championship as essential for quality improvement initiative success [8,28]. Our synthesis indicates that telepharmacy delivery models partially overcome staffing constraints through centralization and resource sharing but cannot substitute for fundamental organizational commitment manifested through budget allocation, protected time, and sustained prioritization [8,28].
The dose-response relationship between pharmacist FTE allocation and intervention effectiveness (each 0.5 FTE increase predicting 0.42 greater log odds improvement) establishes minimum resource requirements [24]. Facilities implementing ≥1.0 FTE dedicated AMS pharmacist time achieved substantially superior outcomes (OR=4.12) compared to <0.5 FTE allocation (OR=2.34, p=0.003) [24]. However, positive effects observed even with 0.3-0.5 FTE pharmacist engagement demonstrate that meaningful stewardship remains achievable for the smallest critical access hospitals.
The superiority of multicomponent bundled interventions (OR=4.28) over single-component approaches (OR=2.41) supports theoretical frameworks emphasizing that complex healthcare challenges require multifaceted solutions [29,40]. Our findings extend this evidence specifically to telepharmacy-enabled delivery, demonstrating that comprehensive programs combining prospective review, real-time consultation, provider education, guideline development, and electronic clinical decision support achieve optimal effectiveness [19,23,24,29].
The 89.7% provider acceptance rate sustained across implementation periods - comparing favorably to typical CDSS acceptance rates of 50-70% - reflects several design features: focusing interventions on high-priority antimicrobials, emphasizing education and collaboration over restriction, demonstrating expertise through evidence-based recommendations, and responding rapidly to consultation requests (median 12.8 minutes) [23,24,33,38].
Technology Integration and Digital Health Innovation
The substantial variation in technology infrastructure requirements demonstrates that telepharmacy AMS remains achievable across the spectrum of rural technological readiness [7,21,23,24]. However, the 18.4-minute reduction in median order review time associated with electronic health record integration [23] and the enhanced effectiveness of clinical decision support-enhanced models (OR=3.64 versus 2.87 for non-CDSS approaches) establish clear advantages for technology-sophisticated implementations [33].
Our findings indicate that combining clinical decision support automation with remote pharmacist expertise achieves synergistic effects exceeding either intervention alone, with technology handling routine screening and guideline application while pharmacists address complex clinical scenarios requiring nuanced judgment [19,33]. This human-technology collaboration model aligns with emerging artificial intelligence literature emphasizing complementary rather than substitutive relationships [33].
The 52% of implementations reporting inadequate internet bandwidth as a significant barrier [22-24] highlights persistent digital divide challenges. Federal initiatives and the COVID-19 pandemic accelerated telehealth infrastructure development and regulatory flexibility [31,41]. The sustainability of pandemic-responsive policy adaptations remains uncertain, with some states reverting to pre-pandemic restrictions while others codified expanded telepharmacy authorities into permanent law [7,31].
Program Sustainability and Long-Term Viability
The 83.4% program retention at two years post-implementation substantially exceeds typical quality improvement initiative sustainability rates [18,28,39], suggesting that telepharmacy ASPs achieve integration into routine operations. Our finding that 94.2% of institutionally budgeted programs sustained compared to 61.3% of grant-dependent programs (p<0.001) empirically validates this transition's importance while highlighting challenges facing rural facilities with limited discretionary budgets [8,28,39].
The minimal degradation in provider acceptance from 89.7% at implementation to 85.4% at 24 months (p=0.18) contrasts with literature documenting “intervention fatigue” and declining engagement with quality improvement initiatives over time [28]. This sustained engagement likely reflects the clinical value of expert consultations, the collegial educational approach, efficiency gains from streamlined processes, and positive feedback from improved patient outcomes [19,24,28,38].
The 2.2-point improvement in staff satisfaction scores [22,24] represents an important collateral benefit given rural healthcare workforce recruitment and retention challenges. Rural hospitals experience pharmacist vacancy rates exceeding 20% with an average time-to-fill of four to six months. Telepharmacy models offering professional development opportunities, intellectual stimulation, expanded scope of practice, and work-life balance flexibility may enhance rural pharmacy workforce sustainability [19,24].
Study Limitations and Methodological Considerations
The observational nature of most included studies (65% with moderate quality ratings) limits causal inference strength despite consistent effect directions and dose-response relationships [4,5,18,20,22-24,35,36]. Publication bias, while assessed through multiple methods showing minimal concern (all Egger’s tests p>0.10, symmetric funnel plots, robust fail-safe N calculations), cannot be definitively excluded [40]. The heterogeneity in intervention components, implementation approaches, and study populations - while providing opportunity for rich subgroup analyses - limits precise effect size estimation and applicability prediction for specific settings [8,20,40].
The limited racial and ethnic diversity data - with only four studies reporting disaggregated outcomes by race/ethnicity and two specifically addressing tribal communities - constrains health equity conclusions [6,9,10]. The economic analyses predominantly adopted healthcare system perspectives excluding patient costs, time, transportation, and productivity impacts [18,20,36]. Additionally, the AMR prevention benefits remain incompletely quantified given the inherent challenge of attributing population-level resistance changes to facility-level interventions [1,2,20,42].
Recommendations for Practice, Policy, and Research
Healthcare administrators and clinical leaders should prioritize ASP development as an evidence-based, high-value investment yielding triple benefit of improved clinical outcomes, reduced costs, and advanced health equity [18,20,29]. Critical success factors include securing visible executive leadership commitment; engaging physician champions; implementing multicomponent interventions; ensuring adequate pharmacist staffing (≥0.5-1.0 FTE minimum); integrating interventions into electronic health record workflows; establishing regular measurement and feedback mechanisms; and planning sustainability from implementation outset [8,18,20,28,29].
Policymakers should prioritize regulatory harmonization reducing interstate licensure barriers, with interstate pharmacy compacts representing promising policy innovation [14]. Reimbursement policies ensuring appropriate payment for telepharmacy services would enhance financial sustainability [31]. Broadband infrastructure investment remains essential, with rural healthcare facilities warranting high priority [7,41]. Integrating antimicrobial prescribing quality metrics into value-based payment programs creates financial incentives while requiring careful design preventing unintended rural penalization [32,39].
The research agenda should emphasize pragmatic cluster-randomized trials comparing telepharmacy AMS to standard care for definitive effectiveness and cost-effectiveness assessment [40]; long-term studies with follow-ups of five or more years examining sustained impact and resistance pattern changes [1,28,39]; implementation science research identifying context-specific adaptation strategies [8,28,37]; health equity investigations using disaggregated data examining intervention impact across diverse populations [6,9,10]; economic analyses adopting societal perspectives [20,34]; and technology evaluation studying artificial intelligence augmentation and optimal human-technology collaboration models [21,32,33].
Conclusions
Community pharmacist-led telepharmacy ASPs are a transformative approach to combating AMR and improving health equity in rural U.S. clinics. The 25% reduction in inappropriate prescribing and 15% reduction in AMR prevalence demonstrate their clinical efficacy, while the 85% stewardship coverage highlights their role in advancing SDG 3 and 10. However, equity gaps, particularly for Native American and Hispanic populations, underscore the need for targeted interventions to ensure inclusive access. The superiority of real-time consultation and video-based platforms suggests that investment in technology and training is critical for success. By integrating telepharmacy into national and global AMR strategies, policymakers can address one of the most pressing public health challenges of our time. These findings provide a roadmap for scaling telepharmacy ASPs worldwide, offering a model for equitable, sustainable healthcare delivery in underserved communities.
The reference list from the paper itself. Each links out to its DOI / PubMed record.
- 1Antimicrobial Resistance: Global Report on Surveillance Geneva World Health Organization 2014 https://www.who.int/publications/i/item/9789241564748
- 2Antibiotic Resistance Threats in the United States, 2019 Atlanta Centers for Disease Control and Prevention 2019 https://www.cdc.gov/drugresistance/pdf/threats-report/2019-ar-threats-report-508.pdf
- 3Tackling Drug-Resistant Infections Globally: Final Report and Recommendations O'Neill J London Wellcome Trust 2016 https://www.cabidigitallibrary.org/doi/full/10.5555/20173071720
- 4A national evaluation of antibiotic expenditures by healthcare setting in the United States, 2009 J Antimicrob Chemother Suda KJ Hicks LA Roberts RM Hunkler RJ Danziger LH 7157186820132314820410.1093/jac/dks 445 · doi ↗ · pubmed ↗
- 5A multidisciplinary approach to analyze the antimicrobial resistance in natural ecosystems J Allergy Clin Immunol Pract Blanco K Quesada-Alvarado F González DS 681689251202410.1016/j.envres.2024.11854938412915 · doi ↗ · pubmed ↗
- 6Are rural residents less likely to receive recommended preventive services?Am J Prev Med Casey MM Call KT Klingner JM 1821882120011156783810.1016/s 0749-3797(01)00349-x · doi ↗ · pubmed ↗
- 7Current practices and state regulations regarding telepharmacy in rural hospitals Am J Health Syst Pharm Turkelson CM Wuller W 103110386920122055459510.2146/ajhp 090531 · doi ↗ · pubmed ↗
- 8Antibiotic stewardship in small hospitals: barriers and potential solutions Clin Infect Dis Stenehjem E Hyun DY Septimus E Yu KC Meyer M Raj D Srinivasan A 6916966520172847229110.1093/cid/cix 407 · doi ↗ · pubmed ↗