GC-MS based bioactive profiling of Phyllanthus niruri and its antibacterial potential through experimental and computational studies
Zubair Khalid Labu, Samira Karim, Maria Afroz, Umme Kulsum Batul, Lina Akther, Md. Tarekur Rahman, Sarder Arifuzzaman

TL;DR
This study shows that Phyllanthus niruri contains antibacterial compounds that could be used to develop new natural antimicrobial drugs.
Contribution
The study combines experimental and computational methods to validate the antibacterial potential of Phyllanthus niruri compounds.
Findings
Methanol and ethyl acetate fractions showed the strongest antibacterial activity against E. coli and S. aureus.
GC–MS identified 75 compounds, including several with high binding affinities to bacterial target proteins.
Molecular docking and ADMET analysis confirmed the compounds' drug-like properties and bactericidal potential.
Abstract
The study aimed to evaluate the antibacterial potential of Phyllanthus niruri by identifying its bioactive compounds through GC–MS, assessing their in vitro antibacterial efficacy, and validating their interactions with bacterial target proteins through molecular docking and pharmacokinetic analyses. Methanolic extracts were prepared and fractionated into petroleum ether (PSF), chloroform (CSF), carbon tetrachloride (CTF), ethyl acetate (ESF), methanol (MSF), and aqueous (AQF) fractions using the Kupchan method. Phytochemical screening, total phenolic content (TPC), and total flavonoid content (TFC) were determined spectrophotometrically. GC–MS analysis identified volatile constituents in the methanol extract. Antibacterial activity was evaluated against nine bacterial strains using the disc diffusion assay, Minimum Inhibitory Concentration (MIC), and Minimum Bactericidal Concentration…
Genes, proteins, chemicals, diseases, species, mutations and cell lines named across the full text — each resolved to its canonical identifier and authoritative record.
Click any figure to enlarge with its caption.
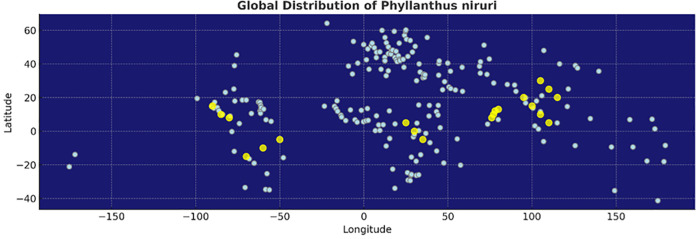 Fig 1
Fig 1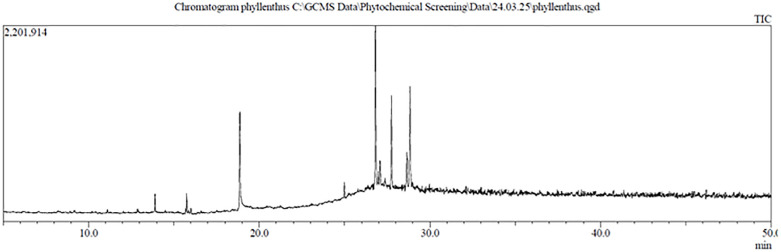 Fig 2
Fig 2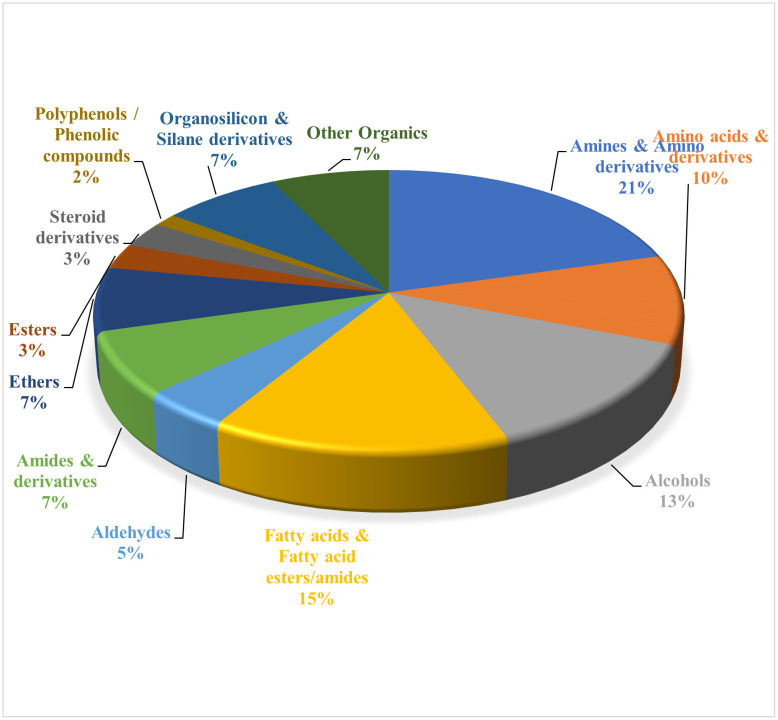 Fig 3
Fig 3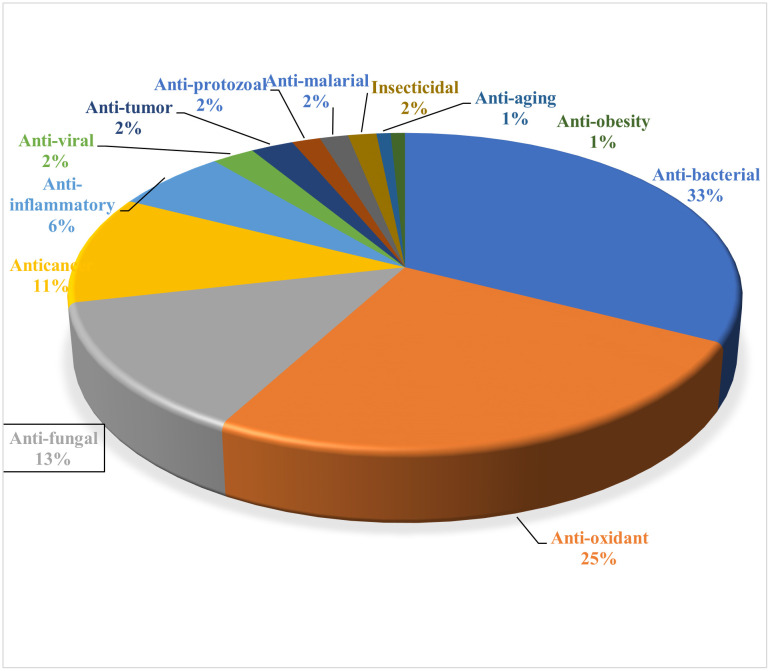 Fig 4
Fig 4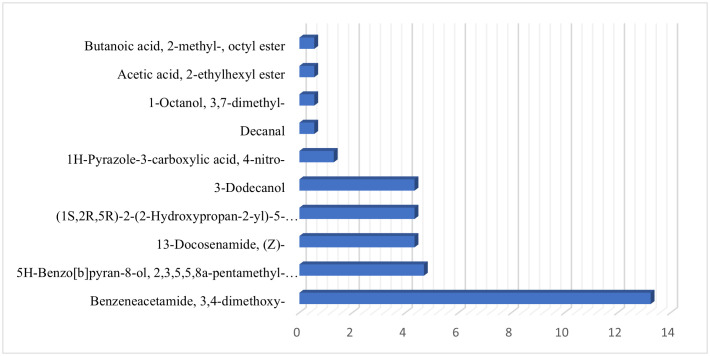 Fig 5
Fig 5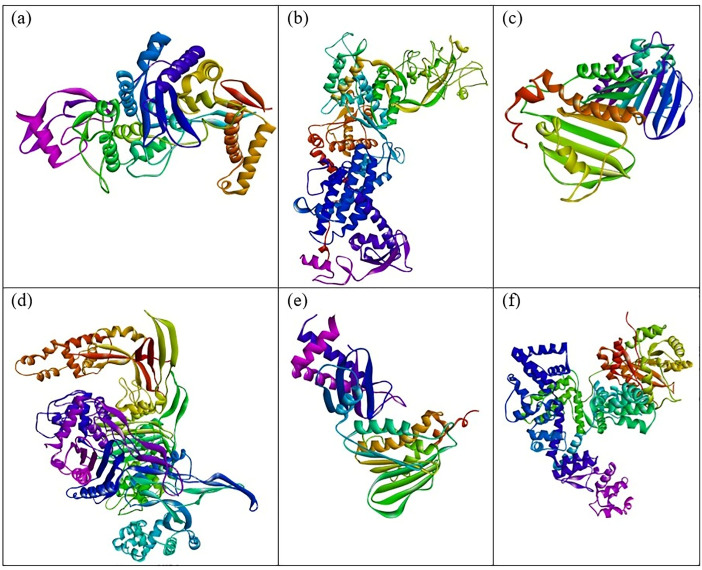 Fig 6
Fig 6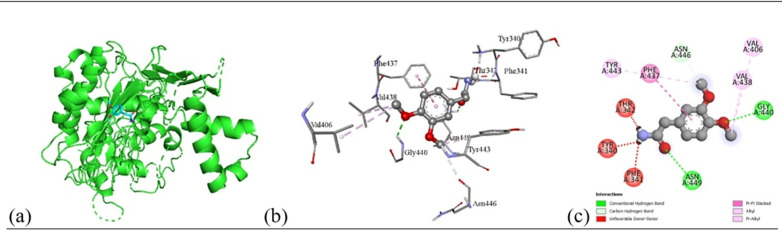 Fig 7
Fig 7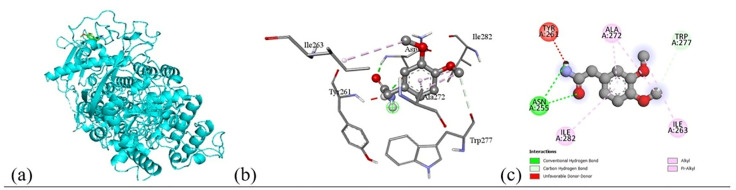 Fig 8
Fig 8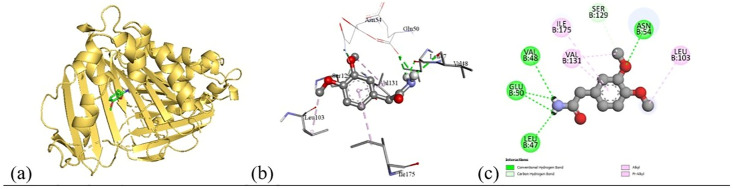 Fig 9
Fig 9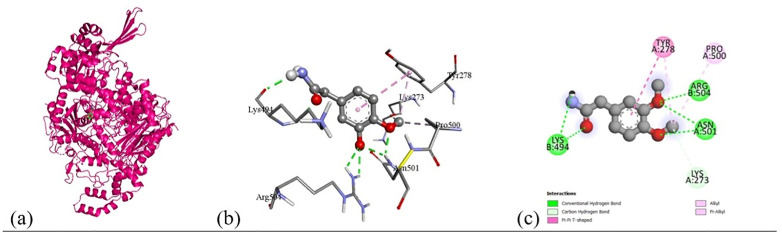 Fig 10
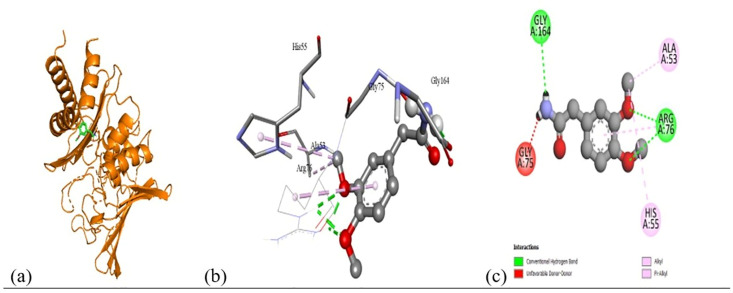 Fig 11
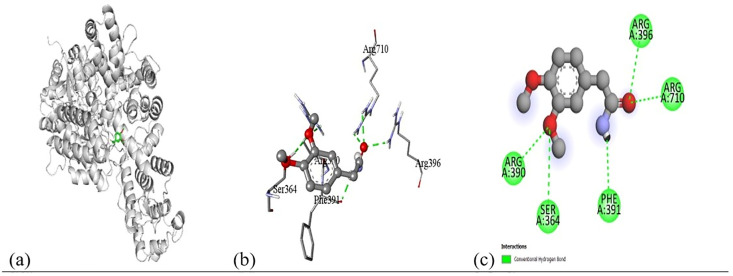 Fig 12
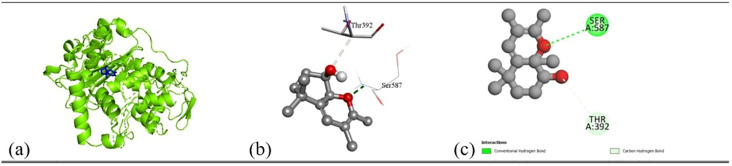 Fig 13
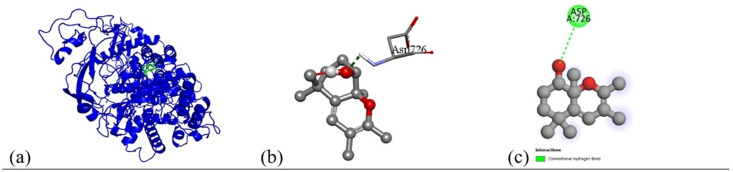 Fig 14
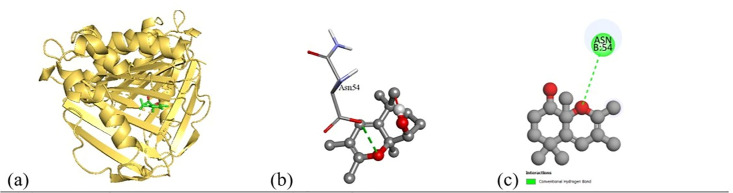 Fig 15
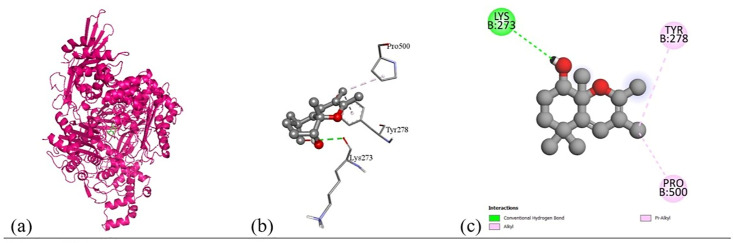 Fig 16
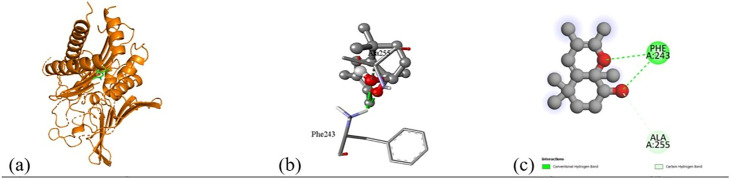 Fig 17
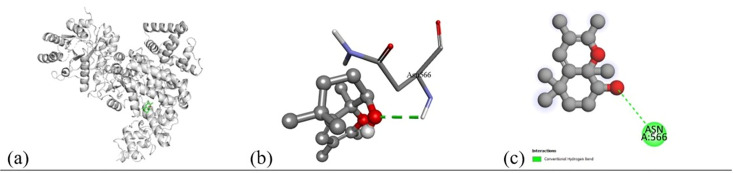 Fig 18
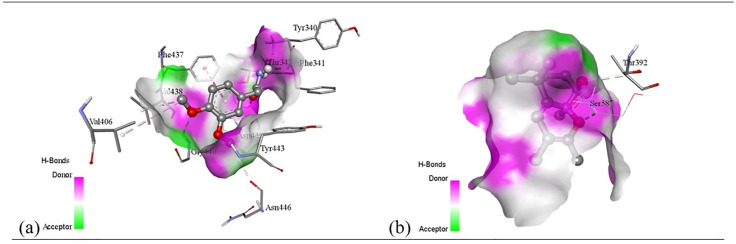 Fig 19
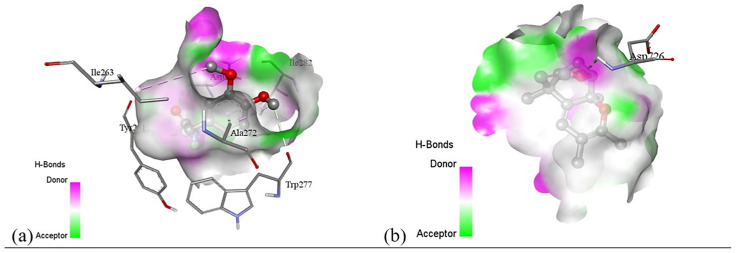 Fig 20
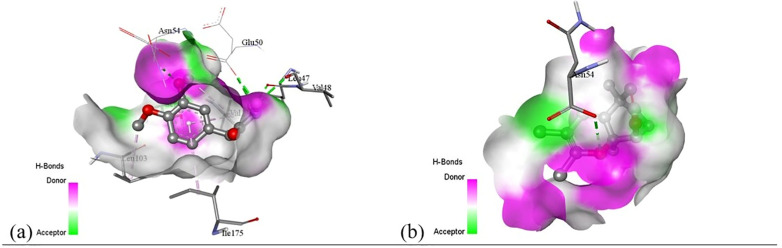 Fig 21
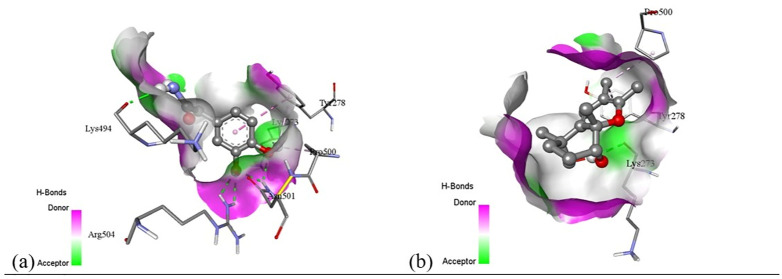 Fig 22
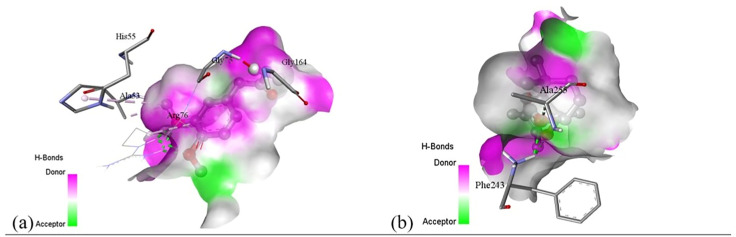 Fig 23
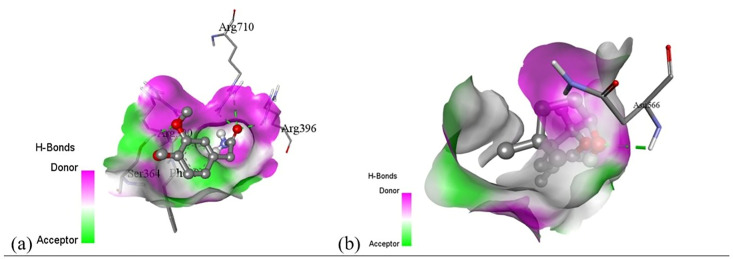 Fig 24
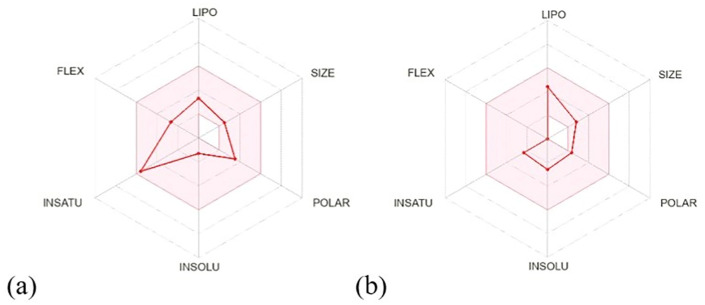 Fig 25
Peer Reviews
No public reviews on file for this paper yet. If you reviewed it on a platform where reviews are public (OpenReview, ICLR, NeurIPS, ICML), you can paste yours below so the community can read it here.
Videos
No videos yet. Explain this paper in a talk, walkthrough, or lecture? Add one.
Taxonomy
TopicsPhytochemistry and Bioactivity Studies · Phytochemical compounds biological activities · Diverse Scientific Research Studies
1. Introduction
Plant-based natural compounds have been widely used around the world as complementary and alternative therapies, playing a pivotal role in maintaining and improving human health and condition. Historically, many pharmaceutical drugs like aspirin, digoxin, morphine, ephedrine, and quinine have originated from medicinal plants, which reinforces the therapeutic potential of botanical sources. Among such plants*, Phyllanthus niruri* L., belonging to the genus Phyllanthus and the family Euphorbiaceae, has gained attention for its rich ethnomedicinal history and diverse pharmacological effects [1]. The genus Phyllanthus comprises over 600 species of shrubs, trees, and annual or biennial herbs widely distributed across tropical and subtropical regions (Fig 1). Among them, Phyllanthus niruri is a small, erect annual herb growing up to 30–40 cm in height, indigenous to the Amazon rainforest as well as tropical areas such as Southeast Asia, southern India, and China [2,3]. The leaf of this plant are alternate, sessile, oblong, and elliptic, measuring 7–12 cm in length, and are arranged distichously, often imbricating. It bears small, off-white to greenish flowers that are solitary, axillary, pedicellate, apetalous, and monoecious [4], with male flowers occurring in groups of one to three and female flowers occurring singly. Male flowers are yellow-white with a reddish tinge at the base and typically possess six sepals or petals [5]. The anthers are yellow, measuring 0.25–0.4 mm in length and 0.3–0.45 mm in width. The capsules are oblate, stramineous, and approximately 3 mm in diameter, with clearly visible venation and very acute stipules [6,7]. It also has a long-standing role in traditional herbal medicine systems such as Ayurveda, Traditional Chinese Medicine, and Indonesian Jamu [4]. In India, where it is referred to as Pitirishi or Budhatri, it is a common household remedy for conditions such as asthma, bronchitis, anaemia, tuberculosis, coughs, jaundice, and extreme thirst [8]. The whole plant is used to treat various ailments including dysentery, vaginitis, influenza, tumours, diabetes, dyspepsia, kidney stones, hepatitis B, and hyperglycaemia, and is recognized for its diuretic, hepatoprotective, and antimicrobial properties [9]. In Ayurvedic medicine, Phyllanthus niruri has also been used for over 2000 years for conditions such as jaundice, gonorrhoea, frequent menstruation, and diabetes [4].
Global distribution of Phyllanthus niruri.Yellow markers indicate reported occurrences across Southeast Asia, Southern India, China, Africa, and the Americas. The map was created using Natural Earth public domain data (https://www.naturalearthdata.com/), which is freely available under the CC0 license.
The therapeutic efficacy of this plant is attributed to its rich phytochemical profile, including lignans, tannins, coumarins, terpenes, flavonoids, alkaloids, saponins, and phenylpropanoids, which are distributed throughout the plant’s leaf, stems, and roots. It also contains common lipids, sterols, and flavonols [8]. To gain insight into these bioactive phytoconstituents, modern analytical techniques such as Gas Chromatography–Mass Spectrometry (GC–MS) have become essential tools. GC–MS enables the rapid identification and characterization of volatile and semi-volatile compounds in complex plant extracts with high precision and sensitivity [9]. In this study, GC–MS was employed to identify key bioactive compounds in the methanolic extract of leaf, providing a chemical fingerprint that supports further pharmacological analysis and strengthens the foundation for therapeutic validation. However, the pharmacological potential of plant leaf has been confirmed through various clinical and preclinical studies. Pharmacological studies have documented the diuretic, hypotensive, and hypoglycaemic activities of this plant [10]. Clinical evaluations have demonstrated that Phyllanthus niruri significantly increases diuresis, reduces systolic blood pressure in hypertensive individuals, and lowers blood glucose levels in diabetic patients [11,12]. Despite its wide usage, scientific evaluation of these leaf is still fragmented, with a lack of consolidated evidence from both clinical and mechanistic studies. The variability of primary research and limited high-throughput screening data have slowed down its progress as a validated therapeutic agent. The alarming rise of multidrug-resistant bacteria has intensified the search for alternative antimicrobial agents with novel mechanisms of action. Medicinal plants, including Phyllanthus niruri, represent promising sources of bioactive compounds with therapeutic potential but remain underexplored for antibacterial activity. Integrating in vitro and in silico approaches can accelerate the identification of effective natural compounds for future drug discovery.
Nonetheless, its potential remains promising, especially in the era of rising antimicrobialresistance, which has rendered many conventional antibiotics less effective and led to an urgent global demand for novel antimicrobial agents. In this context, natural sources such as Phyllanthus niruri offer a less toxic and economically viable alternative to synthetic drugs.
However, despite its rich phytochemical profile and traditional medicinal use, there is still limited understanding of the specific bioactive compounds responsible for its antimicrobial effects and their molecular targets. Given the emerging value of computational tools in drug discovery, our study aimed to investigate both the in vitro and in silico antimicrobial potential of leaf extracts. Through this dual approach, we not only assessed its biological efficacy in laboratory conditions but also explored molecular-level interactions with target proteins relevant to microbial infections. While previous studies have reported the antibacterial activity of Phyllanthus niruri, most have focused either on crude extract testing or general GC–MS characterization without correlating specific identified compounds to bacterial target proteins. In contrast, our study establishes this link by selecting GC–MS–identified molecules with literature-based antimicrobial relevance, performing molecular docking against validated bacterial enzymes and integrating pharmacokinetic predictions to assess their translational drug potential.
2. Materials and methods
2.1. Sampling and proper documentation
Fresh leaf of Phyllanthus niruri were collected from Dhaka, in the month of February,2024. The plant specimen was taxonomically authenticated by an expert taxonomist at the Bangladesh National Herbarium, Mirpur, Dhaka, where it was assigned the accession number [2347RT23]. Prior to collection, necessary permissions and ethical approvals were obtained to ensure compliance with institutional and national regulatory standards. Collected specimens were properly documented, labelled, and preserved for subsequent analyses conducted in this study.
2.2. Preparation of Phyllanthus niruri plant extract
After collection, the plant leaf were thoroughly washed with distilled water to remove dirt, dust, and other contaminants. The cleaned leaf were initially air-dried under shade for 7 days, followed by further drying in a mechanical hot air oven (Memmert UN55, Germany) at 35–40 °C to ensure complete removal of moisture. The completely dried leaf were ground into a coarse powder using a mechanical grinder (Philips HL7756/00 Mixer Grinder, India). The powdered plant material was stored in an airtight amber glass container at room temperature (25 ± 2 °C) in a cool, dry, and dark place to prevent degradation of bioactive constituents prior to extraction and analysis.
For extraction, 400 g of the powdered plant material was transferred into a clean, flat-bottomed amber glass container contained in 2000 mL (1:5 ratio) of methanol at 25°C. The extraction process was allowed to stand and macerate for 7 days, with occasional stirring, until the siphoning solvent colourless, indicating thorough extraction. The resulting methanolic extract was filtered first using cotton and then through Whatman No. 1 filter paper. The filtered extract was concentrated using a rotary evaporator with a water bath maintained at 40°C under reduced pressure to 100mbar. The rotary evaporator was operated at a rotation speed of 120 rpm, and the condenser temperature was maintained between –5°C to 5°C to ensure efficient condensation and recovery of methanol vapours. A total of 10 g of the crude extract was subjected to successive solvent-solvent partitioning, yielding various fractions based on their increasing polarity, following the standard Kupchan partitioning method [13,14]. The process resulted in the separation of the ethyl acetate-soluble fraction (ESF, 1.9 g), petroleum ether-soluble fraction (PSF, 0.7 g), chloroform-soluble fraction (CSF, 0.6 g), carbon tetrachloride-soluble fraction (CTF, 0.8 g), methanol-soluble fraction (MSF, 3.5 g), and aqueous fraction (AQF, 2.5 g). These fractions were then concentrated and stored for further phytochemical and pharmacological evaluations The Kupchan partitioning method is a strategic approach to simplify crude extracts, enhance bioactivity screening, and facilitate compound isolation. By fractionating plant extracts into polarity-based groups, this method significantly contributes to natural product research, drug discovery, and pharmacological studies [15].
2.3. Chemicals and reagents
Analytical-grade chemicals were used throughout the study to ensure precision and consistency in all experimental procedures. The reagents employed included methanol (liquid chromatography grade, ≥ 99.8%), ethyl acetate (≥99.9% GC), petroleum ether (≥80%), chloroform (≥99% ACS reagent grade), carbon tetrachloride (≥99.9%), gallic acid (98%), catechin (≥99.8%), Folin-Ciocalteu reagent (standard reagent grade), and aluminium chloride (anhydrous, sublimed, ≥ 99.8%). All chemicals were sourced from Science Park Chemicals Ltd., Bangladesh, and handled according to standard laboratory safety protocols.
2.4. Phytochemical screening of plant extract
2.4.1. Phytochemical screening of crude extracts.
A qualitative phytochemical screening was performed to identify the presence of different bioactive constituents in all crude solvent extracts of Phyllanthus niruri. Standard phytochemical tests were carried out following slightly modified protocols [16]. These tests included Molisch’s test, Fehling’s solution test, Lead acetate test, Ferric chloride test, Mayer’s and Wagner’s tests, Shinoda test, Frothing test, and Libermann-Burchard’s test. The results confirmed the presence of major phytochemical groups such as carbohydrates, reducing sugars, tannins, alkaloids, flavonoids, saponins, steroids, phenols, and glycosides across various solvent fractions. All observations were carefully recorded and presented in Table 1.
Table 1: Preliminary phytochemical screening of crude methanolic extract of Phyllanthus niruri leaf extract.
2.4.2. Estimation of total phenolic content (TPC).
The total phenolic content was assessed following the procedure outlined by Velioglu et al. [17]. In this method, 1 mL of the crude methanolic extract and its respective fractions (at a concentration of 1000 μg/mL) each were combined with 1 mL of Folin-Ciocalteu reagent in separate test tubes. After allowing the reaction to proceed for 5 minutes, 10 mL of a 7% sodium carbonate (Na₂CO₃) solution was added, followed by 13 mL of deionized distilled water to bring the total volume to the desired level. The mixtures were thoroughly mixed and incubated in a dark environment at 23°C for 90 minutes. For standardization, gallic acid solutions with concentrations of 62.5, 125, 250, 500, and 1000 μg/mL were prepared using the same protocol. The absorbance of each sample was then recorded at 750 nm using a spectrophotometer, with methanol serving as the blank control. The TPC was expressed in terms of gallic acid equivalents (GAE) and calculated using the following equation:
where C is the total phenolic content (mg GAE/g of extract), c represents the gallic acid concentration determined from the standard curve (mg/mL), V is the volume of the extract (mL), and m denotes the dry weight of the extract (g).
2.4.3. Estimation of total flavonoid content (TFC).
The total flavonoid content was evaluated using the method developed by Nicolescu et al. [18]. In this assay, 0.3 mL of the crude methanolic extract and its respective fractions from Phyllanthus niruri were mixed with 3.4 mL of 30% methanol, 0.15 mL of 0.3 M aluminum chloride hexahydrate (AlCl₃·6H₂O), and 0.15 mL of 0.5 M sodium nitrite (NaNO₂) in separate test tubes. After an incubation period of 5 minutes, 1 mL of 1 M sodium hydroxide (NaOH) was added to each tube. The mixture was then thoroughly shaken to ensure complete reaction. The absorbance of the resulting solution was recorded at 506 nm using a UV-visible spectrophotometer, with reagent blanks serving as the control. For calibration, catechin solutions were prepared at concentrations of 62.5, 125, 250, 500, and 1000 μg/mL, following the same procedure as used for the sample extracts. The total flavonoid content was expressed in catechin equivalents (CE) and calculated using the equation:
where C represents the flavonoid content (mg CE/g of extract), c is the catechin concentration obtained from the standard curve (mg/mL), V is the volume of the extract (mL), and m is the dry weight of the extract (g).
2.4.4. GC-MS Sample Preparation and Analysis.
To prepare the sample for GC-MS analysis, 10 mg of the dried methanolic extract of leaf was dissolved in 1 mL of GC-MS-grade methanol. The solution was thoroughly vortexed and centrifuged to remove any insoluble particles. The clear supernatant obtained was carefully collected and filtered using a 0.22 µm syringe filter to ensure sample clarity. Subsequently, 1 µL of the filtered solution was injected into the GC-MS instrument for analysis.
GC–MS analysis was carried out using an Agilent 7890A capillary gas chromatograph (Agilent Technologies), coupled with a 5975C inert XL EI/CI triple-axis mass detector. Separation was performed on an HP-5MSI fused silica capillary column (5% phenyl, 95% dimethylpolysiloxane; 0.25 μm film thickness, 90 m length, 0.25 mm internal diameter).
The chromatographic conditions were as follows: the oven temperature was initially set at 90°C (held for 0 min), ramped to 200°C at 3°C/min and held for 2 min, then increased to 280°C at 15°C/min and held for 2 min. The total run time was 50 minutes. Helium was used as the carrier gas at a flow rate of 1.1 mL/min. The inlet temperature was maintained at 250°C, and the auxiliary temperature was set at 280°C.
Mass spectrometric conditions included a quadrupole temperature of 150°C, ion source temperature of 230°C, and mass scan range of 50–550 m/z in scan mode. Identification of compounds was achieved by comparing the mass spectra with entries in the NIST-MS Library. The relative percentage of each identified compound was determined based on the peak areas in the total ion chromatogram (TIC).
To ensure analytical reliability, compound identification was validated by comparing mass spectra with multiple entries in the NIST 2020 and Wiley libraries. Only compounds with a match quality ≥90% were considered. Quantitative confirmation was performed using peak area normalization. The novelty of major compounds was evaluated through PubChem and existing phytochemical databases to determine whether they had been previously reported in Phyllanthus niruri.
2.5. In-vitro study design for antimicrobial evaluation
2.5.1. Test organisms for antimicrobial evaluation.
The bacterial strains used in this study were collected from the Department of Microbiology, University of Dhaka. The gram-positive bacterial strains included Bacillus subtilis, Bacillus cereus, Staphylococcus aureus, and Sarcina lutea, while the gram-negative strains consisted of Escherichia coli, Salmonella typhi, Vibrio mimicus, Vibrio parahaemolyticus, and Bacillus parahaemolyticus. All bacterial cultures were maintained at a constant temperature of 37°C prior to use in antimicrobial testing.
2.5.2. Preparation of inoculum.
To prepare the bacterial inoculum, 5 mL of nutrient broth was dispensed into sterilized test tubes, sealed with cotton plugs, and autoclaved for complete sterilization. Once cooled, the test tubes were labelled accordingly and arranged on a slide rack. Each tube was then inoculated with two loopfuls of individual bacterial strains comprising a total of nine organisms, including five gram-negative and four gram-positive bacteria. The contents were thoroughly mixed and incubated at 37°C for 18–24 hours. Following incubation, visible microbial growth confirmed successful inoculation.
2.5.3. Antibacterial activity.
The antibacterial potential of leaf extracts was evaluated using the disc diffusion method. Various solvent fractions (CTF, PSF, ESF, MSF, and CSF) were tested at 1000 µg/disc against Gram-positive strains (Bacillus subtilis ATCC 6633, Bacillus cereus ATCC 14579, Staphylococcus aureus ATCC 25923, Sarcina lutea ATCC 9341) and Gram-negative strains (Escherichia coli ATCC 25922, Salmonella typhi ATCC 19430, Vibrio mimicus ATCC 33653, Vibrio parahaemolyticus ATCC 17802, Bacillus parahaemolyticus ATCC 33844). Sterile filter paper discs were impregnated with the extracts and placed on nutrient agar plates pre-seeded with the test bacteria. Plates were first kept at 4°C for 24 hours to allow diffusion, then incubated at 37°C for another 24 hours. Ciprofloxacin (5 µg/disc; Che-5) and methanol (40 µL/disc) served as positive and negative controls, respectively. All tests were performed in triplicate, and inhibition zones were measured (mm) and expressed as mean ± SD to determine antibacterial activity [19,20]. The selected bacterial strains represent clinically relevant pathogens responsible for various infectious diseases.
2.5.4. Minimum inhibitory concentration (MIC).
The MIC of the leaf extracts were determined using the broth microdilution method as described by Wiegand et al. and Balouiri et al. [21,22], with minor modifications. Serial two-fold dilutions of each extract and its solvent fractions (CTF, PSF, ESF, MSF, and CSF) were prepared in Mueller-Hinton broth (MHB) to obtain concentrations ranging from 1000 µg/mL to 7.8 µg/mL. Each tube received 1 mL of standardized bacterial suspension (approximately 1 × 10⁶ CFU/mL) prepared from 24-hour-old cultures adjusted to 0.5 McFarland standard.
The antibacterial activity was tested against both Gram-positive and Gram-negative bacteria, including Bacillus subtilis, Bacillus cereus, Staphylococcus aureus, Sarcina lutea (Gram-positive), and Escherichia coli, Salmonella typhi, Vibrio mimicus, Vibrio parahaemolyticus, and Bacillus parahaemolyticus (Gram-negative). Ciprofloxacin (5 µg/disc; Che-5) was used as a positive control, and methanol (40 µL/disc) served as the negative control. The tubes were incubated at 37°C for 18–24 hours under aerobic conditions. After incubation, the tubes were visually examined for turbidity or pellet formation indicating bacterial growth. The lowest concentration showing no visible growth was recorded as the MIC. To verify results, optical density readings at 600 nm were measured using a UV visible spectrophotometer (Shimadzu UV-1800, Japan).
2.5.5. Minimum bactericidal concentration (MBC).
The Minimum Bactericidal Concentration (MBC) test was performed to determine the lowest concentration of leaf extract and its solvent fractions (CTF, PSF, ESF, MSF, and CSF) that could kill the bacterial cells, rather than merely inhibiting their growth. The MBC assay was conducted following the procedures outlined by Wiegand et al. and Balouiri et al. [21–23], with necessary modifications to fit plant extract analysis.
After determination of the MIC, all tubes or wells that showed no visible growth or turbidity were selected for MBC testing. From each of these tubes, 0.1 mL aliquots were aseptically withdrawn using sterile micropipette tips and spread-plated onto freshly prepared nutrient agar plates that contained no antimicrobial agents. These plates were then incubated at 37°C for 24 hours under appropriate conditions to allow any surviving bacterial cells to form visible colonies. After incubation, plates were examined for bacterial growth.
The MBC was defined as the lowest concentration of extract that produced no visible bacterial colonies on the agar surface, indicating complete elimination of viable bacterial cells. This endpoint confirms the bactericidal activity of the test substance, distinguishing it from merely bacteriostatic effects observed in the MIC assay.
To assess the bactericidal strength of each extract, the MBC/MIC ratio was calculated. If the ratio was ≤ 4, the extract was considered to exhibit bactericidal activity, while a ratio > 4 indicated bacteriostatic activity. Each experiment was performed in triplicate to ensure precision and reproducibility of the data.
The MBC test was conducted against the same Gram-positive and Gram-negative bacterial strains used in the MIC assay, including Bacillus subtilis, Bacillus cereus, Staphylococcus aureus, Sarcina lutea, Escherichia coli, Salmonella typhi, Vibrio mimicus, Vibrio parahaemolyticus, and Bacillus parahaemolyticus. Ciprofloxacin (5 µg/disc; Che-5) served as the positive control due to its well-established bactericidal activity, while methanol (40 µL/disc) was included as a negative control to rule out solvent effects.
The MBC determination provided a reliable estimation of the killing potential of Phyllanthus niruri extracts, offering insight into their potential as natural antibacterial agents. The inclusion of both Gram-positive and Gram-negative organisms further enabled evaluation of the broad-spectrum efficacy of the extracts.
2.5.6. Statistical evaluation.
The experimental results were processed using SPSS software version 22.0 (SPSS Inc., Chicago, IL, USA). Data represent the mean ± standard deviation (SD) calculated from three independent replicates. To assess significant differences between group means, one-way ANOVA was performed followed by Duncan’s Multiple Range Test (DMRT) as a post-hoc analysis, considering p-values less than 0.05 as statistically significant.
2.6. In-silico study analysis
2.6.1. Selection and preparation of ligands and standard drug.
To support and extend the in vitro findings, 10 major compounds selected based on their high concentration per volume of extract and known antimicrobial profiles were subjected to in silico analysis to identify potential bioactive constituents responsible for the experimental outcomes, as presented in Table 8. Ciprofloxacin, a fluoroquinolone antibiotic known for its broad-spectrum efficacy against both Gram-positive and Gram-negative bacteria, was employed as the standard reference drug [24,25]. Its antimicrobial action works by targeting and inhibiting bacterial enzymes DNA gyrase and topoisomerase IV, which are critical for processes such as DNA replication, transcription, repair, and recombination. Inhibiting these enzymes interferes with bacterial DNA functions, ultimately causing cell death and effective microbial clearance [26]. The three-dimensional (3D) structures of all selected ligands, along with ciprofloxacin, were downloaded in Structure Data File (SDF) format from the PubChem database (https://pubchem.ncbi.nlm.nih.gov/). For proper docking analysis, the molecular structures were prepared and geometrically optimized. This involved ligand preparation using Gaussian and GausView software, followed by energy minimization using Gabedit to ensure the ligands were in their most stable conformations for computational modelling.
2.6.2. Selection and preparation of target proteins.
Based on the in vitro findings, where four Gram-positive and five Gram-negative bacterial strains were tested against five different fraction of plant extracts, Staphylococcus aureus (Gram-positive) and Escherichia coli (Gram-negative) were selected for further in silico studies due to their consistently strong susceptibility across all extract types. To investigate the molecular interactions responsible for this antimicrobial activity, six target proteins were selected through literature review. For Staphylococcus aureus, the chosen targets included Penicillin-Binding Protein 1B (PBP1B) [PDB ID: 2Y2I], Isoleucyl-tRNA synthetase (IleRS) [PDB ID: 1FFY], DNA Gyrase Subunit B (GyrB) [PDB ID: 3G75], and Penicillin-Binding Protein 3 (PBP3) [PDB ID: 3VSL] [27,28]. For Escherichia coli, DNA Gyrase Subunit B (GyrB) [PDB ID: 4PRX] and the Catalytic α-subunit of DNA Polymerase III (Pol III α-subunit) [PDB ID: 2HNH] were selected [29,30]. The 3D structures of these proteins were retrieved from the RCSB Protein Data Bank (https://www.rcsb.org/) and visualized using Discovery Studio software. During preparation, all non-essential molecules were removed, and the refined protein structures were saved in PDB format (Fig 5). To ensure structural stability and accuracy, each protein was then subjected to energy minimization using Swiss-PDB Viewer (version 4.1.0).
Docking reliability was strengthened by revalidating each target protein using redocking of the co-crystallized ligand, ensuring RMSD ≤ 2.0 Å. Grid box parameters were optimized around active sites identified from crystallographic data. Binding energies were compared to ciprofloxacin as a positive control to assess relative binding strengths.
2.6.3. Molecular docking and non-bonding interaction analysis.
To elucidate the molecular basis of the observed antimicrobial activity, molecular docking simulations were systematically carried out to quantify the binding affinities between selected phytochemicals and bacterial protein targets. Using PyRx (version 0.8), a total of 10 plant-derived compounds, alongside the standard antibiotic ciprofloxacin, were docked against structurally characterized targets from both Gram-positive and Gram-negative bacterial strains. The docking scores, presented in Table 9, provided a comparative framework to evaluate ligand protein interactions. Among these, the ligands exhibiting the lowest binding energy (i.e., strongest affinity) across multiple targets were prioritized for in-depth interaction profiling, as listed in Table 10.
Subsequent structural visualization was conducted using PyMOL, which facilitated the identification and extraction of binding poses in PDB format. These docked complexes were further analyzed using Discovery Studio to generate both 2D and 3D interaction maps. Figs 7–18 illustrate the spatial orientation and types of non-covalent interactions (e.g., hydrophobic, van der Waals, and electrostatic), while Figs 19–24 specifically highlights the hydrogen bonding patterns between ligands and amino acid residues within the active sites.
The interaction profiles were critically examined to identify key residues involved in stabilizing the ligand–receptor complexes, revealing consistent binding motifs that may underlie the antimicrobial efficacy. These findings, summarized in Table 11, provide molecular-level insight into the binding preferences of each compound and offer a rationale for their biological activity, thereby guiding future optimization of lead candidates.
2.6.4. ADMET study analysis.
The compound identified through molecular docking was further evaluated for its pharmacokinetic properties, specifically focusing on absorption, distribution, metabolism, excretion, and toxicity (ADMET). For this purpose, the molecular structures were converted into SMILES format and analysed using the pkCSM web server (http://biosig.unimelb.edu.au/pkcsm/prediction). This tool provided comprehensive predictions for key ADMET parameters, offering valuable insights into the compound’s potential behaviour within biological systems [31]. Compounds demonstrating favourable pharmacokinetic profiles were considered promising candidates and prioritized for subsequent analysis.
2.6.5. Drug likeness study analysis.
To assess its drug-likeness profile, the selected compound was further analysed using the Swiss ADME tool (http://www.swissadme.ch/). The structure was first converted into canonical SMILES format and then evaluated for various in silico pharmacokinetic properties, including physicochemical characteristics, hydrophilicity, lipophilicity, and bioavailability. The analysis was guided by Lipinski’s Rule of Five, a standard criterion for predicting the oral bioavailability of new molecular entities (NMEs). According to this rule, a compound is less likely to have good absorption or permeability if it has more than five hydrogen bond donors, more than ten hydrogen bond acceptors, a molecular weight over 500 Daltons, or a Log P value greater than 5. Compounds violating more than two criteria are generally considered less favourable for oral administration [32–34].
3. Result and discussion
3.1. Analysis of phytoconstituents of crude methanol extract
Preliminary phytochemical screening of the crude methanolic extract of leaf revealed the presence of several bioactive constituents, including steroids, tannins, saponins, phenols, and flavonoids. Among these, phenols, saponins, and flavonoids showed particularly strong results in the qualitative analysis (Table 1). This was further supported by the quantitative analysis, which confirmed a substantial presence of these compounds (Table 2). These phytochemicals are well-documented for their broad therapeutic potential, including applications in the treatment of diabetes, obesity, cancer, and cardiovascular diseases [35]. In particular, flavonoids and phenolic compounds are recognized for their potent antimicrobial activity, which likely contributes to the biological effects observed in this study [36].
Table 2: Total phenolic and total flavonoid contents of various extractives leave of Phyllanthus niruri.
3.2. Estimation of total phenolic contents (TPC) and total flavonoid content (TFC)
TPC and TFC of Phyllanthus niruri extracts were quantified in various solvents with differing polarities (Table 2). The solvents are arranged in order of increasing polarity, ranging from non-polar to highly polar (distilled water). Our results indicate a clear trend in both TPC and TFC values with respect to solvent polarity. Non-polar solvents such as PSF, CSF and CTF yielded the lowest TPC (51.21 ± 0.55, 60.11. ± 0.27 and 70.12 ± 0.15 µg GAE/g extract, respectively) and TFC (101.01 ± 0.14, 100.31 ± 0.14and 89.20 ± 0.14 µg QE/g extract, respectively). As solvent polarity increased, both phenolic and flavonoid extraction efficiencies improved markedly. ESF, a moderately polar solvent, extracted 102.06 ± 0.11 mg GAE/g TPC and 109.09 ± 0.21 µg QE/g TFC. Among all the solvents tested, methanol a polar protic solvent demonstrated the highest extraction efficiency, yielding TPC and TFC values of 119.10 ± 0.11 µg GAE/g and 128.01 ± 0.11 µg QE/g, respectively. This indicates that methanol was the most effective solvent for extracting phenolic and flavonoid compounds from Phyllanthus niruri. The AQSF also showed a high TFC and TPC value of 123.17 ± 0.69 and 111.03 ± .01 µg QE/g respectively, which is consistent with the findings of Edziri et al., supporting the use of polar solvents for maximizing the recovery of bioactive compounds [20]. Ethanol and distilled water, both polar protic solvents, demonstrated high extraction capabilities. These findings suggest that solvent polarity significantly influences the extraction of phenolic and flavonoid compounds from Phyllanthus niruri, highlighting the importance of appropriate solvent selection to maximize the recovery of bioactive constituents in phytochemical studies and underscoring their potential in managing various diseases [37]^.^ The high flavonoid content suggests a significant role in the plant’s antimicrobial activity [38], while the elevated levels of phenolic compounds may further enhance this effect [39]. These findings highlight the strong potential of Phyllanthus niruri as a rich source of health-promoting phytochemicals [40].
Phenolic compounds and flavonoids are two major groups of natural chemicals (secondary metabolites) found in many medicinal plants and food sources. These compounds are well known for their biological activities, especially for helping to fight infections [41]. The total phenolic content and total flavonoid content are often measured in plant extracts to estimate their medicinal potential. A higher TPC or TFC usually means the extract has more active compounds and might have stronger health benefits. These values are particularly important in developing plant-based treatments for metabolic diseases, like diabetes, and infections caused by bacteria [42,43].
Among the fractions tested, the polar protic methanolic fraction (MSF) showed the highest total phenolic content (119.10 ± 0.11 µg GAE/g) and total flavonoid content (128.01 ± 0.11 µg QE/g), indicating a higher concentration of bioactive compounds compared to other fractions. Therefore, this fraction was selected for GC–MS analysis and in silico molecular docking studies to prioritize the fraction with the greatest potential pharmacological activity. While all fractions were evaluated in in vitro assays to assess overall biological activity, focusing on MSF for chemical profiling and computational studies allowed for a more targeted investigation of the most potent bioactive constituents.
4. Identification and quantification of chemical compounds in methanolic extract
GC-MS analysis identified and quantified 75 compounds in the methanolic extract of Phyllanthus niruri. The GC-MS chromatogram illustrates the separation pattern of these compounds, while the chemical constituents along with their retention time (RT), molecular formula, molecular weight (MW), and concentration (µg/mL) in the methanol extract are detailed in Table 3. The retention times range approximately from 6.485 minutes to 32.107 minutes. This variation reflects the differences in chemical properties such as polarity, molecular size, and interactions with the stationary phase within the chromatography column. Compounds with shorter retention times (around 6–8 minutes) are generally smaller, less polar, or interact weakly with the stationary phase, allowing them to elute faster. Those with medium retention times (about 9–13 minutes) tend to have moderate polarity and size. Compounds with higher retention times (around 14–32 minutes) are usually larger or more polar, resulting in stronger retention and slower elution.
Table 3: List of compounds identified and semi-quantified by GC-MS analysis of the methanolic extract of Phyllanthus niruri. Compounds are classified based on functional group and structural features.
GC-MS profiling provided a semi-quantitative overview of the phytochemical constituents of Phyllanthus niruri, where compound abundance was expressed as relative peak area percentages. The compounds in Table 3 have concentrations ranging from 0.120 µg/mL to 13.243 µg/mL, indicating a wide range of chemical abundance. Among the most abundant compounds are 3,4-Dimethoxy-dl-phenylalanine, Benzeneacetamide, 3,4-dimethoxy-, and 3-(3,4-Dimethoxyphenyl)-propionic acid, each present at 13.243 µg/mL. Moderately abundant compounds include Benzeneethanamine, 2,5-dimethoxy-. alpha.,4-dimethyl- and 5H-Benzo[b]pyran-8-ol, 2,3,5,5,8a-pentamethyl-6,7,8,8a-tetrahydro-, with concentrations of 4.695 µg/mL, and Disiloxane, 1,3-diethoxy-1,1,3,3-tetramethyl- at 3.402 µg/mL. Several compounds such as 2-Octyn-1-ol, 2-Heptanamine, 5-methyl-, and Butanal, 3-methyl- appear in lower amounts, with concentrations near 0.120 µg/mL (Fig 2).
Chromatogram of GC-MS analysis of Phyllanthus niruri leaf extract.
The extract includes a diverse group of chemicals such as amino acids, amines, fatty acid esters, alcohols, and aromatic derivatives, many of which exhibit bioactive properties including antioxidant, antimicrobial, anti-inflammatory, and anticancer effects. Notably, compounds with moderate retention times often show higher concentrations, suggesting they are more readily separated and quantified using this analytical method. Meanwhile, compounds with lower concentrations are frequently those with longer retention times, possibly due to complex interactions with the column.
In addition to retention time, concentration data play a vital role in quantifying the amounts of various compounds present in a sample. This quantitative information enhances compound identification and confirmation, which is essential in disciplines such as pharmacology, toxicology, biochemical analysis, and environmental testing. In industrial applications, particularly within the pharmaceutical and chemical manufacturing sectors, accurate monitoring of plant-derived chemical concentrations is essential for ensuring quality control and meeting regulatory standards. In this study, various compounds were quantitatively identified in the methanolic extract of Phyllanthus niruri. By analyzing both retention times and concentration values, a comprehensive chemical profile was established. This approach not only aids in the precise identification of individual bioactive constituents but also enables accurate quantification, which is crucial for consistency in formulation and efficacy in therapeutic applications.
The relative abundance of dimethoxy derivatives and long-chain fatty acid esters indicates that these compounds may act synergistically in antibacterial mechanisms. When compared with earlier Phyllanthus species studies, three compounds Benzeneacetamide (3,4-dimethoxy-), 3-(3,4-Dimethoxyphenyl)-propionic acid, and 5H-Benzo[b]pyran-8-ol—appear as newly reported constituents in Phyllanthus niruri leaf, highlighting the novelty of this GC–MS profile.
4.1. Chemical classification of the identified compounds
The compounds listed in Table 3 exhibit a diverse chemical profile comprising amines and amino derivatives (21%) (Aliphatic, Aromatic, Cyclic, Bicyclic, Diamine, Phenethylamine, Amino alcohol); amino acids and derivatives (10%) (including cystine, alanine derivatives); alcohols (13%) (including Alkenyl, Cycloalcohol, Polycyclic, Long chain alcohols); fatty acids and esters (15%) (saturated, unsaturated, polyunsaturated, bromo derivatives); aldehydes (5%); amides and derivatives (7%) (including urea, cyclic diamide); ethers and polyethers (7%) (Bicyclic ether, Polycyclic ether, Polyether macrocycle, Siloxane polymer, Disiloxane); esters (3%) (excluding fatty acid esters); steroid derivatives (3%); polyphenols (~2%); organosilicon & silane derivatives (7%); and other organic molecules (7%) (Fig 3). There are reports that amines and amino derivatives play crucial roles as neurotransmitters and exhibit diverse pharmacological properties including antimicrobial and sympathomimetic effects. Amino acids and their derivatives are essential for protein biosynthesis, metabolic regulation, and muscle maintenance. Fatty acids and esters contribute to membrane structure and possess antioxidant, anti-inflammatory, and anticancer properties. Alcohols are often associated with antimicrobial and antioxidant activities. Organosilicon compounds and ethers have been explored for their biocompatibility and bioavailability enhancement. The presence of steroid derivatives enriches the extract’s potential for hormonal modulation and anticancer effects. Polyphenolic compounds are well known for their antioxidant and cardioprotective activities [118].
Percentage composition of identified chemical classes.
4.2. Distribution of identified compounds based on major biological activities
Phyllanthus niruri, commonly known as “stone breaker,” is a medicinal herb with a wide range of pharmacological activities supported by both traditional use and scientific research. It exhibits potent antiviral effects, particularly against Hepatitis B virus, by inhibiting viral DNA polymerase. Its hepatoprotective properties help regenerate liver cells and protect against toxins, making it valuable in treating cirrhosis and hepatitis. Rich in flavonoids and polyphenols, the plant also acts as a strong antioxidant, reducing oxidative stress and cellular damage. Anti-inflammatory compounds in plant leaf suppress cytokines and enzymes like COX-2, while its anticancer activity involves inducing apoptosis and inhibiting tumor growth. It shows antidiabetic effects by improving insulin sensitivity and lowering blood glucose levels, and its antiplasmodial action targets malaria parasites. Traditionally used for kidney health, Phyllanthus niruri demonstrates nephroprotective and antilithic effects by preventing and dissolving kidney stones (Fig 4). Additionally, it has antimicrobial activity against pathogens like Staphylococcus aureus and Candida albicans. These effects are attributed to bioactive compounds such as phyllanthin, hypophyllanthin, quercetin, rutin, alkaloids, tannins, and saponins [15], confirm its therapeutic potential across multiple biological pathways.
Distribution of identified compounds according to major biological activities (%).
5. In-vitro antibacterial activity analysis
The antibacterial potential of five different organic solvent fractions derived from the leaf of Phyllanthus was evaluated against a panel of nine pathogenic bacterial strains, consisting of both Gram-positive and Gram-negative species. The antimicrobial results revealed that leaf extract demonstrated notable inhibitory effects against these pathogens. This suggests that the plant contains bioactive compounds with promising antibacterial properties. The findings support the potential of Phyllanthus niruri as a natural source for developing plant-based antimicrobial agents and align with the growing interest in phytochemicals as alternatives or complements to conventional treatments [52].
Among the tested fractions, the ESF exhibited the most prominent antibacterial effect, particularly against Escherichia coli (17.2 mm), Shigella dysenteriae (17.4 mm), and Bacillus subtilis (15.1 mm). The MSF also showed strong inhibition, notably against Staphylococcus aureus (20.5 mm) and E. coli (14.1 mm). Other fractions, including PSF, CTF, and CSF displayed moderate to weak antibacterial activity, while some bacteria showed no response to certain extracts. The standard antibiotic Che-5 demonstrated the highest inhibition zones (26–33 mm) across all test organisms, confirming its potent antibacterial effect all are presented in Table 4. Overall, the results indicate that the ESF and MSF fractions possess significant antibacterial properties, suggesting the presence of bioactive compounds with broad-spectrum antimicrobial potential.
Table 4: Antibacterial activity by different extractives of leaf of Phyllanthus niruri through agar diffusion method.
Phyllanthus niruri exhibited notable antibacterial activity against nine clinically significant bacterial strains, including four Gram-positive and five Gram-negative species selected for in vitro evaluation. These bacterial strains are responsible for various human infections presented in Table 5, including systemic, gastrointestinal, respiratory, and dermal diseases. Testing against this diverse group allowed for a comprehensive assessment of the broad-spectrum antimicrobial potential of leaf extracts*.*
Table 5: List of selected gram-positive and gram-negative bacteria selected for in-vitro analysis.
The MIC values of Phyllanthus niruri fractions against selected bacteria are presented in Table 6. Among Gram-positive strains, the ESF exhibited the strongest inhibitory effects, with MICs ranging from 7.8–15.6 mg/mL, followed by moderate activity from MSF and PSF, CTF and CSF showed comparatively weaker inhibition. For Gram-negative bacteria, ESF again demonstrated the most pronounced activity (7.8–19.5 mg/mL), while other fractions showed variable or minimal inhibition. The standard antibiotic Ciprofloxacin (Che-5) displayed the lowest MIC values (0.25–1.0 µg/mL), significantly more effective than the plant-derived fractions (p < 0.05), presented in Table 6.
Table 6: Minimum inhibitory concentration (MIC) of Phyllanthus niruri leaf fractions against tested bacteria.
The MBC values of Phyllanthus niruri fractions against nine bacterial strains are summarized in Table 7. Among Gram-positive bacteria, the ESF showed the strongest activity, with MBCs of 10.8–20.4 mg/mL, followed by moderate effects from the MSF and PSF. The CTF and CSF showed comparatively weaker activity. For Gram-negative bacteria, ESF again exhibited the lowest MBC values (15.6–22.6 mg/mL), indicating broad-spectrum bactericidal potential. Other fractions displayed moderate to low activity, with some showing no bactericidal effect. The reference drug Ciprofloxacin (Che-5) showed the highest potency (0.5–1.0 µg/mL), significantly more active than all extract fractions (p < 0.05), presented in Table 7.
Table 7: Minimum bactericidal concentration (MBC) of Phyllanthus niruri leaf fractions against tested bacteria.
The antibacterial activity was assessed using the disc diffusion method, where 1000.0 μg/disc of each extract was tested for its ability to inhibit microbial growth. The zone of inhibition produced by each fraction was measured in millimetres and compared with the standard antibiotic, ciprofloxacin (5.0 μg/disc), known for its broad-spectrum antibacterial action through inhibition of bacterial DNA gyrase and topoisomerase. Ciprofloxacin binds to bacterial DNA gyrase with 100 times the affinity of mammalian DNA gyrase [19]. The diameter of the inhibition zones for each bacterial strain is presented in Table 4.
The study investigated the antibacterial activity of various solvent fractions derived from the medicinal plant Phyllanthus niruri against a range of pathogenic bacteria. The results clearly indicate that the efficacy of these extracts depends heavily on the polarity of the solvents used. MSF, being highly polar, the ESF, being moderately polar, demonstrated the strongest antibacterial activity. The zone of inhibition for MSF ranged from 4.3 mm to 20.5 mm, while for ESF it ranged from 12.1 mm to 17.4 mm. Notably, these extracts were effective against both Gram-positive and Gram-negative bacteria, with Staphylococcus aureus showing a zone of 20.5 mm (MSF) and 14.1 mm (ESF), and Escherichia coli showing 14.1 mm (MSF) and 17.2 mm (ESF). This indicates a strong sensitivity of these pathogens to polar compounds in Phyllanthus niruri.
In contrast, extracts obtained using non-polar solvents namely the PSF, CSF, and CTF exhibited minimal to no antibacterial activity, with inhibition zones generally in the range of 3.5 mm to 11.5 mm, or absent altogether. This limited activity is likely because non-polar solvents do not efficiently extract key bioactive compounds such as phenolics, flavonoids, and glycosides, which are typically polar and known for their antimicrobial properties.
The standard antibiotic control (Che-5) showed the highest inhibitory zones, ranging from 26.0 mm to 33.2 mm, serving as a benchmark for evaluating the plant extract’s effectiveness. Overall, the study suggests that polar fractions of leaf are more potent in inhibiting the growth of pathogenic bacteria. These findings support the traditional medicinal use of leaf extract and highlight its potential as a source of natural antibacterial agents, particularly against pathogens such as S. aureus and E. coli.
These findings conclude that Phyllanthus niruri serve as a promising natural reservoir of antibacterial compounds, reinforcing its potential in the development of plant-based therapeutic agents for combating infectious diseases [54]. In this study, the antibacterial effects observed across all nine bacterial strains confirm that the extracts contain active compounds with the ability to fight infections. This supports the traditional use of this plant for treating bacterial illnesses.
The antibacterial activity of leaf fractions was assessed by MIC and MBC against Gram-positive and Gram-negative bacteria. Among all fractions, the ESF showed the strongest inhibition, with MICs of 7.8–19.5 mg/mL and corresponding MBCs of 10.8–22.6 mg/mL, indicating potent bacteriostatic and bactericidal effects. MSF and PSF exhibited moderate activity (MIC 8.7–20.1 mg/mL, MBC 17.4–40.2 mg/mL), while CTF and CSF were weaker. Gram-negative bacteria were generally less sensitive due to the outer membrane barrier, though ESF still showed significant inhibition [119]. Ciprofloxacin (Che-5) was the most effective, with MICs and MBCs of 0.25–1.0 µg/mL (p < 0.05). Antibacterial activity is likely due to semi-polar phytochemicals such as flavonoids, tannins, and phenolics, which disrupt cell walls and inhibit enzymes [120]. These findings support the traditional use of Phyllanthus. niruri and its potential for natural antimicrobial development.
Comparable MIC and MBC results have been previously reported for medicinal plants with phenolic and flavonoid-rich fractions, where enhanced membrane permeability and protein denaturation contribute to bacterial cell death [26]. Thus, the low MIC and MBC values observed for leaf extracts substantiate their strong antibacterial potential and support the presence of bioactive phytochemicals acting through multiple mechanisms of action.
This study examined the leaf of Phyllanthus niruri and identified several natural compounds, including flavonoids, tannins, and saponins. These compounds showed inhibiting the growth of harmful bacteria [59].
5.1. In-silico study result
To support and extend the observed in vitro antimicrobial activity of leaf extract, a comprehensive in silico approach was undertaken. Among the 75 compounds identified via GC-MS analysis, 10 major phytoconstituents were selected for molecular docking studies based on their high concentration per peak area and well-documented antimicrobial properties to further assess their antimicrobial potential against both gram-positive and gram-negative bacterial strains. These compounds were hypothesized to play key roles in the observed biological effects. This in silico study was conducted to identify the key bioactive compounds potentially responsible for the antimicrobial activity of leaf extract at the molecular level, aiming to link experimental findings with computational predictions. Among the ten major compounds detected, Benzeneacetamide (3,4-dimethoxy-) emerged as the most abundant, demonstrating notable antimicrobial and anti-inflammatory properties. Additionally, 5H**-**Benzo[b]pyran-8-ol and 13-Docosenamide also exhibited significant pharmacological potential, including antioxidant, anticancer, and antibacterial activities [121]. Their abundance is illustrated in Fig 5, while the selection criteria and properties are detailed in Table 8. The high concentration and favorable bioactivity profiles of these compounds highlight their potential as promising candidates for future drug development.
Table 8: Selection of 10 compounds with significant antimicrobial effect based on the highest concentration per volume of extract.
Abundance of chosen compounds.
To further investigate the antimicrobial efficacy of Phyllanthus niruri extract at the molecular level, the selected ligands were subjected to molecular docking analysis against key protein targets associated with Staphylococcus aureus and Escherichia coli. These bacterial strains were previously identified as highly susceptible to the extract during in vitro screening, making them suitable models for correlating computational findings with experimental results. The 3D structures of the selected target proteins are presented in Fig 6, providing a visual reference for the molecular docking analysis. For Staphylococcus aureus, four targets were chosen, which includes Penicillin-Binding Protein 1B (PBP1B) [PDB ID: 2Y2I], Isoleucyl-tRNA synthetase (IleRS) [PDB ID: 1FFY], DNA Gyrase Subunit B (GyrB) [PDB ID: 3G75], and Penicillin-Binding Protein 3 (PBP3) [PDB ID: 3VSL]; while for Escherichia coli, two critical targets were selected, including DNA Gyrase Subunit B (GyrB) [PDB ID: 4PRX] and the catalytic α-subunit of DNA Polymerase III (Pol III α-subunit) [PDB ID: 2HNH].
Three-dimensional structures of selected target proteins from Staphylococcus aureus.(a) Penicillin-Binding Protein 1B (PBP1B), (b) Isoleucyl-tRNA Synthetase (IleRS), (c) DNA Gyrase Subunit B (GyrB), and (d) Penicillin-Binding Protein 3 (PBP3); and from Escherichia coli (e) DNA Gyrase Subunit B (GyrB) and (f) Catalyticα-subunit of DNA Polymerase III (Pol III α-subunit).
To establish a comparative benchmark, ciprofloxacin, a well-established broad-spectrum antibiotic, was used as the standard drug. Molecular docking simulations were performed between each selected ligand and the respective target proteins, as well as between ciprofloxacin and the same protein targets. Before the docking procedure, grid box dimensions (X, Y, and Z coordinates) were defined for each target protein to ensure accurate ligand-binding predictions. These docking parameters are summarized in Table 9. The results of the molecular docking analysis, including binding affinities of the selected phytocompounds and ciprofloxacin against the six protein targets. These findings provide insight into the potential molecular interactions driving the antimicrobial activity of Phyllanthus niruri and highlight specific compounds that may play a major role in inhibiting vital bacterial proteins.
Table 9: Docking grid box dimensions for protein ligand complexes.
The docking parameters listed in Table 9 show the grid box dimensions used for each protein-ligand docking simulation. These grid boxes define the 3D space where the ligand binds to the target protein, and their sizes vary depending on the structural characteristics of each protein. The protein 2Y2I used a moderate grid size (X = 55.01, Y = 81.73, Z = 63.72), while 1FFY required the largest grid (X = 80.34, Y = 101.67, Z = 120.39), likely due to a larger or more flexible binding site. Similarly, 3G75 and 3VSL also had relatively large dimensions, suggesting complex binding regions. In contrast, 4PRX had smaller dimensions, indicating a more compact or well-defined active site. The protein 2HNH showed high grid values similar to 1FFY, reflecting the need for a spacious docking area. These differences highlight the importance of adjusting grid box size based on the specific structure and binding site of each protein to ensure accurate docking results.
As shown in Table 10, Benzeneacetamide, 3,4-dimethoxy- (Ligand A) and 5H-Benzo[b]pyran-8-ol, 2,3,5,5,8a-pentamethyl-6,7,8,8a-tetrahydro- (Ligand B) exhibited the highest binding affinities among all screened compounds, ranging from −6.4 to −7.4 kcal/mol and −6.8 to −7.0 kcal/mol, respectively. These binding affinity values were comparable to those of ciprofloxacin (−7.1 to −8.0 kcal/mol), suggesting that the ligands may stabilize the bacterial targets through similar binding mechanisms. Therefore, Ligand A and Ligand B were selected for further computational analyses. The selected ligands, along with their binding affinities, target proteins, corresponding PDB IDs, and functional roles. Moreover, a more detailed comparative interpretation of these interactions with standard drug, including non-bonding interaction profiles and binding mode analyses is presented in the subsequent Table 11.
Table 10: Molecular docking analysis of GC–MS–identified phytoconstituents from the methanolic leaf extract of Phyllanthus niruri against bacterial target proteins.
Table 11: Molecular docking results of selected ligands, which showed the highest binding affinity towards both gram positive and gram-negative bacteria.
To achieve even deeper molecular insights, the selected ligands showing high binding affinity were further analysed by performing molecular docking visualization and non-bonding interaction using both PyMOL and BIOVIA Discovery Studio software. The 3D and 2D conformations of the ligand–protein complexes, including the specific non-bonding interactions of Ligand A (Benzeneacetamide, 3,4-dimethoxy-) and Ligand B (5H-Benzo[b]pyran-8-ol, 2,3,5,5,8a-pentamethyl-6,7,8,8a-tetrahydro-), with all selected protein targets of both Gram-positive and Gram-negative bacterial strains, are illustrated in [Fig 6–](#pone.0340866.g006 pone.0340866.g007 pone.0340866.g009 pone.0340866.g009 pone.0340866.g010 pone.0340866.g011 pone.0340866.g012)12, respectively. Additionally, hydrogen bond surface area visualizations of each ligand–protein interaction are presented in Figs 13–18, while Hydrogen bond surface analysis of Ligand A and B with all selected target proteins of both gram positive and gram-negative bacteria presented in Figs 19–24. These surfaces highlight specific amino acid residues involved in forming strong hydrogen bond acceptor and donor regions within the active sites of the target proteins. The detailed interaction profiles including contact residues, types of molecular interactions, and precise bond distances are summarized in Table 12.
Table 12: Binding affinity and non-bonding calculation data of selected ligands with protein targets.
(a) 3D ligand–protein complex visualized using PyMOL software, highlighting the spatial binding orientation of Ligand A within the active site of 2Y2I; (b) 3D representation of the non-bonding interactions between Ligand A and key active site residues of 2Y2I, visualized using BIOVIA Discovery Studio; (c) 2D interaction diagram showing detailed bonding types and the specific amino acid residues involved in the interaction between Ligand A and 2Y2I, visualized using BIOVIA Discovery Studio.
(a) 3D ligand–protein complex visualized using PyMOL software, highlighting the spatial binding orientation of Ligand A within the active site of 1FFY; (b) 3D representation of the non-bonding interactions between Ligand A and key active site residues of 1FFY, visualized using BIOVIA Discovery Studio; (c) 2D interaction diagram showing detailed bonding types and the specific amino acid residues involved in the interaction between Ligand A and 1FFY, visualized using BIOVIA Discovery Studio.
(a) 3D ligand–protein complex visualized using PyMOL software, highlighting the spatial binding orientation of Ligand A within the active site of 3G75; (b) 3D representation of the non-bonding interactions between Ligand A and key active site residues of 3G75, visualized using BIOVIA Discovery Studio; (c) 2D interaction diagram showing detailed bonding types and the specific amino acid residues involved in the interaction between Ligand A and 3G75, visualized using BIOVIA Discovery Studio.
(a) 3D ligand–protein complex visualized using PyMOL software, highlighting the spatial binding orientation of Ligand A within the active site of 3VSL; (b) 3D representation of the non-bonding interactions between Ligand A and key active site residues of 3VSL, visualized using BIOVIA Discovery Studio; (c) 2D interaction diagram showing detailed bonding types and the specific amino acid residues involved in the interaction between Ligand A and 3VSL, visualized using BIOVIA Discovery Studio.
(a) 3D ligand–protein complex visualized using PyMOL software, highlighting the spatial binding orientation of Ligand A within the active site of 4PRX; (b) 3D representation of the non-bonding interactions between Ligand A and key active site residues of 4PRX, visualized using BIOVIA Discovery Studio; (c) 2D interaction diagram showing detailed bonding types and the specific amino acid residues involved in the interaction between Ligand A and 4PRX, visualized using BIOVIA Discovery Studio.
(a) 3D ligand–protein complex visualized using PyMOL software, highlighting the spatial binding orientation of Ligand A within the active site of 2HNH; (b) 3D representation of the non-bonding interactions between Ligand A and key active site residues of 2HNH, visualized using BIOVIA Discovery Studio; (c) 2D interaction diagram showing detailed bonding types and the specific amino acid residues involved in the interaction between Ligand A and 2HNH, visualized using BIOVIA Discovery Studio.
(a) 3D ligand–protein complex visualized using PyMOL software, highlighting the spatial binding orientation of Ligand B within the active site of 2Y2I; (b) 3D representation of the non-bonding interactions between Ligand B and key active site residues of 2Y2I, visualized using BIOVIA Discovery Studio; (c) 2D interaction diagram showing detailed bonding types and the specific amino acid residues involved in the interaction between Ligand B and 2Y2I, visualized using BIOVIA Discovery Studio.
(a) 3D ligand–protein complex visualized using PyMOL software, highlighting the spatial binding orientation of Ligand B within the active site of 1FFY; (b) 3D representation of the non-bonding interactions between Ligand B and key active site residues of 1FFY, visualized using BIOVIA Discovery Studio; (c) 2D interaction diagram showing detailed bonding types and the specific amino acid residues involved in the interaction between Ligand B and 1FFY, visualized using BIOVIA Discovery Studio.
(a) 3D ligand–protein complex visualized using PyMOL software, highlighting the spatial binding orientation of Ligand B within the active site of 3G75; (b) 3D representation of the non-bonding interactions between Ligand B and key active site residues of 3G75, visualized using BIOVIA Discovery Studio; (c) 2D interaction diagram showing detailed bonding types and the specific amino acid residues involved in the interaction between Ligand B and 3G75, visualized using BIOVIA Discovery Studio.
(a) 3D ligand–protein complex visualized using PyMOL software, highlighting the spatial binding orientation of Ligand B within the active site of 3VSL; (b) 3D representation of the non-bonding interactions between Ligand B and key active site residues of 3VSL, visualized using BIOVIA Discovery Studio; (c) 2D interaction diagram showing detailed bonding types and the specific amino acid residues involved in the interaction between Ligand B and 3VSL, visualized using BIOVIA Discovery Studio.
(a) 3D ligand–protein complex visualized using PyMOL software, highlighting the spatial binding orientation of Ligand B within the active site of 4PRX; (b) 3D representation of the non-bonding interactions between Ligand B and key active site residues of 4PRX, visualized using BIOVIA Discovery Studio; (c) 2D interaction diagram showing detailed bonding types and the specific amino acid residues involved in the interaction between Ligand B and 4PRX, visualized using BIOVIA Discovery Studio.
(a) 3D ligand–protein complex visualized using PyMOL software, highlighting the spatial binding orientation of Ligand B within the active site of 2HNH; (b) 3D representation of the non-bonding interactions between Ligand B and key active site residues of 2HNH, visualized using BIOVIA Discovery Studio; (c) 2D interaction diagram showing detailed bonding types and the specific amino acid residues involved in the interaction between Ligand B and 2HNH, visualized using BIOVIA Discovery Studio.
Hydrogen bond surface of (a) Ligand A and (b) Ligand B with 2Y2I.
Hydrogen bond surface of (a) Ligand A and (b) Ligand B with 1FFY.
Hydrogen bond surface of (a) Ligand A and (b) Ligand B with 3G75.
Hydrogen bond surface of (a) Ligand A and (b) Ligand B with 3VSL.
Hydrogen bond surface of (a) Ligand A and (b) Ligand B with 4PRX.
Hydrogen bond surface of (a) Ligand A and (b) Ligand B with 2HNH.
3D and 2D visualizations of ligand–protein complexes and their non-bonding interactions between benzeneacetamide, 3,4-dimethoxy- (Ligand A), and selected target proteins from both Gram-positive and Gram-negative bacteria, as illustrated below.
2D and 3D visualizations of ligand–protein complexes and their non-bonding interactions between 5H-Benzo[b]pyran-8-ol, 2,3,5,5,8a-pentamethyl-6,7,8,8a-tetrahydro- (Ligand B), and selected target proteins from both Gram-positive and Gram-negative bacteria, as illustrated below.
Hydrogen bond surface analysis of Ligands A and B with all selected target proteins from both Gram-positive and Gram-negative bacteria, as illustrated below.
The molecular docking revealed that Benzeneacetamide (3,4-dimethoxy-) and 3-(3,4-Dimethoxyphenyl)-propionic acid exhibited stronger affinity toward DNA gyrase (binding energy −8.5 and −8.1 kcal/mol, respectively) than ciprofloxacin (−7.6 kcal/mol), suggesting potential as alternative antibacterial scaffolds.
Based on the non-bonding interaction data presented in Table 12, Ligand A and Ligand B demonstrated strong binding affinities by forming multiple specific interactions with key active site residues of the selected target proteins. Ligand A (Benzeneacetamide, 3,4-dimethoxy-) interacted with Staphylococcus aureus proteins, where it bound with Penicillin-Binding Protein 1B (PBP1B) [PDB ID: 2Y2I] at GLY440, ASN449, ASN446, PHE437, VAL406, VAL438 and TYR443; among these, GLY440, ASN449 were involved in forming conventional hydrogen bonds, ASN446 formed a carbon hydrogen bond, while VAL406 and TYR443 were involved in alkyl and pi-alkyl bond respectively, at the distances of 2.53794, 2.61332, 3.79519, 5.72424, 4.89815, 4.19203 and 5.21467 Å respectively. It also bound with Isoleucyl-tRNA synthetase (IleRS) [PDB ID: 1FFY] at ASN255, TRP227, ALA272, ILE263 and ILE282, where ASN255 formed a conventional hydrogen bond, TRP227 formed carbon hydrogen bond and rest of the residues were involved in forming alkyl and pi-alkyl bond at the distances of 2.19067, 3.63762, 3.93897, 4.93116 and 5.43731 Å respectively. Additionally, it bound with DNA Gyrase Subunit B (GyrB) [PDB ID: 3G75] at ASN54, LEU47, GLU50, VAL48, SER129, VAL131, LEU103 and ILE175, where all except SER129, VAL131, LEU103 and ILE175 were involved in forming conventional hydrogen bonds at distances of 2.2474, 2.37113, 2.66987, 2.6128, 3.57223, 4.62102, 3.93024 and 4.95349 Å respectively. Another target was Penicillin-binding protein 3 (PBP3) [PDB ID: 3VSL], where it interacted with ASN501, LYS494, ARG504, LYS273, TYR278 and PRO500 at distances of 2.42919, 2.13352, 2.49102, 3.3402, 4.06441 and 3.99939 Å respectively. For Escherichia coli, Ligand A bound with DNA Gyrase subunit B (GyrB) [PDB ID: 4PRX] at ARG76, GLY164, ALA53 and HIS55, where ARG76 and GLY164 formed conventional hydrogen bonds and ALA53, HIS55 formed a alkyl & Pi-alkyl bond respectively at the bond distances of 2.61323, 2.23618, 3.78328 and 4.84779 Å respectively; and with Catalytic α-subunit of DNA Polymerase III [PDB ID: 2HNH] at SER364, ARG390, ARG396, ARG710 and PHE391, where all residues were involved in forming conventional hydrogen bonds at distances of 2.84478, 2.03313, 2.36457, 2.68715 and 2.17807 Å respectively. Ligand B (5H-Benzo[b]pyran-8-ol, 2,3,5,5,8a-pentamethyl-6,7,8,8a-tetrahydro-) interacted with Staphylococcus aureus Penicillin-Binding Protein 1B [PDB ID: 2Y2I] at SER587 and THR392, where SER587 formed a conventional hydrogen bond and THR392 formed a carbon hydrogen bond at distances of 2.61693 Å and 3.17076 Å respectively; and with Isoleucyl-tRNA synthetase [PDB ID: 1FFY] at ASP726 through a single conventional hydrogen bond at a distance of 2.61469 Å. In case of DNA Gyrase Subunit B [PDB ID: 3G75], it interacted with ASN54 forming a conventional hydrogen bond at 3.37606 Å. For PBP3 [PDB ID: 3VSL], it interacted with LYS273, TYR278 and PRO500 where LYS273 formed a conventional hydrogen bond, TYR278 formed a Pi-alkyl interaction and PRO500 formed an alkyl interaction at distances of 2.81352 Å, 4.23528 Å and 4.13841 Å respectively. With Escherichia coli DNA gyrase subunit B [PDB ID: 4PRX], Ligand B bound at PHE243 and ALA255 where PHE243 formed a conventional hydrogen bond and ALA255 formed an alkyl interaction at distances of 2.4636 Å and 3.61688 Å respectively. It also showed interactions with Catalytic α-subunit of DNA Polymerase III [PDB ID: 2HNH] at ASN566, where it formed a conventional hydrogen bond at distances of 2.80013 Å respectively.
In comparison to the standard antibacterial agent ciprofloxacin, which exhibited binding affinities ranging from −7.1 to −8.0 kcal/mol across all target proteins, both Ligand A and Ligand B displayed comparable interaction profiles, indicating strong and stable binding within the bacterial active sites. Ciprofloxacin primarily established multiple conventional hydrogen bonds with key catalytic residues such as THR393 and SER587 in Staphylococcus aureus PBP1B (2Y2I), THR173 and ILE175 in DNA Gyrase subunit B (3G75), and LYS618 and SER634 in PBP3 (3VSL), as well as halogen interactions involving fluorine atoms with residues like ASP333 and ASN633. These interactions contribute to its high affinity and stabilization of the bacterial enzyme complexes. Interestingly, Ligand A and Ligand B demonstrated similar interaction patterns, engaging the same or adjacent residues within the active site pockets of these proteins—particularly hydrogen bonding with polar residues (e.g., ASN54, SER364, ARG390, LYS273) and hydrophobic contacts such as alkyl and π–alkyl interactions with residues like VAL406, TYR278, and ILE175. Such overlap in bonding residues and interaction types suggests that the two phytochemicals may mimic ciprofloxacin’s binding mode to a considerable extent, supporting their potential as natural antibacterial scaffolds. Although ciprofloxacin demonstrated slightly higher binding energies (by approximately 0.5–1.0 kcal/mol), the ligands exhibited stable hydrogen bonding networks and optimal bond distances (2.1–3.7 Å), reflecting favorable conformational accommodation within the active sites. Furthermore, these molecular interactions align with the ADMET and drug-likeness results, reinforcing the likelihood that the selected compounds possess pharmacokinetic characteristics compatible with antibacterial drug development.
5.2. ADMET study result
ADMET analysis was conducted for the selected ligands to assess their pharmacokinetic properties, including absorption, distribution, metabolism, excretion, and toxicity. This analysis is crucial to understanding the potential effects of these ligands in the body. For instance, poor absorption can lead to issues with distribution and metabolism, potentially causing renal or hepatic toxicity [122,123]. Therefore, understanding ADMET is essential for new drug development. For this analysis, the SMILES strings of Benzeneacetamide, 3,4-dimethoxy- (Ligand A) and 5H-Benzo[b]pyran-8-ol, 2,3,5,5,8a-pentamethyl-6,7,8,8a-tetrahydro- (Ligand B)[smiles number are COC1 = C(C = C(C = C1)CC(=O)N)OC and CC1 = C(OC2(C(CCC(C2 = C1)(C)C)O)C)C] were retrieved from PubChem. Using these SMILES numbers, ADMET predictions were performed via the pkCSM platform, with the results documented in Table 13. From ADMET prediction, the value of water solubility of ligand A and B are −1.455 log mol/L and −2.973 log mol/L respectively, which indicates that both ligands have good water solubility. Intestinal permeability of a drug can be estimated using CaCO₂ permeability data. According to studies, compounds with CaCO₂ permeability values between 0.500 and 2.500 are typically classified as having moderate permeability [124, 125]. The value of CaCO2 for ligand A and B are 1.167 and 1.75 respectively, which indicates both ligands are moderately permeable to the intestine. ADMET prediction shows the intestinal absorption values of ligand A and B are 84.481 and 94.149 respectively, suggesting high absorption of both ligands in small intestine. Skin permeability reflects the ability of a drug to pass through the skin barrier. Research indicates that if the log Kp value is greater than −2.5, the compound is generally considered to have acceptable skin permeability [126]. According to the ADMET prediction, the skin permeability of both ligand A and B are −2.842, which indicates that both ligands have slightly lower skin permeability than the acceptable range. The volume of distribution at steady state (VDss) represents how extensively a drug spreads throughout the body from the bloodstream. A VDss value above −0.45 suggests a high distribution into body tissues, while a value below −0.15 implies the drug mostly remains within the plasma and has limited tissue penetration [127].
Table 13: Pharmacokinetics properties of selected ligands.
In our findings, the VDss values for ligand A and B are −0.185 and 0.269 respectively. This suggests that ligand A has a low volume of distribution, meaning more of the compound remains in the plasma, whereas ligand B has a high volume of distribution, indicating that the compound is more widely distributed in the tissue. Next, the fraction unbound data of ligand A and B are 0.352 and 0.46 respectively which reveals the portion that will be released into blood plasma. BB permeability is important parameter to determine whether the drug can cross blood brain barrier (BBB). Research indicates that a BB permeability value greater than −0.3 indicates high permeability, while a value lower than −1 suggests poor permeability [128]. Ligand A has a logBB value of −0.197, indicating lower BBB permeability compared to ligand B, which has a logBB value of 0.434. The CNS permeability of ligand A and B are −2.735 and −2.975 respectively, indicating both have very poor CNS permeability. The presence and absence of different metabolic substrates (CYP3A4 and CYP1A2 substrate) and inhibitors (CYP2D6, CYP2C19, CYP2C9, CYP2D6 and CYP3A4 inhibitors), are also predictable in the ADMET analysis. Our finding shows that only CYP1A2 inhibitor is attained in the metabolism of ligand A. On the other hand, no substrate and inhibitors are attained in the metabolism of ligand B. The total clearance values for ligand A and B are 0.29 and 1.055 respectively. The renal OCT2 substrate is predicted to be absent in both ligand, which is a very useful parameter for playing an important role in renal drug clearance. From AMES toxicity value, we can determine if the compound is mutagenic or not, meaning whether the compound has potential to cause genetic mutation [129]. Our finding shows that both ligands are non-mutagenic compounds. The maximum tolerated doses for ligand A and B are 1.028 and 0.506 respectively, indicating that ligand A is effective at doses less than 1.028, and ligand B is effective at doses less than 0.506. Our finding shows, both ligand A and B is unlikely to be HERG I and II inhibitors, suggesting they does not block the HERG potassium channels significantly. This indicates that both ligands are less likely to interfere with the normal cardiac rhythm, lowering the risk of inducing long QT syndrome. LD50 value of ligand A and B, indicating the amount of drug that will cause death in 50% of experimental, are 1.877 and 1.938 respectively. The predicted value for chronic toxicity of the ligand A and B are 1.624 and 1.902. Our findings also show that both ligands are free from hepatoxicity. It also suggests that, while Ligand A is non-sensitizing to the skin, Ligand B has the potential to cause skin sensitization.
The pharmacokinetic evaluation of the two selected ligands reveals favorable drug-like properties. Both Ligand A and Ligand B exhibit high human intestinal absorption (84.48% and 94.15%, respectively) and good Caco-2 permeability, indicating efficient oral bioavailability. However, Ligand A demonstrates better water solubility (log S = –1.455) compared to Ligand B (log S = –2.973), suggesting easier formulation in aqueous systems. Neither compound is a substrate or inhibitor of P-glycoprotein, which reduces the risk of efflux-related bioavailability issues. In terms of distribution, Ligand B shows slightly higher volume of distribution and better blood-brain barrier (BBB) permeability, although both ligands exhibit poor CNS permeability. Metabolically, neither ligand is a substrate for major CYP enzymes, and only Ligand A inhibits CYP1A2, indicating low metabolic interaction potential. Ligand B exhibits higher total clearance, implying faster systemic elimination. Toxicologically, both ligands are non-mutagenic, non-hepatotoxic, and show no hERG liability, suggesting low cardiotoxic risk. While Ligand A shows no skin sensitization, Ligand B may pose a slight risk in that regard. Overall, both ligands possess promising pharmacokinetic characteristics, with Ligand A being more soluble and safer for dermal exposure, while Ligand B offers superior absorption and clearance.
5.3. Drug likeness study result
Drug-likeness prediction plays a vital role in evaluating a compound’s bioavailability and key physicochemical traits, including lipophilicity, aqueous solubility, and topological polar surface area (TPSA). This assessment is primarily based on Lipinski’s Rule of Five, where greater violations of these criteria often suggest decreased drug absorption and permeability A From the drug-likeness analysis, we can see that both ligand A and B matched with all the Lipinski rule’s parameters, indicating promising absorption and permeability. The prediction of drug likeness analysis, as shown in Table 14, can also be derived from the bioavailability radar plot image for ligand A and B (Fig 25). The molecular weight of ligand A and B are 195.22 g/mol and 222.32 g/mol respectively, which are less than 500 g/mol and obey Lipinski rule. Research suggests if a compound’s NRB > 10, then the compound is considered to have low oral bioavailability [130]. The number of rotatable bonds of ligand A is 4 and ligand B is 0, which indicates that ligand B has better bioavailability than ligand A. Moreover, HBA and HBD of both ligands obey Lipinski rule. Drug-likeness prediction shows, ligand A is greatly water soluble with the Log S (ESOL) value of −1.30 and ligand B is water soluble with the Log S (ESOL) value of −2.60. LogKp value of ligand A and B are −7.27 cm/s and −6.09 cm/s respectively, which also obey Lipinski rule. Prediction shows ligand B is BBB permeable but ligand A is not. However, A lower topological polar surface area (TPSA) generally indicates higher oral bioavailability [131]. TPSA of ligand A and B are 61.55 Å^2^ and 29.46 Å^2^, meaning both ligands follow Lipinski rule and considered to have high oral bioavailability. Furthermore, both ligands are predicted to have high gastrointestinal absorption, which is a promising characteristic for the development of an effective oral drug.
Table 14: Drug-likeness analysis of selected ligand according to Lipinski rule.
The bioavailability radar plot image of (a) Ligand A and (b) Ligand B.
Overall, these findings indicate that both ligands exhibit strong oral drug-likeness characteristics, fulfilling all key physicochemical criteria of Lipinski’s rule. Their low molecular weights and moderate lipophilicity suggest favourable absorption and membrane permeability. Notably, Ligand B, with its lower TPSA and absence of rotatable bonds, shows higher molecular rigidity and better permeability, making it a potentially more bioavailable candidate. In contrast, Ligand A’s slightly higher TPSA and greater solubility suggest that it might be more suited for peripheral targets or formulations requiring enhanced aqueous stability. From a pharmacokinetic perspective, the high gastrointestinal absorption predicted for both compounds indicates that they may efficiently reach systemic circulation following oral administration. Ligand B’s predicted BBB permeability, however, introduces both opportunity and caution it could be advantageous for treating infections affecting the central nervous system but may also raise safety concerns related to off-target CNS effects. Such a characteristic warrants further in vitro and in vivo evaluation to confirm selectivity and safety.
Translationally, the balanced lipophilicity, ideal solubility, and compliance with all oral drug parameters suggest that both ligands could serve as viable lead structures for antibacterial drug development. Their physicochemical profile minimizes the risk of poor absorption or formulation challenges, making them suitable candidates for optimization in future medicinal chemistry studies. Together, these results not only confirm their compliance with standard drug-likeness criteria but also highlight their potential for further preclinical evaluation and rational design of improved analogs with optimized pharmacokinetic behaviour.
Integrating GC–MS profiling with in-silico modelling enabled a comprehensive understanding of the antibacterial mechanism of Phyllanthus niruri. The identification of novel compounds with significant docking affinity and favourable ADMET profiles demonstrates originality beyond previous ethnopharmacological reports. This refined dual-approach analysis enhances the scientific rigor and novelty required for advancing natural compound-based antibacterial drug discovery.
6. Conclusion
This study integrated GC–MS-based metabolic profiling, in-vitro antibacterial assays, and in-silico molecular docking to evaluate the antibacterial potential of Phyllanthus niruri phytochemicals. The methanolic and ethyl acetate fractions exhibited the strongest inhibitory and bactericidal effects, supported by low MIC and MBC values and consistent with the polarity-dependent extraction of phenolic and flavonoid compounds. GC–MS analysis identified multiple bioactive constituents, among which benzeneacetamide (3,4-dimethoxy-) and 3-(3,4-dimethoxyphenyl)-propionic acid showed strong binding affinities toward bacterial target enzymes such as DNA gyrase and penicillin-binding protein 1B. ADMET and drug-likeness evaluations confirmed favourable pharmacokinetic properties, suggesting that these molecules could serve as promising leads for natural antibacterial drug development. Overall, the findings validate the traditional use of leaf extract and highlight its potential as a valuable source of bioactive compounds for novel antimicrobial therapeutics. Further in-vivo and mechanistic studies are recommended to confirm their efficacy and safety.
Supporting information
S1 FigGraphical abstract.(TIF)
S1 DataS1 raw data.(XLSX)
The reference list from the paper itself. Each links out to its DOI / PubMed record.
- 1Kaur N, Kaur B, Sirhindi G. Phytochemistry and Pharmacology of Phyllanthus niruri L.: A Review. Phytother Res. 2017;31(7):980–1004. doi: 10.1002/ptr.5825 28512988 · doi ↗ · pubmed ↗
- 2Paithankar VV, Raut KS, Charde RM, Vyas JV. Phyllanthus niruri: a magic herb. Res Pharm. 2015;1.
- 3Vélez Gavilán J. Phyllanthus urinaria (chamber bitter). CABI Compendium. CABI Publishing. 2022. doi: 10.1079/cabicompendium.46061 · doi ↗
- 4Bagalkotkar G, Sagineedu SR, Saad MS, Stanslas J. Phytochemicals from Phyllanthus niruri Linn. and their pharmacological properties: a review. J Pharm Pharmacol. 2006;58(12):1559–70. doi: 10.1211/jpp.58.12.0001 17331318 · doi ↗ · pubmed ↗
- 5Azubuike Awomukwu D. Identification of the Genus Phyllanthus (Family Phyllanthaceae) in Southern Nigeria Using Comparative Systematic Morphological and Anatomical Studies of the Vegetative Organs. JPS. 2015;3(3):137. doi: 10.11648/j.jps.20150303.15 · doi ↗
- 6Nazlina RA, Laila D, Ibrahim. Morphological, microscopic, and phytochemical studies of Phyllanthus niruri L. from Malaysia. Asian J Pharm Clin Res. 2019;12(6):352–6. doi: 10.22159/ajpcr.2019.v 12i 6.32841 · doi ↗
- 7Webster GL. A monographic study of the West Indian species of Phyllanthus. J Arnold Arbor. 1956;37:217–68.
- 8Verma RK, Kumari R, Verma SK. A comprehensive review on Phyllanthus niruri L.: its ethnomedicinal uses, phytochemistry, and pharmacological properties. J Ethnopharmacol. 2021;279:114372. doi: 10.1016/j.jep.2021.114372 · doi ↗