Analysis of the impact of vegetation cover variation on pollution levels in the La Caimanera marsh (Colombia) using remote sensing and sensor imagen
Carlos Segundo Cohen-Manrique, Jhonatan Andrés Rodríguez-Manrique, Andrea Fernanda Burbano-Bustos, Javier Andrés Castro-Rodríguez, Shakila Merchant, Ronggo Sadono, Adhe Viana Yulida Putri

TL;DR
This study examines how changes in vegetation cover affect pollution levels in a Colombian marsh using satellite and sensor data.
Contribution
The study introduces a method combining remote sensing and machine learning to assess mangrove ecosystem health and pollution dynamics.
Findings
The La Caimanera marsh showed stable vegetation cover and water quality from 2010 to 2020, with slight changes in 2023.
Mature mangrove trees made up 83% of the vegetation, indicating a healthy and resilient ecosystem.
Increases in chlorophyll-a and decreases in turbidity in 2023 suggest shifts in water quality.
Abstract
Mangroves are ecosystems that link freshwater, land, and oceans. They are also home to vast biodiversity of species and provide vital resources to many coastal communities worldwide. However, in various parts of the world, these natural ecosystems have been subjected to anthropogenic actions that compromise their subsistence. Therefore, the objective of this study was to analyze the impact of vegetation cover variation on pollution levels in the La Caimanera marsh (Colombia) using remote sensing and sensor images. Methodologically, machine learning techniques were used, including semi-supervised and supervised learning, using Landsat, Copernicus, and Planet images. The influence of mangrove vegetation cover on pollutants was explored using remote sensing data and in-situ measurements. The results obtained indicated that in 2015 and 2024, the ecosystem showed stability, with slight…
Genes, proteins, chemicals, diseases, species, mutations and cell lines named across the full text — each resolved to its canonical identifier and authoritative record.
Click any figure to enlarge with its caption.
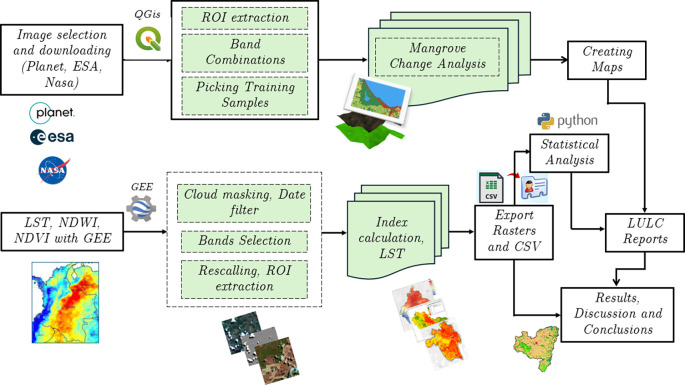 Figure 1
 Figure 2
 Figure 3
 Figure 4
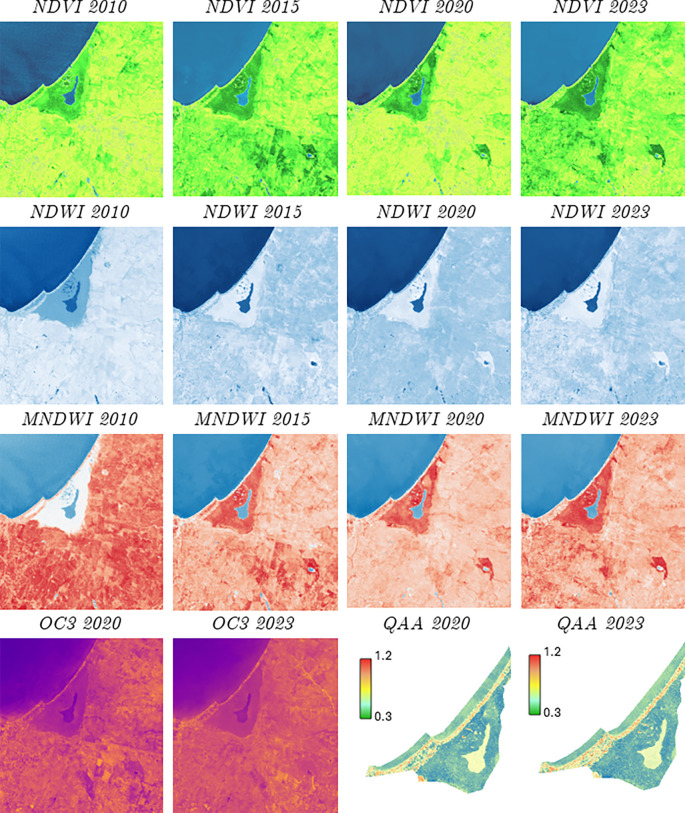 Figure 5
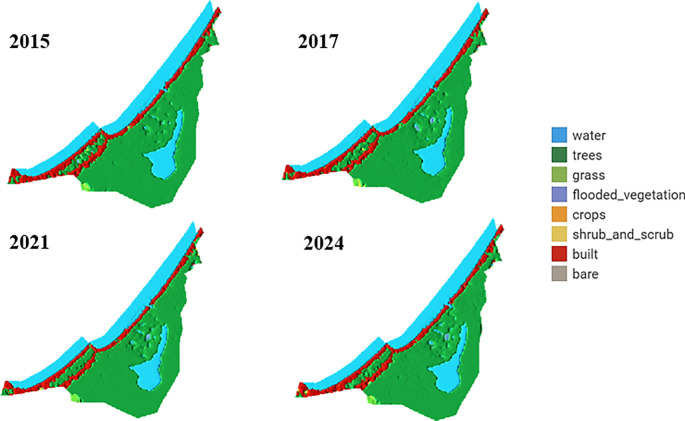 Figure 6
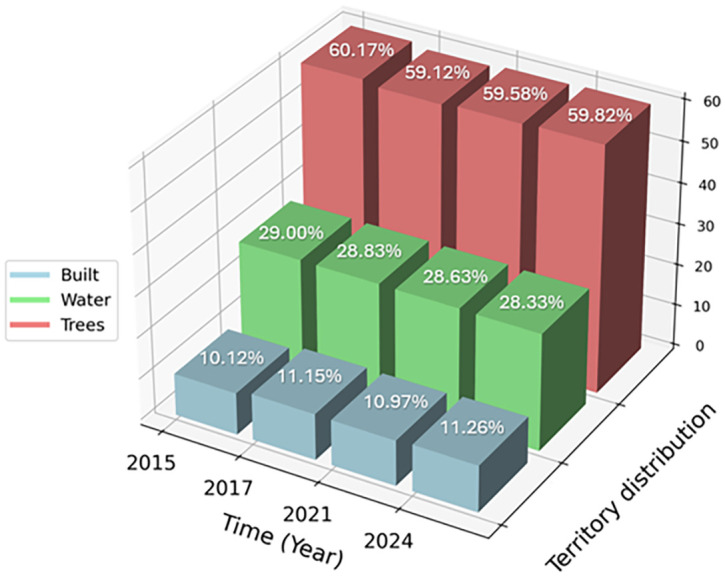 Figure 7
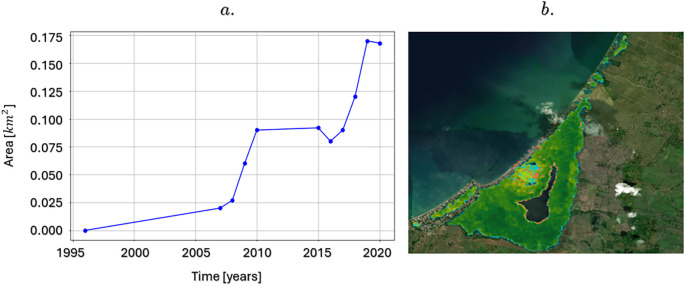 Figure 8
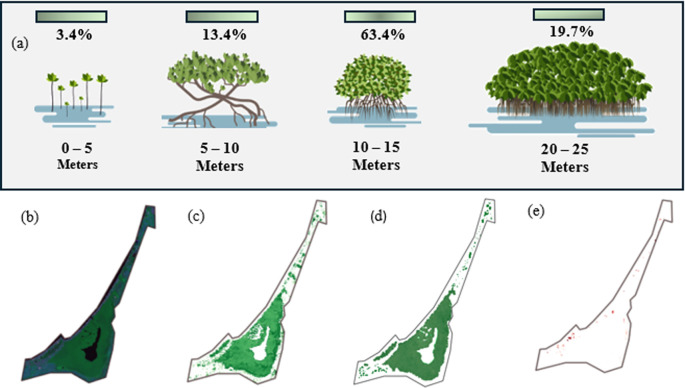 Figure 9
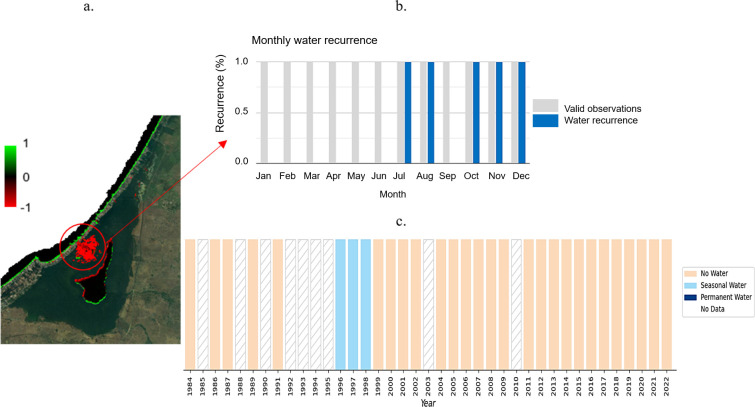 Figure 10
Peer Reviews
No public reviews on file for this paper yet. If you reviewed it on a platform where reviews are public (OpenReview, ICLR, NeurIPS, ICML), you can paste yours below so the community can read it here.
Videos
No videos yet. Explain this paper in a talk, walkthrough, or lecture? Add one.
Taxonomy
TopicsFlood Risk Assessment and Management · Land Use and Ecosystem Services · Remote Sensing and LiDAR Applications