Deviations from additivity in APOE4-mediated late-onset Alzheimer’s disease risk across races and ethnicities
Razaq O. Durodoye, Timothy H. Ciesielski, Penelope Benchek, Jacquelaine Bartlett, Xiaofeng Zhu, Shiying Liu, Adam Naj, Brian Kunkle, Gerard D. Schellenberg, Richard Mayeux, Lindsay Farrer, Li-San Wang, Margaret A. Pericak-Vance, Farid Rajabli, Giuseppe Tosto, Jonathan L. Haines

TL;DR
This study shows that the genetic risk of Alzheimer's disease from the APOE4 gene varies significantly across different racial and ethnic groups, and that assuming a simple additive model may not be accurate.
Contribution
The study introduces explicit adjustments for deviations from additivity in modeling APOE4's effect on Alzheimer's disease risk across racial and ethnic groups.
Findings
East Asian participants had the highest APOE4 odds ratios (5.2), while Black participants had the lowest (2.8).
Homozygote East Asian APOE4 carriers showed a 57% higher risk than predicted by additive models.
Adjusting for deviations from additivity improved model performance, especially for Black participants.
Abstract
APOE’s ε4 haplotype (APOE4) is late onset Alzheimer’s disease’s (LOAD) strongest genetic risk factor. Therefore, accurately modeling APOE4’s effect is critical to understanding LOAD. This is especially important as APOE4 odds ratios (OR) vary across racial and ethnic (R/E) groups. We analyzed the APOE4-LOAD association in 3,196 East Asian, 31,105 non-Hispanic White (White), 1,646 Hispanic and Latino (Hispanic), and 6,068 non-Hispanic Black (Black) participants using three genetic models: additive, genotypic, and a reparametrized model accounting for deviations from additivity (DA). Each model adjusted for age, sex, and genetic ancestry. We first calculated additive APOE4 ORs in each R/E group, finding East Asian participants had the largest APOE4 ORs (ORAPOE4: 5.2, 95%CI: 4.4–6.0) and Black participants among the smallest (ORAPOE4: 2.8, 95%CI: 2.6–3.1). Next, we generated APOE4 ORs for…
Genes, proteins, chemicals, diseases, species, mutations and cell lines named across the full text — each resolved to its canonical identifier and authoritative record.
Click any figure to enlarge with its caption.
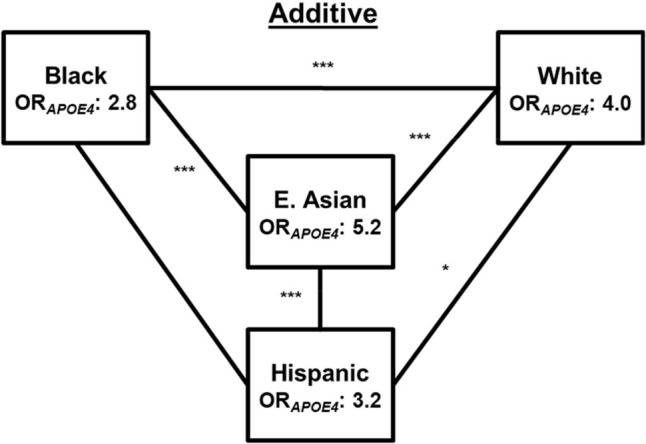 Figure 1
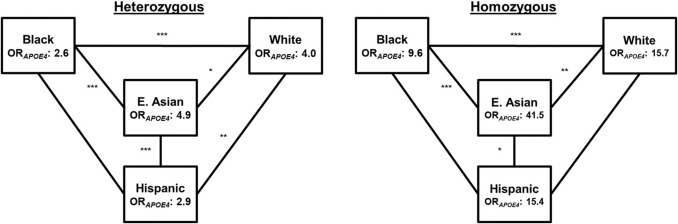 Figure 2
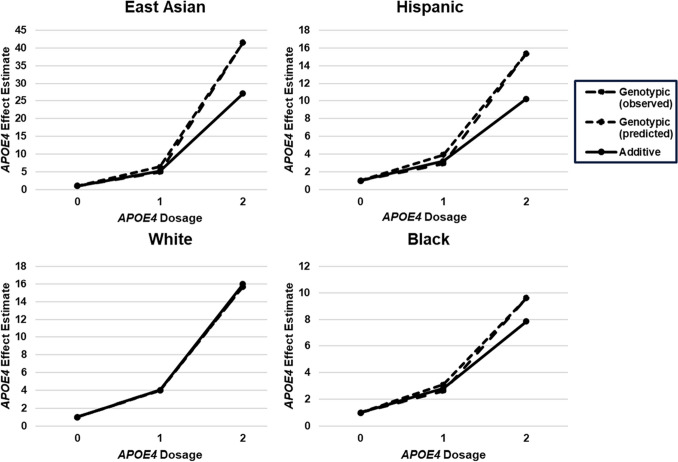 Figure 3
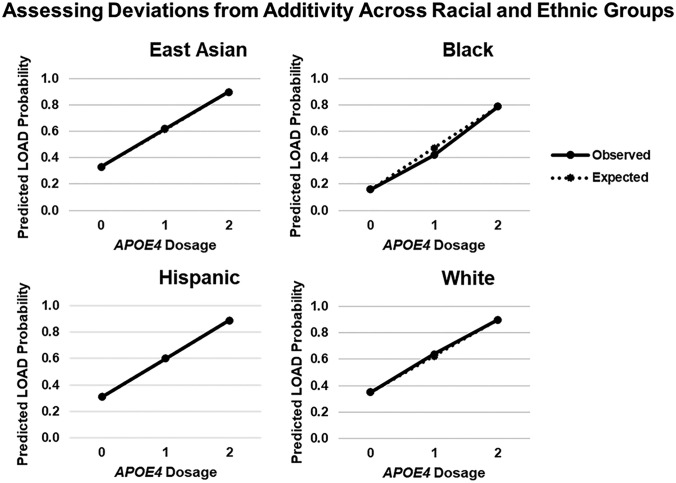 Figure 4
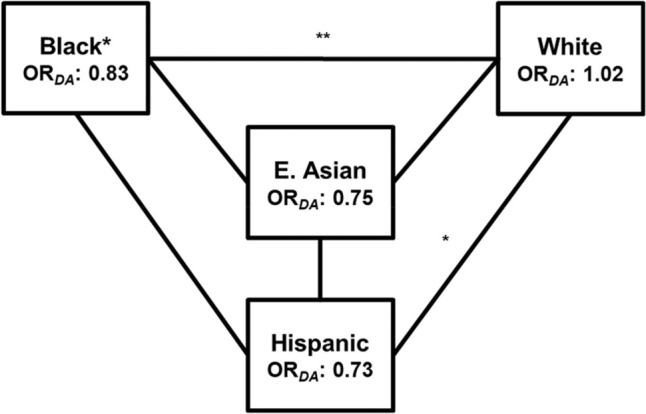 Figure 5
- —https://doi.org/10.13039/100000002National Institutes of Health
- —https://doi.org/10.13039/100000861Burroughs Wellcome Fund
Peer Reviews
No public reviews on file for this paper yet. If you reviewed it on a platform where reviews are public (OpenReview, ICLR, NeurIPS, ICML), you can paste yours below so the community can read it here.
Videos
No videos yet. Explain this paper in a talk, walkthrough, or lecture? Add one.
Taxonomy
TopicsGenetic Associations and Epidemiology · Dementia and Cognitive Impairment Research · Alzheimer's disease research and treatments
Introduction
Apolipoprotein E (APOE) represents the strongest genetic risk factor for late-onset Alzheimer’s disease (LOAD), the most common form of dementia (2024; Mayeux and Stern 2012; Morris et al. 2019; Rajan et al. 2017; Rizzi et al. 2014; Tiwari et al. 2019). Extensive recruitment and research efforts involving non-Hispanic White and/or European-descent individuals (hereafter referred to as White) have estimated APOE’s attributable risk as high as twenty percent in some Northern European populations (Qiu et al. 2004). As this gene can account for a large proportion of genetic LOAD risk, accurately modeling APOE’s risk-increasing ε4 allele (APOE4) is critical in understanding risk (Bellenguez et al. 2022; Belloy et al. 2023; Breitner et al. 1999; Farrer et al. 1997; Kamboh et al. 2012; Qiu et al. 2004).
The characterization of APOE4 in non-European descent populations has also documented this variant’s contribution to LOAD (Barnes et al. 2005; Belloy et al. 2023; Farrer et al. 1997; Morris et al. 2019; Rajabli et al. 2025; Rajabli et al. 2018; Rajan et al. 2017; Weiss et al. 2021). Prior reports showed that East Asian and East Asian American (hereafter referred to as East Asian) individuals have the largest APOE4 odds ratios (OR), followed by White, non-Hispanic Black and/or African American (hereafter referred to as Black), and Hispanic and genetically admixed Latino (hereafter referred to as Hispanic) individuals. While the population with the lowest APOE4 OR varies between Hispanic and Black groups by study, APOE4 ORs in these two populations are consistently smaller compared to White and East Asian APOE4 estimates.(Belloy et al. 2023; Farrer et al. 1997) In addition to these racial differences in the estimated effect of APOE4, there are also racial differences in the frequency of APOE4 (Asian: 9%, Hispanic: 12%, White: 14%, African: 19% (Jia et al. 2020)), and LOAD risk (Cumulative 25-year risk of dementia at age 65: 38% African-Americans, 32% Latino, 30% White, 28% Asian-Americans (Mayeda et al. 2016). African individuals appear to have the highest risk of LOAD and the highest frequency of APOE4, but the lowest APOE4 effect size. Asian individuals appear to have the lowest risk of LOAD and the lowest frequency of APOE4, but the highest APOE4 effect size. Finally we know that, local ancestry surrounding the APOE gene region is contributing to ε4 effect size variation across racial and ethnic (R/E) populations (Barnes et al. 2005; Belloy et al. 2023; Farrer et al. 1997; Rajabli et al. 2022, 2023; Rajabli et al. 2018; Rajan et al. 2017).
The effects of APOE4 alleles on LOAD risk are often assumed to act additively, with each ε4 allele increasing risk proportional to its copy number, despite reports supporting deviations from additivity (DA) (Corder, et al. 1993; Fortea, et al. 2024; Ohta, et al. 2024; Tsouris, et al. 2024). Refining genetic modeling strategies to account for DA in the APOE4-LOAD association remains important as estimates including this adjustment may more accurately represent APOE4’s effect (Fortea, et al. 2024; Ohta, et al. 2024; Tsouris, et al. 2024). We explicitly evaluated DA by reparametrizing existing genetic models, assessed the impact of this adjustment on model performance, and how considering DA in our model affects the relative population specific conferred risk in multiple R/E groups.
Methods
To confirm population specific APOE4 risk and examine DA effects, we used data from the Alzheimer’s Disease Genetic Consortium’s (ADGC) (Kuzma, et al. 2016). The ADGC provided genetic and covariate information on 65,952 unique individuals from 43 cohorts. We addressed population variability in the APOE4-LOAD association by stratifying individuals into non-overlapping East Asian, White, Black, and Hispanic groups using R/E descriptors documented by the ADGC (Supplemental Table 1). After implementing quality control measures and removing third degree or closer relatives (kinship cutoff Φ_ij_ ≥ 0.0884), 42,015 participants remained in the final analytic dataset: 3,196 East Asian, 31,105 White, 6,068 Black, and 1,646 Hispanic individuals (Table 1, Supplemental Fig. 1). ADGC data is available upon request from the Consortium (https://www.adgenetics.org/content/feedback-and-queries). The study was approved by the Case Western Reserve University IRB.Table 1. Study population demographicsEast Asian (n = 3,196)White (n = 31,105)Hispanic (n = 1,646)Black (n = 6,068)Case (n = 1,419)Control (n = 1,777)Case (n = 14,868)Control (n = 16,237)Case (n = 665)Control (n = 981)Case (n = 1,797)Control (n = 4,271)Age (Median, IQR)75.0 (71.0, 78.0)76.0 (72.0, 80.0)78.0 (72.0, 83.0)76.0 (70.0, 82.0)79.0 (73.0, 85.0)71.0 (66.0, 77.0)80.0 (75.0, 85.0)77.0 (70.0, 82.3)Sex %Female (n)71.0% (1,008)53.0% (942)57.3% (8,512)59.7% (9,690)64.2% (427)71.9% (705)69.3% (1,245)72.1% (3,080)APOE4XX44.0% (624)82.3% (1,463)39.6% (5,883)74.0% (12,013)57.1% (380)79.1% (776)39.8% (715)64.2% (2,743)X445.5% (645)17.2% (305)47.1% (7,007)24.0% (3,901)34.0% (226)19.6% (192)47.9% (860)32.9% (1,406)4410.6% (150)0.5% (9)13.3% (1,978)2.0% (323)8.9% (59)1.3% (13)12.4% (222)2.9% (122)R/E population descriptors from ADGCXX APOE4 non-carriers, X4 participants carrying one copy of APOE4, 44 participants carrying two copies of APOE4
Participants diagnosed with mild cognitive impairment were excluded from this study so that all comparisons are binary: cognitively unaffected participants (controls) or individuals affected by LOAD (cases). All participants were evaluated to determine case or control status based on the National Institute of Neurological and Communicative Disorders and Stroke-Alzheimer’s Disease and Related Disorders Association criteria (Albert et al. 2011; McKhann et al. 1984). Each remaining participant was 60 years of age or older, had a documented age of onset (case) or age at last assessment (control), and demographic information. To ensure high quality data for APOE genotypes*,* rs429358 and rs7412, the sites that define APOE4, were measured with the Taqman Assay as previously described (Rajabli et al. 2025). Principal components (PCs) were calculated using variants initially filtered at the cohort level to only include variants with minor allele frequency (MAF) > 1% in all R/E populations. Imputation was done using the Trans-Omics for Precision Medicine (TOPMed) Imputation Server (TIS) as previously published (Rajabli et al. 2025); in brief, we required imputation R^2^ > 0.8 with MAF between 1 and 5% and imputation R^2^ > 0.4 for variants with MAF > 5%. At the population level, variants were further filtered for linkage disequilibrium and only variants with pairwise R^2^ < 0.2 within 50 kb blocks were included, using PLINK 1.9.(Purcell et al. 2007) The final set of variants selected for PC calculation were based on the overlapping, filtered SNP set across all cohorts and all populations. In total, 142,005 genetic variants were retained for the calculation of PCs. We adjusted for global genetic ancestry within each R/E group by incorporating PCs into the regression models and determined that including the first two PCs corrected for within-group genetic admixture (Supplemental Fig. 2). We also performed sensitivity analyses to assess how varying the number of PCs affected APOE4 ORs (Supplemental Fig. 3). PCs were calculated separately for each R/E group. ORs were compared using a Wald-test, with significance assessed at α = 0.05. Three main models were evaluated (Supplemental Eqs. 1, 2, and 3). A sensitivity analyses was conducted to explore the impact of potential differences by study site, by adding a random intercept for study site to Supplemental Eq. 3. To explore the role of sex we conducted two additional sensitivity analyses. In the first approach we added a DA-sex interaction term Supplemental Eq. 3 to determine if the DA term differed by sex. In the second approach we reran Supplemental Eq. 3 within the 8 strata defined jointly by sex and R/E. All significance tests were two sided Wald tests conducted at α = 0.05, and no corrections were made for multiple testing. Statistical analyses were conducted using R, version 4.4.1 (R Project for Statistical Computing)[Team 2024].
Results and discussion
Additive model
Case–control, multivariable logistic regression analyses assessed the effect of APOE4 adjusted for age, sex, and global ancestry represented by the first two PCs. We first conceptualized APOE4 effects using an additive model with APOE4 non-carriers as the referent group (Supplemental Eq. 1). Additive APOE4 effect estimates (β_APOE4) were then exponentiated to obtain APOE4 OR (ORAPOE4). The largest APOE4 effects were observed in East Asian participants (ORAPOE4: 5.2, 95%CI: 4.4–6.0) followed by APOE4 effects estimates in White (ORAPOE4: 4.0, 95%CI: 3.8–4.2), Hispanic (ORAPOE4: 3.2, 95%CI: 2.6–4.0), and Black (ORAPOE4: 2.8, 95%CI: 2.6–3.1) participants (Table 2). All pairwise R/E ORAPOE4_ comparisons were evaluated and differed significantly (P < 0.05) except for the comparison between Black and Hispanic participants (P = 0.13) (Fig. 1, Table 3).Fig. 1. Additive OR_APOE4_ across multiple racial and ethnic groups. Additive APOE4 modeling generated R/E-stratified OR_APOE4. ORAPOE4_ generated using this model differed between all R/E groups. Statistical OR_APOE4_ comparisons were determined using Wald tests and are indicated by lines between the R/E groups (*: < 0.05; **: < 0.01; ***: < 0.001; no asterisk(s) indicates non-significant difference(s))
Genotypic model
Next, we analyzed APOE4 effects using a genotypic model (Supplemental Eq. 2). Participants were separated into three non-overlapping categories based on APOE4 genotype: those with either zero, one, or two copies of the ε4 allele, as done in previous studies (Belloy, et al. 2023; Farrer, et al. 1997). Relative to APOE4 non-carriers (XX), heterozygote APOE4 ORs (X4) were again largest in East Asian (OR_APOE4: 4.9, 95%CI: 4.1–5.8) participants followed by White (ORAPOE4: 4.0, 95%CI: 3.8–4.2), Hispanic (ORAPOE4: 2.9, 95%CI: 2.2–3.7), and Black (ORAPOE4: 2.6, 95%CI: 2.3–2.9) participants (Table 2). All differences between R/E heterozygotes differed significantly except between Black and Hispanic participants. (Fig. 2, Table 4) Although this comparison did not reach statistical significance, Black participants trended lower ORAPOE4_ (P = 0.23).Fig. 2. Genotypic OR_APOE4_ across multiple racial and ethnic groups. Heterozygote (a) and homozygote (b) OR_APOE4_ generated in R/E-stratified analyses. Statistical OR_APOE4_ comparisons were determined using Wald tests and are indicated by lines between the R/E groups for heterozygotes (a) and homozygotes (b) (*: < 0.05; **: < 0.01; ***: < 0.001; no asterisk(s) indicates non-significant difference(s)). APOE4 non-carriers were the referent group
Homozygous APOE4 carriers (44) showed a similar pattern to that of heterozygotes. Among homozygotes, APOE4’s effect in East Asian participants (OR_APOE4: 41.5, 95%CI: 22.1–88.8) was higher than in White (ORAPOE4: 15.7, 95%CI: 13.8–17.8), Hispanic (ORAPOE4: 15.4, 95%CI: 8.2–31.3), and Black (ORAPOE4: 9.6, 95%CI: 7.5–12.3) participants (Fig. 2, Tables 2, 4, 5). In contrast to the heterozygote analyses, however, homozygote ORAPOE4_ differed significantly between all populations except between Black and Hispanic (P = 0.09) and between Hispanic and White (P = 0.48) participants (Fig. 2, Table 4).Table 2APOE4 odds ratios for different genetic modelsRace/ethnicityAdditiveGenotypicDA-AdjustedHeterozygoteHomozygoteOR_APOE495% CIORAPOE495% CIORAPOE495% CIORAPOE495% CIEast Asian5.154.43, 6.024.864.10, 5.7741.5322.13, 88.796.444.70, 9.42White4.003.83, 4.174.023.82, 4.2415.6513.84, 17.753.963.72, 4.21Hispanic3.232.62, 4.022.862.20, 3.7215.448.15, 31.293.932.85, 5.59Black2.832.57, 3.122.582.28, 2.929.587.50, 12.303.102.74, 3.51ORAPOE4_ from additive, genotypic, and DA-adjusted APOE4 regression models with 95% confidence intervals (CI). APOE4 non-carriers were the referent group in the genotypic model. ORs were generated for additive, genotypic, and DA-adjusted regression models from Supplemental Eqs. 1, 2, or 3, respectivelyTable 3Comparisons between race/ethnic groups of additive OR_APOE4Race/ethnicityEast AsianWhiteHispanicBlackEast AsianWhite < 0.001Hispanic < 0.0010.03Black < 0.001 < 0.0010.13Pairwise comparisons between R/E groups were conducted for the additive (b) modeling strategy using Supplemental Eq. 1Table 4Comparisons between race/ethnic groups for genotypic ORAPOE4_R/EHeterozygoteHomozygoteE. AsianWhiteHispanicBlackE. AsianWhiteHispanicBlackE. AsianWhite0.020.003Hispanic < 0.0010.0040.020.48Black < 0.001 < 0.0010.23 < 0.001 < 0.0010.09Pairwise comparisons between R/E groups were conducted for the genotypic (c) modeling strategy using Supplemental Eq. 2. APOE4 non-carriers (X4) were designated as the referent group in the genotypic modelTable 5Evidence of DA among multiple racial and ethnic groupsRace/EthnicityMeasured Homozygote ORPredicted Homozygote ORP-valueEast Asian41.526.50.01White15.716.00.64Hispanic15.410.40.20Black9.68.00.17Measured Homozygote (44) and predicted homozygote OR assuming additivity (PH). APOE4 non-carriers were the referent group in analyses
To understand how additive and genotypic OR_APOE4_ estimates differed, we generated homozygote (44) OR_APOE4_ predictions assuming only additive contributions. These predicted homozygote (PH) OR_APOE4_ estimates were the square of their respective additive OR_APOE4. PH ORAPOE4_ were highest in East Asian (OR_APOE4: 26.5) participants, followed by White (ORAPOE4: 16.0), Hispanic (ORAPOE4: 10.4) and Black (ORAPOE4_: 8.0) participants (Table 5). Additive predictions underestimated calculated homozygote genotypic OR in East Asian participants by 57%. This was the only significant difference from its genotypic counterpart across the R/E groups (Table 5). This builds upon existing literature, indicating the presence of DA through an increase in APOE4’s homozygote effects relative to additivity (Fortea, et al. 2024).
Deviation from additivity
Coupled with additional evidence of DA, we next refined the genotypic APOE4 model by incorporating a DA adjustment into the additive APOE4 model framework (Figs. 3 and 4, Supplemental Eq. 3). Supplemental Eq. 3 is statistically equivalent to supplemental Eq. 2, although the two approaches utilize different parametrizations of related adjustments (Supplemental Eqs. 4 and 5; Supplemental Table 2). Specifically, this approach separates APOE4’s effect into the APOE4 marginal term and a DA covariate. Unlike additive or genotypic modeling, this reparameterization allows us to study the significance, magnitude, and direction of DA. Compared to additive APOE4 ORs, Wald testing indicated non-significant changes in OR_APOE4_ across all R/E groups (East Asian OR_APOE4: 6.4, 95%CI: 4.7–9.4; White ORAPOE4: 3.9, 95%CI: 3.7–4.2; Hispanic ORAPOE4: 3.9, 95%CI: 2.8–5.6; and Black ORAPOE4: 3.1, 95%CI: 2.7–3.5) (Table 2). Although the differences in ORAPOE4_ between the additive and DA-adjusted OR_APOE4_ did not reach significance in any R/E group, OR_APOE4_ increases among East Asian, Hispanic, and Black participants approached the threshold for statistical significance (P = 0.13, 0.15, and 0.11, respectively). Following DA adjustment, White and Hispanic participant OR_APOE4_ also no longer differed from one another (Table 6). Akaike information criterion (AIC), a common model evaluation metric indicated improved model performance in East Asian, Hispanic, and Black participants with the DA term, although this improvement was significant only among Black participants (Table 7).Fig. 3OR_APOE4_ differences by modeling strategy across multiple racial and ethnic groups. The impact of additive and genotypic modeling on OR_APOE4. Regardless of modeling strategy, ORAPOE4_ estimates converge when data conforms to additive modeling assumptions. This is not observed for any non-White R/E group, indicating some degree of DA. APOE4 non-carriers were the referent group in genotypic modelingFig. 4Evidence of DA across multiple racial and ethnic groups. Calculating the predicted probability of LOAD in each R/E group with increasing APOE4 dosage in the additive model. Observed estimates deviated from predicted LOAD probabilities in Black participants, reflecting similar findings as those generated from Supplemental Eq. 3Table 6Comparisons between race/ethnic groups for DA-adjusted OR_APOE4_Race/ethnicityEast AsianWhiteHispanicBlackEast AsianWhite** < 0.001Hispanic0.020.48Black < 0.001 < 0.001****0.06**Pairwise comparisons between R/E groups were conducted for the DA-adjusted (d) modeling strategy using Supplemental Eq. 3Table 7Model evaluation using AIC and likelihood ratio testing (LRT) for each R/E groupRace/EthnicityModelAICLRTEast AsianAdditive3,670.780.11DA-Adjust3,670.27WhiteAdditive38,079.810.65DA-Adjust38,081.61HispanicAdditive1,759.820.11DA-Adjust1,759.21BlackAdditive6,684.340.02DA-Adjust6,680.51Best model by AIC underlined
We then assessed the DA term in each R/E group. Reparametrizing the genotypic model while taking advantage of the additive framework provided insight into previously overlooked non-additivity in the APOE4-LOAD association. This approach produced population specific OR_DA_, direct and quantifiable measures of the ε4 allele, its significance, and trends toward either dominance (OR_DA_ > 1.0) or recessivity (OR_DA_ < 1.0). OR_DA_ findings converged with previous model performance results, as the DA effect again reached significance only among Black participants (OR_DA_: 0.83, 95%CI: 0.72–0.97). Estimates in the East Asian (OR_DA_: 0.75, 95%CI: 0.50–1.07) and Hispanic (OR_DA_: 0.73, 95%CI: 0.48–1.07) participants trended toward a recessive effect (Fig. 5). Although non-significant, we detected a very slight trend toward dominance among White participants (OR_DA_: 1.02, 95%CI: 0.94–1.09), the only finding across several R/E groups indicating non-recessive behavior of the ε4 allele. Finally, by comparing OR_DA_ estimates between R/E groups, we found significant differences between Black and White (P < 0.001) and between White and Hispanic (P =0.05) participants (Fig. 5, Table 8). Despite this covariate reaching significance only in the Black population, this report introduces evidence quantifying patterns of APOE4 dosage effects initially noted by Corder et al. explicitly across several diverse populations (Corder, et al. 1993).Fig. 5. Evaluating OR_DA_ across multiple racial and ethnic groups. DA-adjusted modeling of additive APOE4 effects generated OR_DA_ estimates for each R/E group. This estimate reached significance among Black participants. Comparisons between R/E groups indicated that these deviations only differed between Black and White participants. Statistical OR_DA_ comparisons were determined using t-tests and are indicated by lines between the R/E groups (b) (*: < 0.05; **: < 0.01; ***: < 0.001; no asterisk(s) indicates non-significant difference(s))Table 8OR_DA_ for each race/ethnicity and pairwise comparison between groups (p-values) (below diagonal)Race/ethnicityEast AsianWhiteHispanicBlackOR_DA_0.75 (0.50,1.07)1.02 (0.94,1.09)0.73 (0.48,1.07)0.83 (0.72,0.97)East AsianWhite0.95Hispanic0.440.05Black0.71 < 0.0010.74
The ADGC data is an amalgamation of data from 43 distinct studies, and some of these components focused their recruitment on one specific R/E, so we investigated the potential for bias due to possible impacts of collection site. We lack most information on ascertainment strategies but emphasize that our results were similar when we used mixed effect logistic regression and included a random intercept for collection site (Supplemental Table 3), indicating the results were not affected by variation among study sites.
While we were limited in terms of available covariates, we then explored if these race specific patterns might be explained by one key covariate: sex. First, we ran a race-agnostic interaction analysis in the full dataset across all RE by adding a DA-sex interaction term to Supplemental Eq. 3. We found no evidence that the DA term differed by sex (p = 0.99). Then we reran Supplemental Eq. 3 within 8 strata (males and females of the 4 R/Es). The race specific DA patterns appeared roughly similar, except that the DA terms were generally smaller in the males of each race. Among East Asians, Blacks and Hispanics males, the DA ORs differed from unity, consistent with a recessive model for APOE4 effects. This difference was most prominent in East Asians and Hispanics. Of note, in whites where the sample size was the largest there appeared to be no deviation from additivity. Thus, the role of sex in determining deviation from additivity merits attention in future research, and other LOAD co-factors not available in this study (e.g. educational attainment, decade of birth, etc.) should also be considered.
Limitations of this observational study included the non-random population sample. As with all case–control approaches, study entry was dependent on disease status, and this creates the opportunity for unrecognized selection biases. This may introduce concerns of selection bias that are typical of such studies. The utilization of R/E potentially limits this study’s ability to accurately understand the APOE4-LOAD association as this socially defined population descriptor often collapses ancestrally diverse groups into a single category. While R/E stratification is one of the most common strategies for examining population differences, this approach neglects within-group heterogeneity. For example, due to the nature of R/E data collection, “Hispanic” individuals are designated as a single group despite differing genetic admixture profiles (Adhikari, et al. 2016; Granot-Hershkovitz, et al. 2021). Further, PC adjustment may not sufficiently address intra-population variation described by a single R/E identifier, e.g. Hispanic participants ascertained in the Caribbean, Mexico, and the United States. PC adjustment also fails to account for local ancestry surrounding the APOE gene locus that has been shown to modify LOAD risk (Rajabli, et al. 2018).
Conclusion
In summary, this report assessed the APOE4-LOAD association, demonstrating findings similar, but not identical, to estimates of APOE4’s varying contribution to LOAD risk across multiple R/E groups compared to previous publications. The relative OR_APOE4_ order between R/E groups described in this report (Black < Hispanic < White < East Asian) differed from Belloy et al.’s 2023 findings (Hispanic < Black < White < East Asian) despite substantial overlap in participant data (Belloy, et al. 2023). This and other differences in findings may be due to characteristics of the non-overlapping participant samples, methods of ancestry adjustment, the impact of DA adjustment, and/or insufficient power to detect signal among East Asian, Hispanic, and, to a lesser degree Black participants compared to their White counterparts (Belloy, et al. 2023; Burton, et al. 2009; Farrer, et al. 1997; Fortea, et al. 2024; Haines 1991; Ohta, et al. 2024; So and Sham 2011; Tsouris, et al. 2024). Overall, both Belloy et al 2023 and our study suffered from relatively small samples sizes non-Europeans, but our sample sizes were even smaller for the non-Europeans. This may account for some of the differences in our observations. Our findings also indicate that additive and genotypic modeling alone may not appropriately capture R/E-specific APOE4 effects, especially in Black populations. We detected significant DA effects in Black participants and found that DA adjustment in this R/E group produced a significantly better performing model. In addition, adjusting for DA partially ablated OR_APOE4_ differences in the ε4 allele’s effect across R/E groups. Stated differently, some of the magnitude in differences in R/E effect sizes are related to variation in the deviation from non-additivity across groups. Finally, this study presented evidence that DA differed between Black and White and between White and Hispanic participants, introducing evidence of population specific DA in the APOE4-LOAD association. Our results indicate revisiting APOE4 GWAS estimates for all studies investigating Black populations and that future APOE-stratified analyses should evaluate non-additive contributions of APOE. Considering non-additivity appears to be important for most genetic analyses of LOAD, especially in Black populations. Therefore, polygenic risk scores should consider deviations from additivity, at least for APOE, the most prominent genetic risk factor for LOAD.
Supplementary Information
Below is the link to the electronic supplementary material.Supplementary file1 (PDF 51 KB)Supplementary file2 (TIF 295 KB)Supplementary file3 (TIF 2782 KB)Supplementary file4 (DOCX 17 KB)Supplementary file5 (DOCX 19 KB)Supplementary file6 (DOCX 17 KB)Supplementary file7 (DOCX 17 KB)Supplementary file8 (DOCX 16 KB)
The reference list from the paper itself. Each links out to its DOI / PubMed record.