Machine learning models based on log odds of positive lymph nodes for predicting survival in T1N+ gastric cancer
Yuchen Liu, Hao Cui, Zhen Yuan, Jinghang Wang, Ruonan An, Rui Li, Jianxin Cui, Bo Wei

TL;DR
This study uses machine learning with a new metric called LODDS to better predict survival in early gastric cancer patients with lymph node metastasis.
Contribution
The study introduces LODDS as a novel prognostic factor and integrates it with machine learning for improved survival prediction in T1N+ gastric cancer.
Findings
LODDS staging outperformed traditional N staging in predicting survival (C-index 0.65 vs. 0.57).
The RSF model achieved high accuracy with a C-index of 0.79 in training and 0.80 in validation.
The RSF model showed better performance than Cox and XGBoost models in survival prediction.
Abstract
Although early gastric cancer (EGC) is generally limited to the mucosal and submucosal layers, lymph node metastasis can still occur, which may worsen the prognosis, particularly when the number of examined lymph nodes (ELNs) is inadequate. This study introduces log odds of positive lymph nodes (LODDS) as a prognostic factor and integrates it with machine learning to improve survival predictions in T1N+ gastric cancer (GC). This retrospective study used data from the Surveillance, Epidemiology, and End Results (SEER) Program and an independent validation cohort from the Chinese People’s Liberation Army General Hospital First Medical Center. Predictive factors were selected using LASSO regression and multivariate Cox regression. Cox proportional-hazards (CoxPH), random survival forest (RSF), and XGBoost models were developed to predict overall survival (OS). Model interpretability and…
Genes, proteins, chemicals, diseases, species, mutations and cell lines named across the full text — each resolved to its canonical identifier and authoritative record.
Click any figure to enlarge with its caption.
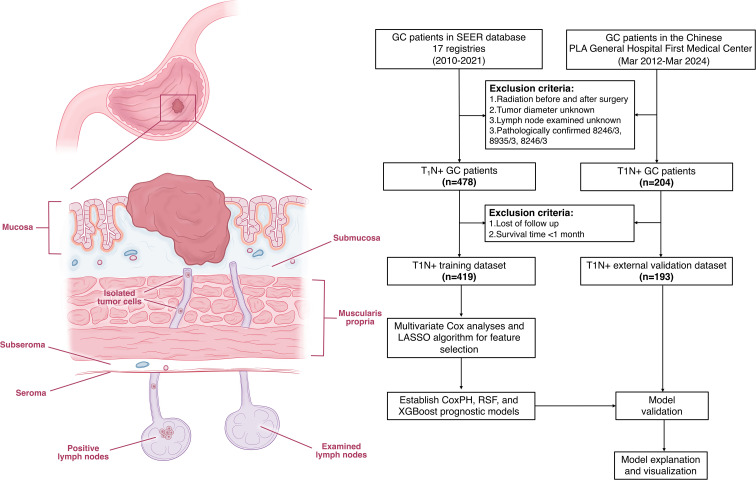 Figure 1
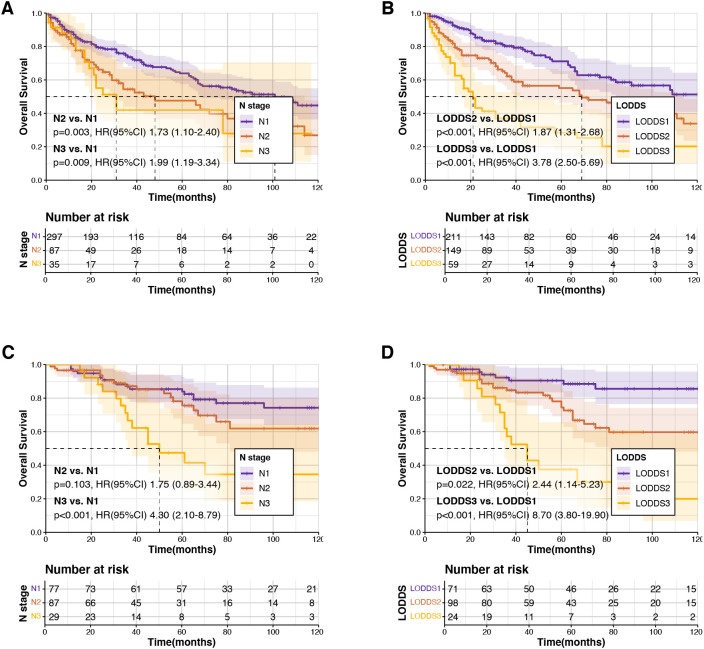 Figure 2
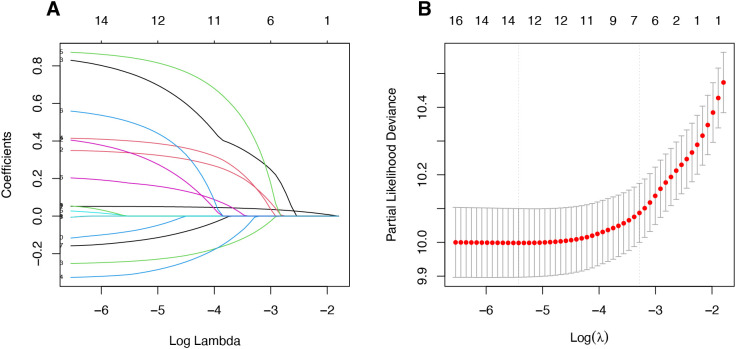 Figure 3
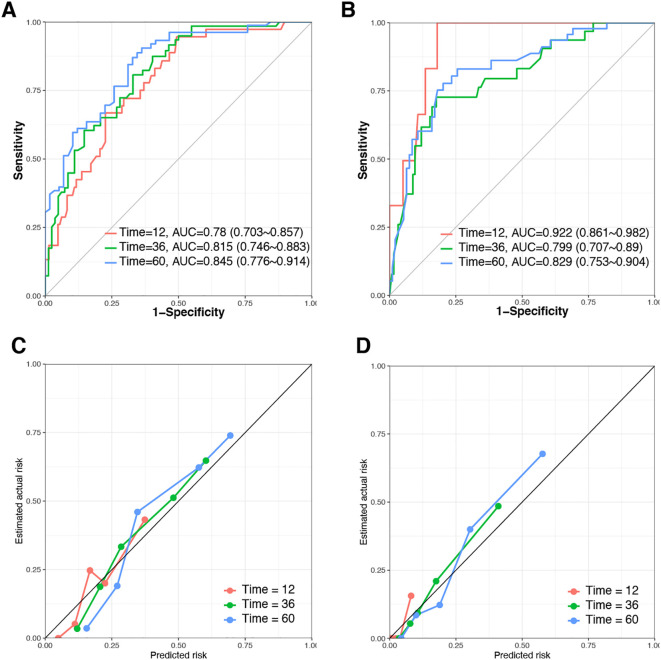 Figure 4
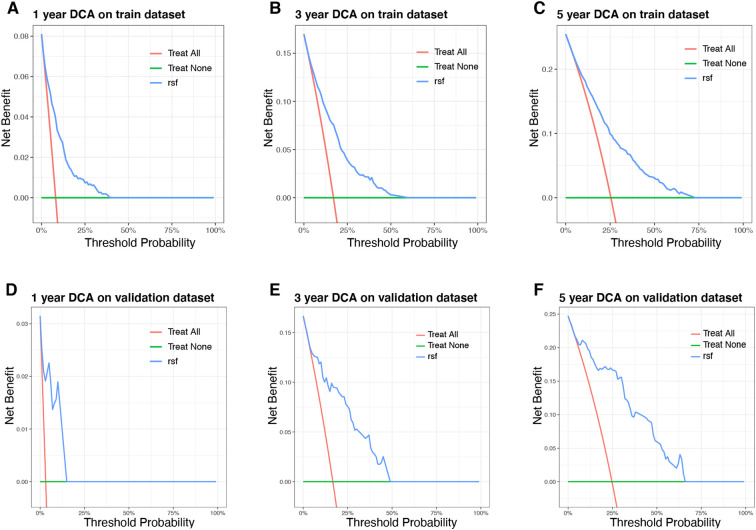 Figure 5
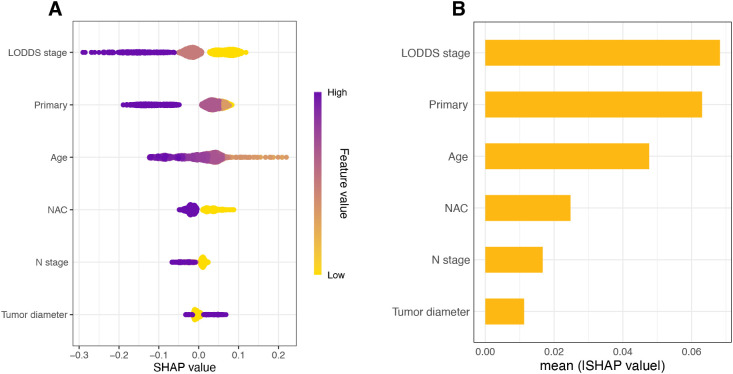 Figure 6
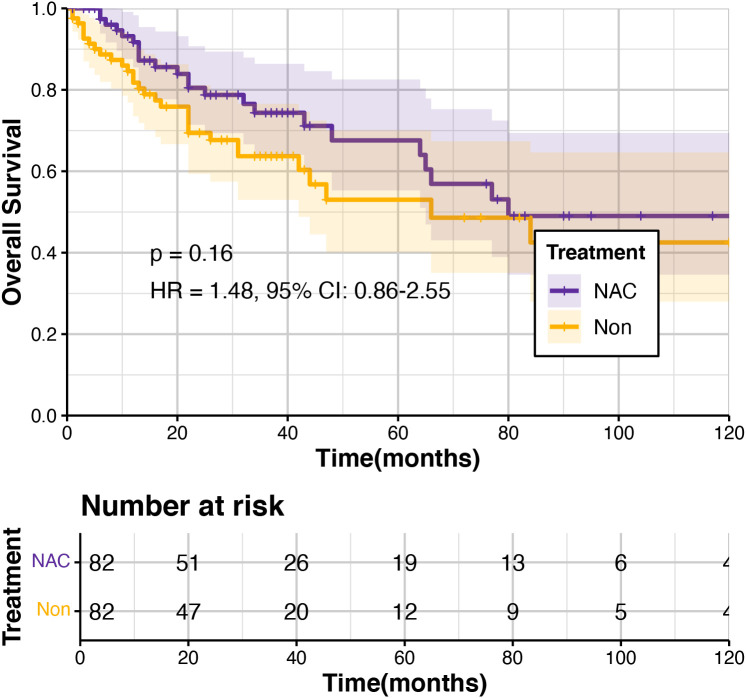 Figure 7
| Variable | Training dataset | Validation dataset | |
|---|---|---|---|
| (n=419) | (n=193) | ||
| Age (mean (SD)) | 67.91 (13.04) | 58.27 (11.40) | <0.001 |
| Sex (%) | 0.515 | ||
| Female | 169 (40.3) | 68 (35.2) | |
| Male | 250 (59.7) | 125 (64.8) | |
| N stage (%) | <0.001 | ||
| N1 | 297 (70.9) | 77 (39.9) | |
| N2 | 87 (20.8) | 87 (45.1) | |
| N3 | 35 (8.4) | 29 (15.0) | |
| LODDS stage (%) | 0.201 | ||
| LODDS1 | 123 (29.4) | 71 (36.8) | |
| LODDS2 | 232 (55.4) | 98 (50.8) | |
| LODDS3 | 64 (15.3) | 24 (12.4) | |
| Tumor diameter (%) | 0.005 | ||
| > 10mm | 340 (81.1) | 173 (89.6) | |
| ≤ 10 mm | 79 (18.9) | 20 (10.4) | |
| Primary site (%) | <0.001 | ||
| Distal | 122 (29.1) | 125 (64.8) | |
| Proximal | 127 (30.3) | 23 (11.9) | |
| Middle | 61 (14.6) | 36 (18.7) | |
| Nos | 109 (26.0) | 9 (4.7) | |
| Tumor differentiation (%) | <0.001 | ||
| Well | 16 (3.8) | 9 (4.7) | |
| Moderate | 68 (16.2) | 55 (28.5) | |
| Poor/undifferentiated | 114 (27.2) | 129 (66.8) | |
| Unknown | 221 (52.7) | 0 (0.0) | |
| Signet-ring carcinoma (%) | <0.001 | ||
| Absence | 367 (87.6) | 114 (59.1) | |
| Presence | 52 (12.4) | 79 (40.9) | |
| Treatment (%) | <0.001 | ||
| NAC | 113 (27.0) | 10 (5.2) | |
| Non-NAC | 306 (73.0) | 183 (94.8) |
| Variable | Univariate OS | Multivariate OS | ||
|---|---|---|---|---|
| P value | HR (95%CI) | P value | HR (95%CI) | |
|
|
| 1.03 (1.02-1.05) |
| 1.02 (1.01-1.04) |
| Sex | ||||
| Female | Ref. | |||
| Male | 0.053 | 1.38 (0.99-1.92) | ||
| N stage | ||||
| N1 | Ref. | Ref. | ||
| N2 |
| 1.73 (1.10-2.40) |
| 1.56 (1.05-2.32) |
| N3 |
| 1.99 (1.19-3.34) | 0.47 | 1.25 (0.68-2.30) |
| LODDS stage | ||||
| LODDS1 | Ref. | Ref. | ||
| LODDS2 |
| 1.87 (1.31-2.68) |
| 1.57 (1.05-2.33) |
| LODDS3 |
| 3.78 (2.50-5.69) |
| 2.95 (1.83-4.78) |
| Primary site | ||||
| Distal | Ref. | |||
| Middle | 0.07 | 0.59 (0.34-1.05) | ||
| Proximal | 0.1 | 1.37 (0.93-2.03) | ||
| Nos | 0.79 | 0.94 (0.62-1.44) | ||
| Tumor size | ||||
| > 10 mm | Ref. | Ref. | ||
| ≤ 10 mm |
| 0.47 (0.30-0.75) |
| 0.59 (0.37-0.95) |
| Tumor differentiation | ||||
| Well | Ref. | |||
| Moderate | 0.08 | 2.55 (0.91-7.13) | ||
| Poor/undifferentiated | 0.1 | 2.48 (0.89-6.85) | ||
| Unknown | 0.42 | 1.54 (0.54-4.41) | ||
| Signet-ring carcinoma | ||||
| Absence | Ref. | Ref. | ||
| Presence |
| 0.51 (0.30-0.87) | 0.07 | 0.61 (0.35-1.05) |
| Treatment | ||||
| NAC | Ref. | |||
| Non-NAC | 0.098 | 1.41 (0.94-2.13) | ||
| Model | C-index | AUC | Brier score | ||||
|---|---|---|---|---|---|---|---|
| 1-year | 3-year | 5-year | 1-year | 3-year | 5-year | ||
| CoxPH model | |||||||
| Training cohort | 0.718 | 0.745 | 0.73 | 0.746 | 0.134 | 0.2 | 0.205 |
| Validation cohort | 0.752 | 0.775 | 0.788 | 0.812 | 0.032 | 0.115 | 0.138 |
| RSF model | |||||||
| Training cohort | 0.785 | 0.780 | 0.815 | 0.845 | 0.125 | 0.174 | 0.179 |
| Validation cohort | 0.801 | 0.922 | 0.799 | 0.829 | 0.029 | 0.116 | 0.134 |
| XGBoost model | |||||||
| Training cohort | 0.757 | 0.766 | 0.775 | 0.787 | 0.129 | 0.189 | 0.194 |
| Validation cohort | 0.741 | 0.718 | 0.76 | 0.814 | 0.031 | 0.112 | 0.139 |
- —National Natural Science Foundation of China10.13039/501100001809
- —Beijing Science and Technology Planning Project10.13039/501100012401
Peer Reviews
No public reviews on file for this paper yet. If you reviewed it on a platform where reviews are public (OpenReview, ICLR, NeurIPS, ICML), you can paste yours below so the community can read it here.
Videos
No videos yet. Explain this paper in a talk, walkthrough, or lecture? Add one.
Taxonomy
TopicsGastric Cancer Management and Outcomes · Cholangiocarcinoma and Gallbladder Cancer Studies · Esophageal Cancer Research and Treatment
Introduction
1
Gastric cancer (GC) is an aggressive malignancy associated with poor prognosis and remains one of the leading causes of cancer-related death worldwide (1). With the widespread adoption of upper gastrointestinal endoscopic screening and advancements in diagnostic techniques, an increasing number of patients are diagnosed at earlier stages (2, 3). Early gastric cancer (EGC) is pathologically defined as tumor invasion confined to the mucosal or submucosal layers (pT_1a_, pT_1b_). Despite being categorized as early-stage disease, approximately 10–20% of EGC patients present with lymph node metastasis (T_1_N_+) (4–6), significantly worsening their prognosis compared to those without nodal involvement (7). To better reflect the prognostic significance of the positive lymph nodes (PLNs) count, the 8th edition of the American Joint Committee on Cancer (AJCC) TNM staging system reclassified patients with T_1_N_3b disease from stage IIb to stage IIIb, indicating poorer survival outcomes (8). This modification underscores the ongoing debate surrounding the prognostic value of PLNs count. Furthermore, T_1_N_+_ GC has received insufficient attention, and the traditional TNM staging method relies solely on the absolute number of PLNs, which may inadequately distinguish between patients with varying prognoses (9). Thus, exploring more precise and effective lymph nodes evaluation methods is critical for achieving accurate prognostic stratification of T_1_N_+_ GC patients.
The log odds of positive lymph nodes (LODDS) represent a novel lymph node staging metric, which is defined as the natural logarithm of the ratio between the probability of being a positive lymph node and the probability of being a negative lymph node when one lymph node is retrieved (10). This novel prognostic indicator integrates both the number of PLNs and ELNs, providing a more comprehensive and accurate characterization of lymph node involvement in GC patients (11). Recent evidence has demonstrated that LODDS staging exhibit superior predictive ability compared to pathological N (pN) staging, particularly for patients undergoing extensive lymphadenectomy (12–15). Therefore, we incorporated LODDS staging into our prognostic modeling to enhance the accuracy and clinical applicability of predictions.
Currently, due to limited sample sizes, studies assessing prognostic outcomes for patients with T_1_N_+_ GC remain insufficient. Machine learning approaches have demonstrated the potential to enhance the accuracy of prognostic models by effectively managing complex clinical datasets. Therefore, we developed a machine learning-based prognostic model for patients with T_1_N_+_ GC incorporating LODDS staging, aiming to provide valuable insights for long-term survival prediction and precise risk stratification.
Material and methods
2
Patient population
2.1
Data for GC patients were extracted from the Surveillance, Epidemiology, and End Results (SEER) database (SEER 17 registries, November 2023 submission, covering the years 2000–2021) of the National Cancer Institute using SEER*Stat software (version 8.4.3) (16). As the SEER database strictly maintains patient confidentiality, informed consent was waived for this retrospective analysis. Patients diagnosed with T_1_N_+_ GC between 2010 and 2021 were selected for inclusion, encompassing both those who received upfront surgery with pathological staging (pT_1_N_+) and those who received neoadjuvant chemotherapy (NAC) followed by pathological staging (ypT_1_N+_). Patients diagnosed with neuroendocrine carcinoma (ICD-O-3: 8246/3), stromal sarcoma (8935/3), or gastrointestinal stromal tumors (GIST) (8936/3) were excluded. Additionally, patients with missing data on tumor diameter or those who received radiotherapy or had inconsistent radiotherapy information were also excluded. After applying these inclusion and exclusion criteria, 419 eligible patients remained and were included in the final analysis (Figure 1).
Flow chart of this study.
Furthermore, data from Chinese People’s Liberation Army (PLA) General Hospital First Medical Center comprising T_1_N_+_ GC patients diagnosed between 2012 March and 2024 March were collected as a validation dataset. Employing identical inclusion and exclusion criteria, a total of 193 patients were ultimately enrolled. This study has been approved by the ethic committee of the Chinese PLA general hospital (No: S2025-234-01).
Study variables
2.2
Information on age at diagnosis, sex, tumor diameter, primary site, tumor differentiation, histologic type, N stage, examined lymph nodes (ELNs), positive lymph nodes (PLNs) and treatment of GC patients were collected from SEER database. Primary site was divided into proximal (ICD-O-3 code C16.0 and C16.1), middle (ICD-O-3 code C16.2), distal (ICD-O-3 code C16.4 and C16.5) and others. Histologic type was classified based on the presence or absence of signet-ring cell carcinoma (ICD-O-3 histologic code 8940). The formula of LODDS was: . To avoid undefined or infinite values when the number of PLNs or ELNs was zero, we added 0.5 to both the numerator and the denominator (10). The X‐tile software (3.6.1) and R package “survminer” were used to determine the optimal cutoff values for the three continuous variables of age, tumor diameter, and LODDS staging according to overall survival (OS). Tumor diameter was classified as<10 and >10 mm; LODDS stage was classified as LODDS1 (<−0.9), LODDS2 (−0.9 to −0.4), and LODDS3 (>= −0.4).
Follow-up
2.3
The primary endpoint was overall survival (OS), defined as the interval from the date of diagnosis to the date of death, the date last known to be alive, or the study cut-off date. Patients from PLA General Hospital follow-up data were collected by trained assistants after patient discharge and reviewed by a senior attending physician prior to analysis. Patients received postoperative follow-ups every 3–6 months for the first two years, every 6–12 months from the third through the fifth year, and annually thereafter, according to the 2023 Chinese Society of Clinical Oncology (CSCO) guidelines for gastric cancer management (17). The median follow-up time for the SEER dataset was 80 months (95% confidence interval (CI): 66–111 months) and external validation dataset was 71 months (95% CI: 65–80 months).
Model development and evaluation
2.4
Multivariate Cox regression analyses and the least absolute shrinkage and selection operator (LASSO) algorithm were conducted using clinical characteristics derived from the SEER database. The LASSO regression was conducted using the R package “glmnet”, which applies L1 regularization to shrink regression coefficients and select relevant variables while avoiding overfitting. Variables identified as statistically significant in Cox analyses or considered clinically relevant, including age at diagnosis, primary site, LODDS staging, N staging, treatment modality, and tumor diameter, were integrated into machine learning models to predict 1-, 3-, and 5-year OS for T_1_N_+_ gastric cancer (GC) patients.
Machine learning models were constructed using the mlr3proba framework in R (18), which provides a standardized environment for model training, hyperparameter tuning, and performance evaluation under unified resampling strategies. Two machine learning algorithms: Random Survival Forest (RSF) and eXtreme Gradient Boosting (XGBoost) were implemented to predict OS. Model hyperparameters were optimized through a grid search combined with 10-fold cross-validation on the training cohort to maximize the mean concordance index (C-index). Following grid-search optimization, the RSF model’s optimal configuration consisted of 500 estimators, with both the minimum samples required to split an internal node and the minimum samples per terminal node set to 10. For the XGBoost model, the optimal parameters were 300 boosting rounds, a learning rate of 0.05, a maximum tree depth of 4, a minimum child weight of 2 and a subsample ratio of 0.8. All models were trained with fixed random seeds to ensure reproducibility.
To evaluate predictive performance, receiver operating characteristic (ROC) curves and the corresponding area under the curve (AUC) values were compared among the CoxPH, RSF and XGBoost models. Additionally, decision curve analysis (DCA) and Brier scores were employed to assess the clinical utility, precision, and accuracy of these predictive models. To further validate the RSF prognostic model, data from an independent cohort of 193 patients diagnosed with T_1_N_+_ GC at our institution were collected and analyzed.
Interpretability of the prognostic model was crucial for facilitating clinical decision-making, enabling physicians to transparently comprehend the factors influencing postoperative outcomes. Furthermore, the SHapley Additive exPlanations (SHAP) approach, a game-theoretic method, was utilized to illustrate the contribution of individual variables to model predictions, enhancing clinical interpretability (19). SHAP values were computed and plotted using the R package “shapviz”.
Statistical analysis
2.5
Differences in demographic and clinical characteristics between the training and validation cohorts were evaluated using the “tableone” R package. The Wilcoxon test for continuous variables, and either the χ² test or Fisher’s exact test for categorical variables. To investigate the associations between clinical-pathological factors and OS among T_1_N_+_ GC patients, univariate Cox analyses were performed using the “survival” R package. Variables with p< 0.05 in the univariate analyses were subsequently included in multivariate Cox regression analyses to further evaluate mortality risk and identify independent prognostic factors.
To examine the prognostic impact of NAC in patients with T_1_N_+_ GC, patients receiving NAC were matched with those who did not receive NAC using a 1:1 propensity score matching (PSM) approach implemented in the “MatchIt” R package (20, 21). Propensity scores were estimated using a multivariable logistic regression model that included relevant covariates from the SEER database. Two-tailed p-values of less than 0.05 were considered statistically significant. All statistical analyses were performed using R software (Version 4.2.3, Vienna, Austria).
Results
3
The characteristics of patients
3.1
Overall, 419 patients with T_1_N_+_ GC diagnosed between 2010 and 2021 were identified from the SEER database and used as the training dataset. Additionally, 193 patients from Chinese PLA General Hospital First Medical Center were included as a validation dataset. Table 1 summarizes the demographic and clinical characteristics of these two patient cohorts. Patients in the validation dataset had a lower mean age (58.3 vs. 67.9 years, p<0.001) and a higher proportion of patients with N2 stage (45.1%), whereas patients in the training cohort predominantly presented with stage N1 (70.9%). Furthermore, the proportion of patients who received NAC was lower in the validation dataset compared to the training dataset (5.2% vs. 27.0%, p<0.001).
Comparison between LODDS and N staging for prognosis
3.2
In terms of the N staging system, a significant difference in prognosis was observed between patients classified as N_1_ compared to those classified as N_2_ and N_3_ combined (p<0.001, hazard ratio (HR)=1.80, 95% CI: 1.31–2.78). However, there was no statistically significant prognostic difference between N_2_ and N_3_ stages (p=0.6, HR = 1.16, 95% CI: 0.66–2.05). Conversely, the LODDS staging system demonstrated superior prognostic discrimination among patient groups (Figure 2). Furthermore, LODDS staging demonstrated superior predictive accuracy compared to N staging, as indicated by higher concordance indices, with C-indices of 0.65 versus 0.57 in the training dataset and 0.67 versus 0.60 in the validation dataset, respectively. ROC analyses for predicting 1-, 3-, and 5-year OS further confirmed these findings (Supplementary Figure S1).
Kaplan–Meier survival analysis comparing N staging and log odds of positive lymph nodes (LODDS) staging in training and validation datasets. (A, B) N staging and LODDS staging for overall survival (OS) in the training dataset. (C, D) N staging and LODDS staging for overall survival (OS) in the validation dataset.
Multivariate Cox regression analyses revealed that LODDS staging was significantly associated with OS (p<0.05), while N_3_ stage was not identified as an independent prognostic factor (p>0.05). Additionally, older age, and tumor diameter emerged as independent prognostic factors significantly influencing OS (Table 2).
Features selection
3.3
The LASSO algorithm and Cox regression analyses were employed to select the variables in the study. Two variables, the tumor differentiation and signet-ring carcinoma were excluded, and the remaining 6 variables were included in the construction of the RSF model. These remaining variables included age, tumor diameter, primary site, N staging and LODDS staging. The procedures for selecting variables are shown in Figure 3.
Results of the least absolute shrinkage and selection operator (LASSO) regression analysis for the prediction models: (A) coefficient profiles plotted against log(λ); (B) ten-fold cross-validation demonstrating the optimal λ value.
After variables selecting, to ensure that there was no collinearity among the variables, we utilized Spearman correlation analysis. The correlation analysis revealed no strong correlations among the included variables (|r|< 0.5 for all pairs, and most p > 0.05). This indicates the absence of significant multicollinearity, suggesting that these variables can be simultaneously included in subsequent model construction (Supplementary Figure S2).
Model development and performance comparison
3.4
In this study, the developed prognostic models were validated using a dataset to assess the predictive performance. Among these models, the RSF algorithm demonstrated superior predictive accuracy compared to the CoxPH and XGBoost models. Specifically, the RSF model achieved the highest C-index of 0.785 and demonstrated the highest AUC for predicting 1-, 3-, and 5-year OS in both the training and validation datasets (Table 3; Figures 4A, B). All evaluated models exhibited Brier scores below 0.25, indicating robust calibration, with the RSF model notably displaying the lowest scores. Calibration curves further validated the excellent predictive accuracy of the RSF model (Figures 4C, D). Additionally, DCA showed substantial clinical net benefits of the RSF model for survival prediction at 1-, 3-, and 5-year OS (Figure 5).
Evaluation of the Random Survival Forest (RSF) model in the training and validation datasets. (A, B) Time‐dependent AUC and receiver operating characteristic (ROC) curves in the training and validation datasets. (C, D) Calibration curves of RSF model in the training and validation dataset.
The decision curve analysis (DCA) of the Random Survival Forest (RSF) model. (A–C) The 1-, 3-, 5-year DCA of the RSF model on training dataset. (D–F) The 1-, 3-, 5-year DCA of the RSF model on validation dataset.
Model explanation
3.5
The RSF model demonstrated optimal performance on both the training and validation datasets. To further clarify the contribution of each predictor variable and enhance the interpretability of the RSF model, we assessed feature importance using SHAP. The SHAP summary plots display the predictors ranked in descending order according to their average SHAP values, reflecting their relative contributions to the model predictions (Figure 6). Among these variables, LODDS staging emerged as the most influential factor (0.0683), substantially surpassing the importance of N staging (0.0167).
Global model explanation by the SHapley Additive exPlanations (SHAP) method. (A) SHAP summary dot plot. (B) SHAP summary bar plot.
Impact of NAC on ypT1N+ GC prognosis
3.6
Additionally, we compared the prognosis of ypT_1_N_+_ GC patients who underwent perioperative chemotherapy with pT_1_N_+_ patients who did not receive NAC using data from the SEER database. Considering the imbalance in baseline characteristics between these two groups, we conducted a 1:1 propensity score matching (PSM) analysis to ensure comparability (Supplementary Table S1). After matching, our results indicated no significant difference in OS between pT_1_N_+_ patients who underwent upfront surgery alone and ypT_1_N_+_ patients treated with NAC (p = 0.159, HR = 1.48, 95% CI: 0.86–2.55) (Figure 7).
Kaplan-Meier plot of pT1N+ patients who underwent upfront surgery and ypT1N+ patients treated with neoadjuvant chemotherapy (NAC).
Discussion
4
Early-stage GC generally exhibits a favorable prognosis, and satisfactory survival outcomes can typically be achieved with surgery alone (22). However, T_1_ GC patients with lymph node metastasis (T_1_N_+) tend to have significantly worse prognoses and have not received sufficient attention (23). To the best of our knowledge, this is the first study to develop an artificial intelligence (AI)-based predictive model specifically designed to evaluate long-term outcomes in patients with T_1_N+_ GC. Furthermore, the RSF model maintained good discrimination and calibration in the independent validation cohort, supporting its robustness and potential clinical utility.
Although the AJCC TNM staging system is widely used in clinical practice and provides valuable prognostic information, it has certain limitations, particularly in T_1_N_+_ GC patients. One key limitation is that N staging only considers PLNs and does not account for ELNs, which have also been shown to influence prognosis (24). Our results further demonstrate that N staging does not adequately distinguish between patient prognoses, this limitation also highlighted in the study by Que et al. (25). To overcome this limitation, we developed a predictive model based on LODDS staging, which incorporates both PLNs and ELNs into the calculation. The results indicated that LODDS staging outperforms N staging in predicting survival outcomes for T_1_N_+_ GC patients and identifying high-risk populations. A systematic review by Li et al. confirmed that LODDS is strongly correlated with GC patient prognosis and provides a more accurate prediction of survival than earlier methods. Additionally, the utility of LODDS staging has been validated in studies across various tumor types (26–29).
In the SEER cohort, discrepancies were observed between N staging and LODDS staging, likely attributable to inaccuracies in staging caused by an insufficient number of ELNs. Previous studies and AJCC guidelines recommend examining at least 16 lymph nodes to ensure accurate staging (8, 30). However, there remains ongoing debate regarding whether collecting a greater number of lymph nodes translates into survival benefits. While extensive lymph node dissection can enhance staging precision and guide adjuvant treatment decisions, it may also increase postoperative complications and morbidity. Therefore, determining an optimal range of ELNs is essential for balancing accurate staging with patient safety (31).
This prognostic model, based on the RSF algorithm, was constructed to predict both short-term and long-term survival outcomes in patients with T_1_N_+_ GC. The RSF algorithm, first introduced in 2008, has since become a widely accepted method for survival analysis and prognosis prediction (32). Compared with previous Cox regression analysis, RSF algorithm demonstrates superior performance, particularly when handling high-dimensional data (33). In the current study, our RSF model exhibited enhanced calibration and discrimination in predicting 1-, 3-, and 5-year OS for T_1_N_+_ GC patients in both the SEER-based training dataset and the validation dataset from our institution, outperforming the Cox regression and XGBoost models. Thus, the RSF model shows considerable promise in enhancing the accuracy and reliability of individualized prognostic predictions.
To overcome the “black-box” challenge of machine learning models, we employed the SHAP method to interpret our RSF model and visualize the contribution of individual predictors (19). The results indicated that LODDS staging was the most important factor, reinforcing its critical prognostic value. Primary tumor site and age at diagnosis ranked second and third, respectively, aligning with findings from previous research. In addition, multivariate Cox analysis confirmed that age and proximal GC serve as independent prognostic factors. Our findings indicate a poorer prognosis in older patients, consistent with observations by Choi et al. (34), which may be due to increased comorbidities associated with treatment and nutritional complications in this population (35, 36). Furthermore, the poor prognosis associated with proximal GC has been widely reported, which may be attributed by its distinct morphology, clinical behavior, and therapeutic responses—suggesting that proximal GC constitutes a relatively independent disease subset (37, 38).
NAC is increasingly utilized in the treatment of GC. However, controversy persists regarding prognostic differences between ypT_1_ GC patients who underwent NAC and pT_1_ GC patients who received upfront surgery (39, 40). In this study, we compared the prognoses of these two patient populations and found that the prognosis of patients classified as ypT_1_ following NAC was comparable to that of patients initially diagnosed at pathological stage pT_1_. These findings align with previous studies and further support the perspective that ypT_1_ GC patients generally have favorable clinical outcomes. This result proves the important role of NAC in the treatment of GC patients.
Our study has several limitations that should be acknowledged. First, as a retrospective analysis, it is inherently subject to missing data and selection bias. Second, due to the limited information available in the SEER database, potentially important prognostic variables such as tumor biomarkers (e.g., CEA and CA72-4) were not included in the analysis (41–43). Moreover, detailed treatment-related information, including NAC regimens and treatment durations, were not provided in the SEER database. In addition, some patients had relatively short follow-up durations, although the median follow-up time was adequate for survival estimation. Continued follow-up and data collection from additional centers are warranted to further strengthen the model’s robustness and generalizability. Lastly, given the retrospective nature of this study, prospective multicenter clinical studies are needed to further validate and confirm the clinical applicability of our prognostic model.
In conclusion, this study analyzed the clinical characteristics of patients with T_1_N_+_ GC and developed three prognostic models to predict survival outcomes. Among these, the RSF model demonstrated the best predictive performance and validated in an external cohort. Additionally, we identified key prognostic factors for T_1_N_+_ GC. Our results indicate that patients diagnosed as ypT_1_ following neoadjuvant chemotherapy have comparable survival outcomes to those initially staged as pT_1_.
The reference list from the paper itself. Each links out to its DOI / PubMed record.
- 1Bray F Laversanne M Sung H Ferlay J Siegel RL Soerjomataram I . Global cancer statistics 2022: GLOBOCAN estimates of incidence and mortality worldwide for 36 cancers in 185 countries. CA Cancer J Clin. (2024) 74:229–63. doi: 10.3322/caac.21834, PMID: 38572751 · doi ↗ · pubmed ↗
- 2Conti CB Agnesi S Scaravaglio M Masseria P Dinelli ME Oldani M . Early gastric cancer: update on prevention, diagnosis and treatment. Int J Environ Res Public Health. (2023) 20:2149. doi: 10.3390/ijerph 20032149, PMID: 36767516 PMC 9916026 · doi ↗ · pubmed ↗
- 3Xia JY Aadam AA . Advances in screening and detection of gastric cancer. J Surg Oncol. (2022) 125:1104–9. doi: 10.1002/jso.26844, PMID: 35481909 PMC 9322671 · doi ↗ · pubmed ↗
- 4Tian H Ning Z Zong Z Liu J Hu C Ying H . Application of machine learning algorithms to predict lymph node metastasis in early gastric cancer. Front Med. (2022) 8. doi: 10.3389/fmed.2021.759013, PMID: 35118083 PMC 8806156 · doi ↗ · pubmed ↗
- 5Chen J Zhao G Wang Y . Analysis of lymph node metastasis in early gastric cancer: a single institutional experience from China. World J Surg Oncol. (2020) 18:57. doi: 10.1186/s 12957-020-01834-7, PMID: 32197625 PMC 7085136 · doi ↗ · pubmed ↗
- 6Vos EL Nakauchi M Gönen M Castellanos JA Biondi A Coit DG . Risk of lymph node metastasis in T 1b gastric cancer: an international comprehensive analysis from the global gastric group (G 3) alliance. Ann Surgery. (2023) 277:e 339–e 45. doi: 10.1097/SLA.0000000000005332, PMID: 34913904 PMC 9192823 · doi ↗ · pubmed ↗
- 7Wei J Zhang Y Liu Y Wang A Fan B Fu T . Construction and validation of a risk-scoring model that preoperatively predicts lymph node metastasis in early gastric cancer patients. Ann Surg Oncol. (2021) 28:6665–72. doi: 10.1245/s 10434-021-09867-2, PMID: 33783640 · doi ↗ · pubmed ↗
- 8Amin MB Greene FL Edge SB Compton CC Gershenwald JE Brookland RK . The Eighth Edition AJCC Cancer Staging Manual: Continuing to build a bridge from a population-based to a more “personalized” approach to cancer staging. CA: A Cancer J Clin. (2017) 67:93–9. doi: 10.3322/caac.21388, PMID: 28094848 · doi ↗ · pubmed ↗