Optimizing expanded carrier screening for China: Multi-center study establishes 202-gene panel with optimal cost-effectiveness in preconception and prenatal care
Yulu Yang, Yuting Hang, WeiSheng Cheng, Yunxia Cao, Zhaolian Wei, Jing Yuan

TL;DR
A multi-center study in China found that a 202-gene panel is the most cost-effective option for carrier screening in preconception and prenatal care.
Contribution
The study identifies a 202-gene panel optimized for the Chinese population as the most cost-effective for expanded carrier screening.
Findings
Panel C (202 genes) is more cost-effective than Panel A (222 genes) in preconception screening.
Panel B (188 genes) is most cost-effective during pregnancy screening.
European screening guidelines are less applicable to the Chinese population.
Abstract
To evaluate the cost-effectiveness of different expanded carrier screening (ECS) panels for couples in China during preconception and early pregnancy (≤12+6 weeks) based on a multi-center cohort study. A multicenter, population-based study was conducted across 22 prenatal diagnosis centers in China from August 2022 to June 2023, enrolling 2,996 participants. Geographical distribution and at-risk gene frequencies were analyzed, categorizing the 222-gene panel into three groups: Panel A (222 genes), Panel B (188 genes, compliant with international guidelines), and Panel C (202 genes, optimized for the Chinese population). Decision-tree models assessed cost-effectiveness in two clinical scenarios: Preconception and During Pregnancy. Additionally, two distinct outcomes were employed: payoff 1 was defined as the number of necessary medically termination, while payoff 2 was the number of…
Genes, proteins, chemicals, diseases, species, mutations and cell lines named across the full text — each resolved to its canonical identifier and authoritative record.
Click any figure to enlarge with its caption.
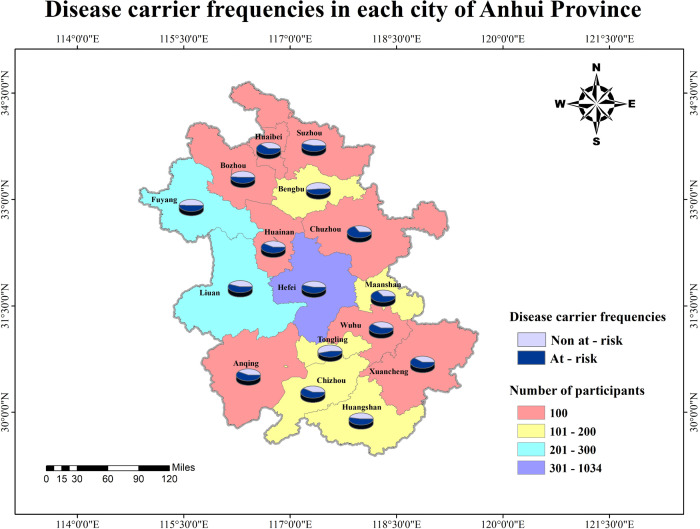 Fig 1
Fig 1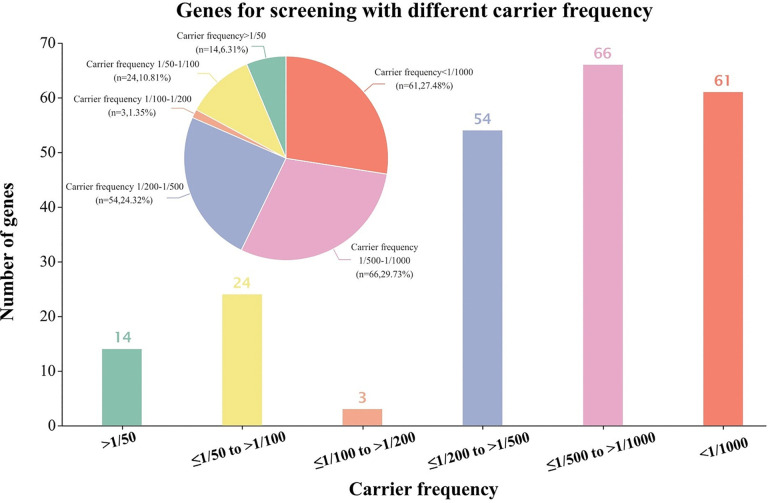 Fig 2
Fig 2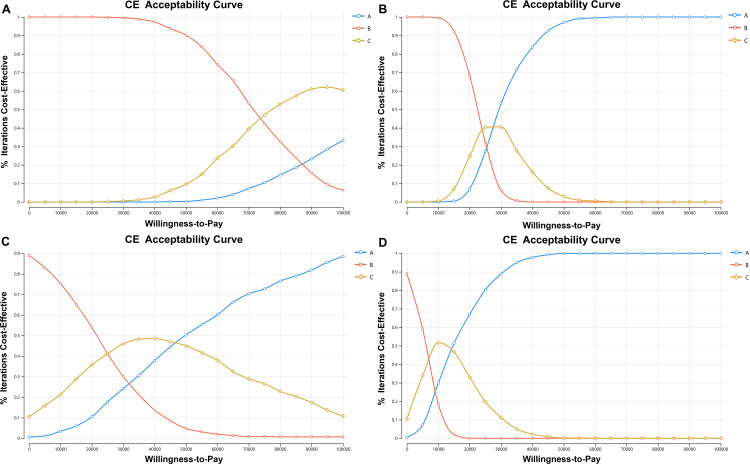 Fig 3
Fig 3- —http://dx.doi.org/10.13039/501100013290National Key Research and Development Program of China Stem Cell and Translational Research
Peer Reviews
No public reviews on file for this paper yet. If you reviewed it on a platform where reviews are public (OpenReview, ICLR, NeurIPS, ICML), you can paste yours below so the community can read it here.
Videos
No videos yet. Explain this paper in a talk, walkthrough, or lecture? Add one.
Taxonomy
TopicsCystic Fibrosis Research Advances · Dialysis and Renal Disease Management · Infant Development and Preterm Care
Introduction
Recessive monogenic genetic diseases are characterized by autosomal recessive inheritance, high teratogenicity and mortality rates, substantial treatment costs and elevated carriage rates for certain pathogenic variants [1–5]. Effectively identifying couples at potential risk of having offspring affected by such genetic diseases is of significant importance. Expanded carrier screening (ECS) [6–10], conducted through next-generation sequencing (NGS) [11–15], accomplishes for dozens to hundreds of autosomal recessive or X-related recessive monogenic genetic diseases in a single test [16–20]. The results of this screening provide a critical basis for subsequent pregnancy counseling [21–24], leading to its widespread recognition as a valuable tool. However, it is unclear how many genes and diseases should be included on ECS panels.
Most existing studies have focused primarily on the number of genes included, with the underlying assumption that the goal of screening should be to maximize disease coverage rather than to tailor it to specific ethnic groups or regions [25–30]. In reality, the more types of diseases included in screening, the higher the associated costs. Therefore, the design of ECS panels must strike an optimal balance between the number of genes/diseases, costs, and potential benefits [31–33]. Notably, such scholarly investigation is rarely found in academic publications. In the present study, we conducted a multicenter expanded carrier screening research in Anhui province, China, to estimate the carrier rates of 222 recessive Mendelian disorders, with the aim of informing the design and utility of ECS panels. Additionally, we grouped these 222 genes according to different criteria to determine which type of screening panel achieves the best balance for the Chinese population.
Materials and methods
Study population
A total of 2,996 participants (1,498 couples) from 22 prenatal diagnosis centers in Anhui Province, China, underwent expanded carrier screening between August 2022 and June 2023. In this study, apparently healthy couples who were considering pregnancy or already in early pregnancy (≤12^+6^ weeks) were included. Couples were excluded if they: (1) were undergoing assisted reproduction technology (included in vitro fertilization, intracytoplasmic sperm injection and preimplantation genetic diagnosis), (2) had one or both spouses with abnormal phenotypes and an either high suspicion of or a confirmed diagnosis of hereditary diseases, (3) had one or both spouses who had received an organ transplant, allogeneic blood transfusion, or immunotherapy within one year prior to enrollment. All included couples provided written informed consent to participate in this study, and the study protocol was approved by the PJ20200561. All research procedures were carried out in accordance with the Declaration of Helsinki.
Basic characteristics and genomic sequencing
Couple’s demographic and clinical data were collected via online questionnaires, including age, ethnicity, educational attainment, employment type, income level, family history of genetic diseases, and history of adverse pregnancies. Eligible couples provided peripheral blood samples, which were tested using high-throughput sequencing technology and 222 genes were analysed. Ultimately, screening results from 2,996 participants were collected to establish a database.
Screening data analyzed
Primarily, we observed the geographical distribution of the data and compile preliminary statistics on screening results across different cities in Anhui Province. We linked variant genes to recessive monogenic disorders, and counted the carrier frequencies of each single-gene disorder as well as the rates of high-risk couples for diseases involving various systems. High-risk couples were defined as those in which both partners carry the same autosomal recessive variant gene or the female partner carries X-linked pathogenic genes.
We selected this 222-gene panel because it is the ECS currently offered by the 22 centers in Anhui, and designated it as the initial Panel A. We analysed the carrier frequency of genes in the 222-ECS panel to inform further analyses. Notably, the American College of Obstetricians and Gynecologists (ACOG) defines ECS as permitting panels of varying sizes [34]. In accordance with the ACOG Committee opinion, we established Panel B based on the following inclusion criteria: (1) screening for cystic fibrosis, spinal muscular atrophy, thalassemias and hemoglobinopathies, (2) Fragile X premutation carrier screening for women, (3) a carrier frequency of 1 in 100 or greater, with a well-defined phenotype, (4) a detrimental effect on quality of life, cause cognitive or physical impairment, or have an onset early in life. Among these criteria, a carrier frequency is greater than 1/100 as studies show that this carrier frequency level can screen almost 96% of high-risk couples in Europe. However, regional variations exist, and the applicability of these criteria to the Chinese population has not been evaluated. Therefore, we stratified the 222 genes in Panel A by their carrier frequencies, calculated the screening coverage rates of each stratum, and determined the rates of at-risk couples across different carrier frequency levels. We then analyzed the most appropriate screening panel for the Chinese population and selected genes meeting these optimized criteria, designating this set as Panel C.
Modes of screening
For this study, we evaluated those three panel sizes: Panel A group: couples were screened by current 222-ECS panel conditions. Panel B group: couples were screened through the panel met ACOG criteria, and we selected the severe diseases which disease severity was classified by meeting the ACOG criteria and American College of Medical Genetics and Genomics (ACMG) criteria [35]. Panel C group: the panel met ACOG criteria but with the appropriate carrier frequency in China which we analyzed.
Decision tree and cost-effectiveness models
TreeAge software (TreeAge Pro Healthcare Software, version 2022, R1.2) was used to simulate how ECS outcomes during pregnancy and preconception affect pregnancy progression by implementing two transition-state models. A model-based economic evaluation was conducted to assess the cost-effectiveness of interventions utilising different ECS panels for the prevention of recessive monogenic genetic newborns. In modelling the rates of at-risk couples opting for preimplantation genetic diagnosis (PGD), invasive testing for abnormal results, live birth, termination and stillbirth in each clinical scenario, published probabilities and costs were employed, as demonstrated in Tables [36–41]. The probabilities of 222 autosomal or X-linked gene variants in newborns exposed to different risk groups were calculated. The incidence probability of undetected diseases in the Panel B and C was then calculated in comparison with the Panel A, also illustrated in Tables.
Probability ranges were incorporated into the model for sensitivity analysis as well. Screening costs were estimated on the basis of the published fees of the Prenatal Diagnosis Centre of the First Affiliated Hospital of Anhui Medical University and key informants. Based on item costs in the year 2023, screening costs were collected in Renminbi (RMB ¥) and converted to US dollars (US 1. In the absence of reference payoff, two distinct payoffs were employed to enhance the scientific rigor and credibility of the study. Payoff 1 represented the number of necessary terminations, payoff 2 was the number of newborns without recessive monogenic genetic diseases. We calculated overall costs, incremental cost-effectiveness ratios (ICERs) between the panels. Willingness-to-pay (WTP) was $100,000 per as recommended by the World Trade Organization (WTO).
Statistics
All data in this study were analyzed by R programme (R Studio software, version 4.3.2). ArcGIS software (ArcGIS software, version 10.8.2) was used to map the distribution of screening results across cities in Anhui Province. The base map of Anhui Province is based on the standard map from the Standard Map Service of the Ministry of Natural Resources of the People’s Republic of China (http://bzdt.nasg.gov.cn/index.jsp). The original map is publicly available and is provided for academic use. To evaluate the payoff of panels with different sizes, we employed the TreeAge software (TreeAge Pro Healthcare Software, version 2022, R1.2) to construct two decision trees (Preconception and During pregnancy) and cost-effectiveness analyses. We reported this study according to the reporting guidelines of Consolidated Health Economic Evaluation Reporting Standards (CHEERS).
Results
Multi-centres data analysis
Fig 1 illustrated the carrier frequency across cities in Anhui Province. Among all participants, 1656 were identified as at-risk for the 222-panel, while 1,340 were not at-risk, and a total of 90 participants (45 couples, accounting for 3% of all enrolled couples) were identified as high-risk couples (see S1 and S2 Tables). The population carrier rate of each gene in the 222-gene panel was collected as a databank, see S3 Table. The metabolic system was the most commonly affected (42%), whereas the oculo-auditory system had the highest at-risk couple rate (ACR) (1.6%) (S4 Table). We further stratified the genes of the 222 panel into six groups according to their carriage rate in the participants (Fig 2). There were 38 genes had more than 0.01 carrier frequency, while only 3 genes between <0.01 to ≥0.005. Similarly, even if the carrier frequency of the genes doubled, the proportion of high-risk couples detected by screening did not increase significantly (rising only from 73% to 80%). It is noteworthy that 95 genes with a carrier rate >0.002 enabled the detection of 92% of variant carriers and 100% of high-risk couples (S5 Table). Thus, adopting a carrier rate threshold of >1/500 as the inclusion criterion for ECS panels appears more prudent for the Chinese population. In addition to the aforementioned criteria, the severity of diseases associated with each gene was taken into account. We finally incorporated 188 genes into Panel B group and 202 genes into Panel C group. Panel B group identified 33 high-risk couples while Panel C group identified all 45 high-risk couples.
Disease carrier frequencies in each city of Anhui Province.The diagram shows distribution of at-risk population screened by expanded carrier screening in Anhui Province.
Genes for screening with different carrier frequency.The graph indicates the number of genes with different level of carrier rates based on the large ECS screening study in Anhui Province.
Cost-effectiveness analysis
The population willing to undergo ECS tests consists of couples during pregnancy and those in the preconception period. However, the decision-making context differs entirely after evaluation of ECS results. Therefore, we analyzed the outcomes of distinct decision-tree models for preconception and prenatal screening separately, which constitutes a more comprehensive approach. Table 1 shows the basic parameters of the models.
Table 1: Basic Parameters of Models and Range for Sensitivity analysis.
Preconception model analyses
Table 2 presents the base-case results of the two decision trees. In the preconception model, the estimated total cost of Panel B group (US 5,214), followed by Panel C (US 533. Regarding the first outcome (payoff 1: number of necessary terminations), the ICER for Panel C was US 120,796. For second outcome (payoff 2: number of the newborn without recessive monogenic genetic diseases), three panels were all cost-effective. The ICER for Panel C was US 27,533.
Table 2: Base-case cost-effectiveness analyses summary.
We conducted several sensitivity analyses on major model parameters to assess their effects on the model. Probabilistic sensitivity analyses were conducted to identify the optimal strategy at varying willingness-to-pays thresholds through Monte Carlo simulation by 1,000 times iterations. Using payoff 1 as the benefit indicator, Panel C was the optimal strategy at WTP thresholds of US 75,000, which is considered acceptable, while unacceptable ICER for Panel A exceeds US 306, Panel A would become the optimal strategy (S1 Fig). With respect to avoiding the birth of newborns with recessive monogenic disorders, Panel A was the strategy most likely to be cost-effective as WTP increased (Fig 3A, 3B).
Cost-effectiveness acceptability curves are shown for different size of expanded carrier frequency.The dotted lines represent the probability of each strategy being cost-effective at willingness-to-pay thresholds of US 10 000/payoff. (A) part A indicates the probability of cost-effectiveness at different willingness-to-pay thresholds with payoff 1 (the avoidance of unnecessary) in the Preconception model; (B) part B shows the cost-effectiveness acceptability analysis with payoff 2 (the number of the newborn without recessive monogenic genetic diseases) in the Preconception model; (C) part C indicates the probability of cost-effectiveness with payoff 1 in the During pregnancy model; (D) part D express the analysis between three size of ECS with payoff 2 in the During pregnancy model. All results of probabilistic sensitivity analyses for three panels were undergoing 1,000 Monte Carlo simulations.
During pregnancy model analyses
In the During pregnancy decision tree, the mean cost of Panel B was US 990 for Panel A. The ICER of Panel A was US 26,449. Compared with Panel B, couples screened with Panel A had an increase of 2,052 healthy newborns and 577 necessary terminations. For the acceptability curve of payoff 1, Panel C was the optimal strategy at the WTP thresholds below US 45,656, Panel A was most cost-effective. Similarly to the results of payoff 2, Panel C was the most cost-effective option at a willingness-to-pay threshold below US $13,579, beyond which Panel A became optimal. In summary, Panel B was the most likely cost-effective strategy at lower WTP thresholds, while as the thresholds increased, Panel A became the most cost-effective (Fig 3C, 3D).
Discussion
Expanded carrier screening is a well-established approach for detecting recessive monogenic disorders [41–45], although the optimal composition and size of gene panels remain debated. Reported differences in carrier frequencies across ethnic groups [46–48] underscore the importance of evaluating the performance of internationally recommended gene-selection criteria, such as those from the ACOG in Chinese populations, and of identifying the most cost-effective panel configuration.
To our knowledge, this is the first study to report carrier frequencies for 222 genes in Anhui Province, China, and to assess the cost-effectiveness of differently sized panels. Our findings revealed distinct carrier frequency patterns: 38 genes had a carrier frequency of ≥1/100 among participants in Anhui, with only 3 genes falling between <1/100 and ≥1/200. Critically, genes with a carrier frequency >1/500 accounted for 92% of variant carriers and 100% of at-risk couples, a distribution distinct from European data. These results highlight the necessity of region-specific gene selection for ECS panels, reinforcing that gene inclusion criteria must be tailored to local genetic landscapes. Therefore, it is enough reasonable to confirm the inclusion of genes in the screening panel suit measures to local conditions. Subsequently, we categorized panels based on three criteria: (1) all 222 genes (Panel A); (2) genes meeting ACOG guidelines (Panel B, 188 genes); and (3) genes optimized for Anhui’s population (Panel C, 202 genes).
Clinical decision-making requires cost-effectiveness comparisons among available options [49–51]. Using decision-tree models that incorporated disease incidence, clinical impact, and costs, we evaluated each panel’s economic value across a range of willingness-to-pay thresholds. In this study, we designed two decision tree models to evaluate the cost and clinical benefits of medical interventions. In the Preconception model, the 222-gene panel (Panel A) was the most cost-effective for increasing the number of healthy newborns, particularly at higher WTP thresholds. For reducing unnecessary terminations (payoff 1), the 202-gene panel (Panel C) emerged as the optimal choice, with an incremental cost-effectiveness ratio of US 100,000. When couples ECS during early pregnancy, Panel C remained cost-effective for avoiding unnecessary terminations at WTP thresholds below US 45,656). For maximizing healthy newborns free of recessive disorders (payoff 2), Panel A was most cost-effective across most WTP thresholds (reaching ~90% cost-effectiveness at the highest thresholds) and its cost-effectiveness peaked when WTP reached US $50,000. Above all, the 188-gene panel (Panel B), which strictly follows ACOG guidelines, was not optimal in either the preconception or pregnancy scenarios, further supporting the need for region-specific optimization.
Several limitations merit consideration. Firstly, while our multicenter study involved a substantial sample (2996 participants), larger and more geographically diverse cohorts are needed to refine carrier frequency estimates, as genetic variation may exist across China’s provinces. Secondly, cost projections for Panels B and C derived from institutional data in Anhui, and absolute ICER values may shift in regions with different healthcare cost structures (e.g., urban vs. rural areas or provinces with varying labor and material costs). However, the relative superiority of Panel C over Panel B is likely to hold, as this comparison is driven by gene relevance to local disease burdens rather than absolute cost differences. Thirdly, we conducted this study with direct costs only, indirect costs (e.g., Nutrition cost during pregnancy, transportation for clinical visits, or productivity losses due to caregiving) were not included, which may underestimate the full economic impact of screening. Fourthly, we did not account for the risk of loss to follow-up after invasive testing or test performance metrics such as false-positive rates, which could affect the accuracy of cost-effectiveness estimates. Fifthly, some variables (e.g., maternal risk of carrying autosomal recessive or X-linked variant genes) lacked precise variation ranges, a common challenge in economic evaluations, which may introduce uncertainty. Finally, these findings reflect Anhui’s regional context, and validation in other Chinese provinces is needed to confirm generalizability, given differences in ethnic composition, healthcare infrastructure, and disease prevalence across the country.
Conclusions
In conclusion, our study highlights the importance of region-specific expanded carrier screening panels for Chinese couples, and universal standards may not align with local genetic and healthcare contexts. Design of an effective panel must integrate local epidemiology, cost considerations, and clinical objectives rather than relying on universal standards. The 202-gene panel (Panel C) achieves a balance between cost and effectiveness across most clinical and economic scenarios, while the 222-gene panel (Panel A) may be preferred for couples prioritizing comprehensive screening at higher WTP thresholds. These findings provide evidence-based guidance for clinicians and couples navigating preconception or prenatal screening, reinforcing the value of regionally optimized ECS panels in improving reproductive outcomes.
Supporting information
S1 FigTornado Diagrams of sensitivity analysis (Panel A vs C).(TIF)
S1 TableCarrier frequencies in each city of Anhui Province.(DOCX)
S2 TableRelated gene data of high risk couples.(DOCX)
S3 TableCarrier frequencies of each gene.(DOCX)
S4 TableDisease carrier frequencies in each system.(DOCX)
S5 TableCumulative carrier frequencies of different rates.(DOCX)
S1 DataCHEERS checklist.(PDF)
The reference list from the paper itself. Each links out to its DOI / PubMed record.
- 1Gregg AR, Aarabi M, Klugman S, Leach NT, Bashford MT, Goldwaser T, et al. Screening for autosomal recessive and X-linked conditions during pregnancy and preconception: a practice resource of the American College of Medical Genetics and Genomics (ACMG). Genet Med. 2021;23(10):1793–806. doi: 10.1038/s 41436-021-01203-z 34285390 PMC 8488021 · doi ↗ · pubmed ↗
- 2Shteinberg M, Haq IJ, Polineni D, Davies JC. Cystic fibrosis. Lancet. 2021;397(10290):2195–211. doi: 10.1016/S 0140-6736(20)32542-3 34090606 · doi ↗ · pubmed ↗
- 3De Silva SR, Arno G, Robson AG, Fakin A, Pontikos N, Mohamed MD, et al. The X-linked retinopathies: Physiological insights, pathogenic mechanisms, phenotypic features and novel therapies. Prog Retin Eye Res. 2021;82:100898. doi: 10.1016/j.preteyeres.2020.100898 32860923 · doi ↗ · pubmed ↗
- 4Markossian S, Ang KK, Wilson CG, Arkin MR. Small-Molecule Screening for Genetic Diseases. Annu Rev Genomics Hum Genet. 2018;19:263–88. doi: 10.1146/annurev-genom-083117-021452 29799800 · doi ↗ · pubmed ↗
- 5Ontario Health(Quality). Carrier Screening Programs for Cystic Fibrosis, Fragile X Syndrome, Hemoglobinopathies and Thalassemia, and Spinal Muscular Atrophy: A Health Technology Assessment. Ont Health Technol Assess Ser. 2023;23(4):1–398. 37637488 PMC 10453298 · pubmed ↗
- 6Gregg AR. Expanded Carrier Screening. Obstet Gynecol Clin North Am. 2018;45(1):103–12.29428278 10.1016/j.ogc.2017.10.005 · doi ↗ · pubmed ↗
- 7Shapiro AJ, Kroener L, Quinn MM. Expanded carrier screening for recessively inherited disorders: economic burden and factors in decision-making when one individual in a couple is identified as a carrier. J Assist Reprod Genet. 2021;38(4):957–63. doi: 10.1007/s 10815-021-02084-6 33501564 PMC 8079588 · doi ↗ · pubmed ↗
- 8Van Steijvoort E, Chokoshvili D, W Cannon J, Peeters H, Peeraer K, Matthijs G, et al. Interest in expanded carrier screening among individuals and couples in the general population: systematic review of the literature. Hum Reprod Update. 2020;26(3):335–55. doi: 10.1093/humupd/dmaa 001 32099997 · doi ↗ · pubmed ↗