Investigation of the Na–Ga Phase Diagram
Chia-Chi Yu, Marcus Schmidt, Michael Baitinger, Yuri Grin

TL;DR
This study investigates the sodium-gallium phase diagram, identifying melting and decomposition temperatures of various phases.
Contribution
The paper provides new experimental data on the Na–Ga phase diagram using HF-DSC and PXRD.
Findings
Na22Ga39 melts congruently at 549(2) °C.
A monotectic reaction occurs between Na22Ga39 and melt at 495(2) °C.
The critical temperature of the liquid two-phase region is estimated at 523(2) °C.
Abstract
The Na–Ga phase diagram was reinvestigated by heat-flux differential scanning calorimetry (HF-DSC) and powder X-ray diffraction (PXRD). The most sodium-rich phase, Na22Ga39, melts congruently (549(2) °C), while Na7Ga13 (545(2) °C), Na2Ga7 (501(2) °C), and NaGa4 (495(2) °C) decompose peritectically. In the sodium-rich region, a monotectic reaction between Na22Ga39 and melt occurs at 495(2) °C. The critical temperature of the liquid two-phase region was estimated to 523(2) °C. The subtle differences in the decomposition temperatures of neighboring phases were resolved by differential thermal analysis using a mutual sample reference method.
Genes, proteins, chemicals, diseases, species, mutations and cell lines named across the full text — each resolved to its canonical identifier and authoritative record.
Click any figure to enlarge with its caption.
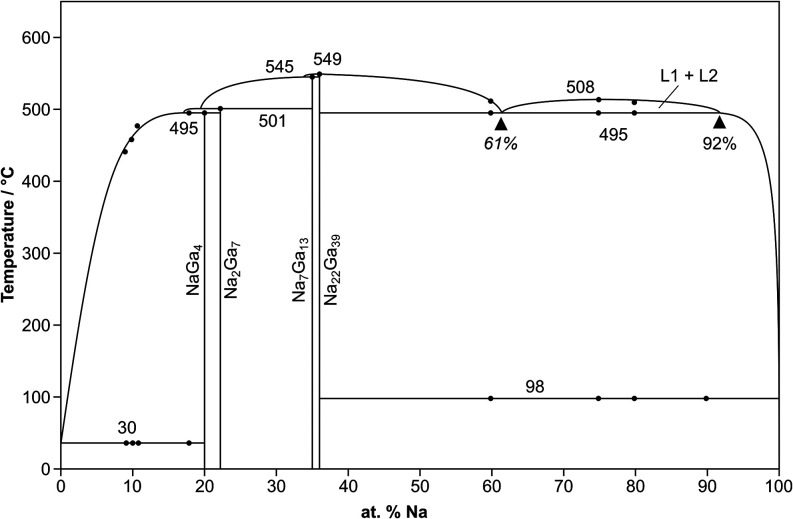 Figure 1
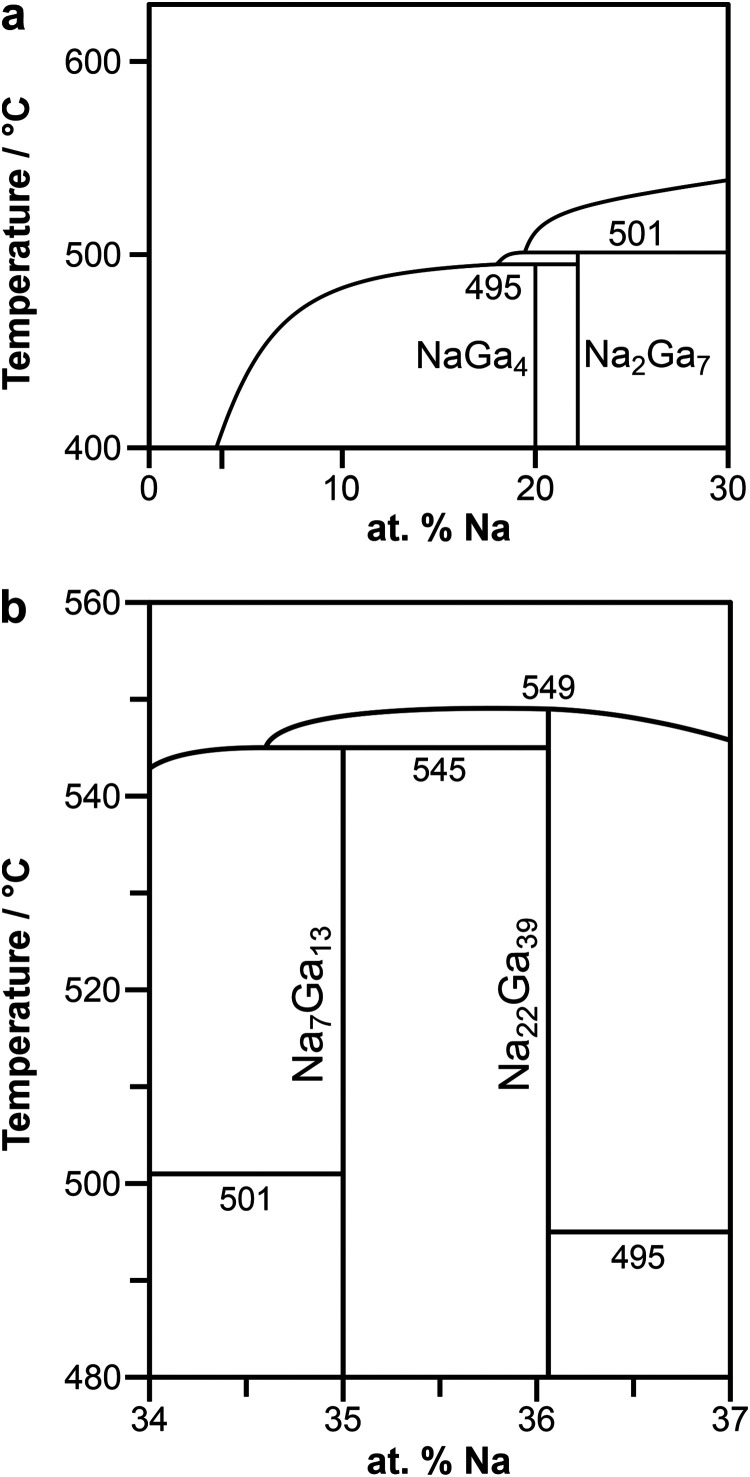 Figure 2
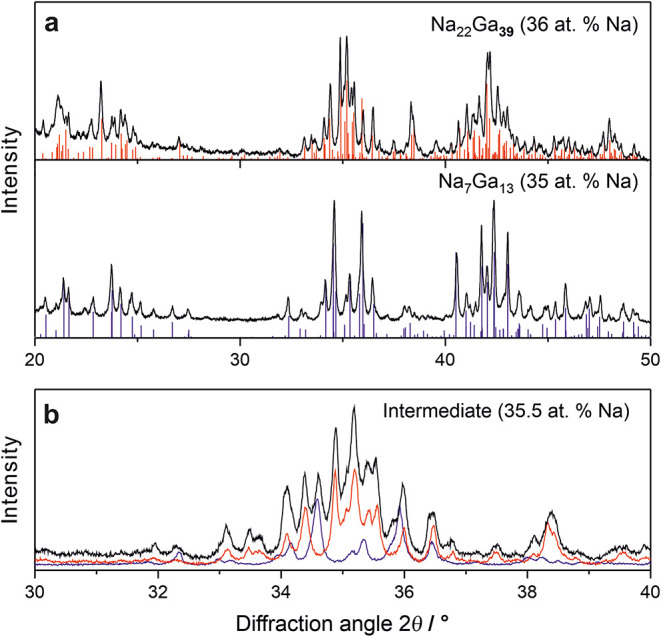 Figure 3
 Figure 4
 Figure 5
Peer Reviews
No public reviews on file for this paper yet. If you reviewed it on a platform where reviews are public (OpenReview, ICLR, NeurIPS, ICML), you can paste yours below so the community can read it here.
Videos
No videos yet. Explain this paper in a talk, walkthrough, or lecture? Add one.
Taxonomy
TopicsThermodynamic and Structural Properties of Metals and Alloys · Thermal Expansion and Ionic Conductivity · Molten salt chemistry and electrochemical processes