Clinical and genetic determinants of survival in amyotrophic lateral sclerosis patients from North India
Shiffali Khurana, Mandaville Gourie-Devi, Yuvraj Vats, Sagar Verma, Nirmal Kumar Ganguly, Parul Chugh, Ankkita Sharma, Laxmi Khanna, Uma Dhawan, Vibha Taneja

TL;DR
The study explores how genetic and clinical factors affect survival in ALS patients from North India, revealing insights into disease progression and risk factors.
Contribution
The study identifies novel genetic variants and their association with survival outcomes in North Indian ALS patients.
Findings
Males and bulbar-onset patients showed higher risk for shorter survival in ALS.
Genetic variations were linked to delayed disease onset and reduced life expectancy.
16.7% of patients had variations in more than one gene, supporting an oligogenic basis for ALS.
Abstract
Amyotrophic lateral sclerosis (ALS) is a fatal neurodegenerative disease characterized by progressive motor neuron degeneration, with significant clinical and genetic variability. While the role of genetic factors is well-established in ALS pathogenesis, their impact on survival outcomes remains poorly understood, particularly in the Indian population. We performed whole-exome sequencing in 159 ALS patients from North India (familial = 2, sporadic = 157). Clinical parameters, including age at onset, site of onset, sex, family history and survival, were recorded. Males exhibited shorter survival than females, but did not achieve statistical significance (median: 48 versus 60 years, P = 0.05). Bulbar-onset patients developed ALS at a significantly older age (mean: 59.7 versus 54 years, P = 0.007) and experienced poorer survival outcomes than spinal-onset patients (median: 48 versus 60…
Genes, proteins, chemicals, diseases, species, mutations and cell lines named across the full text — each resolved to its canonical identifier and authoritative record.
Click any figure to enlarge with its caption.
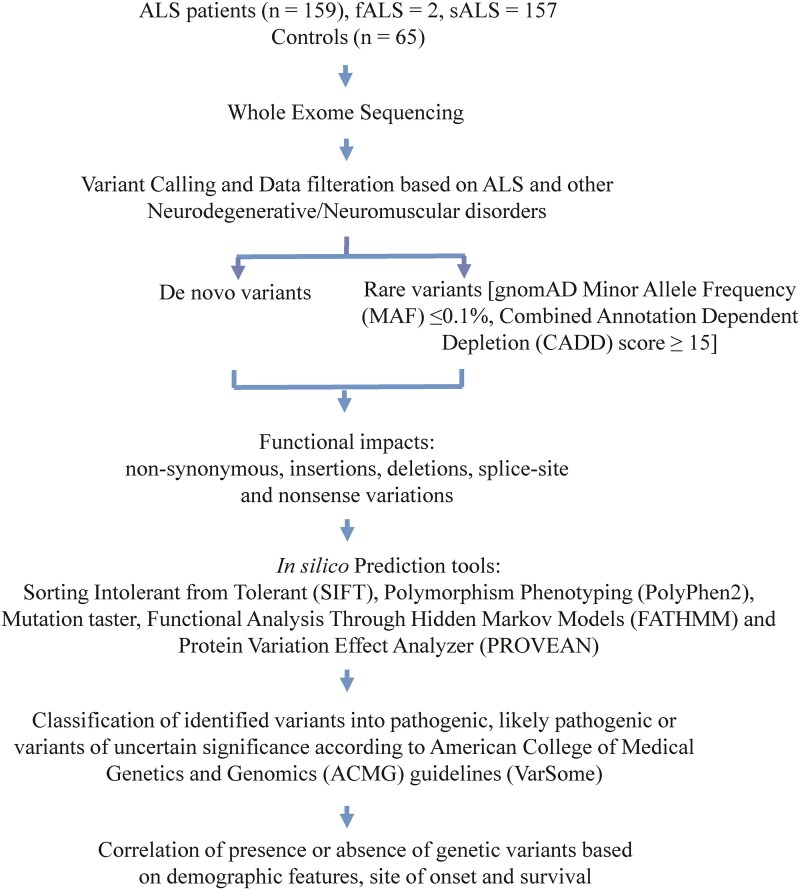 Figure 1
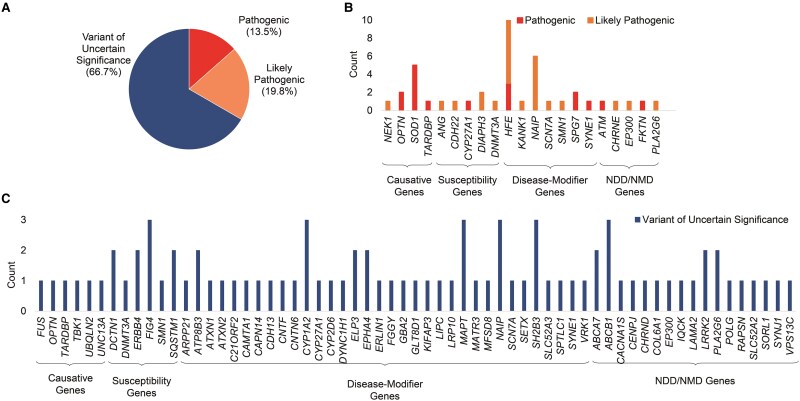 Figure 2
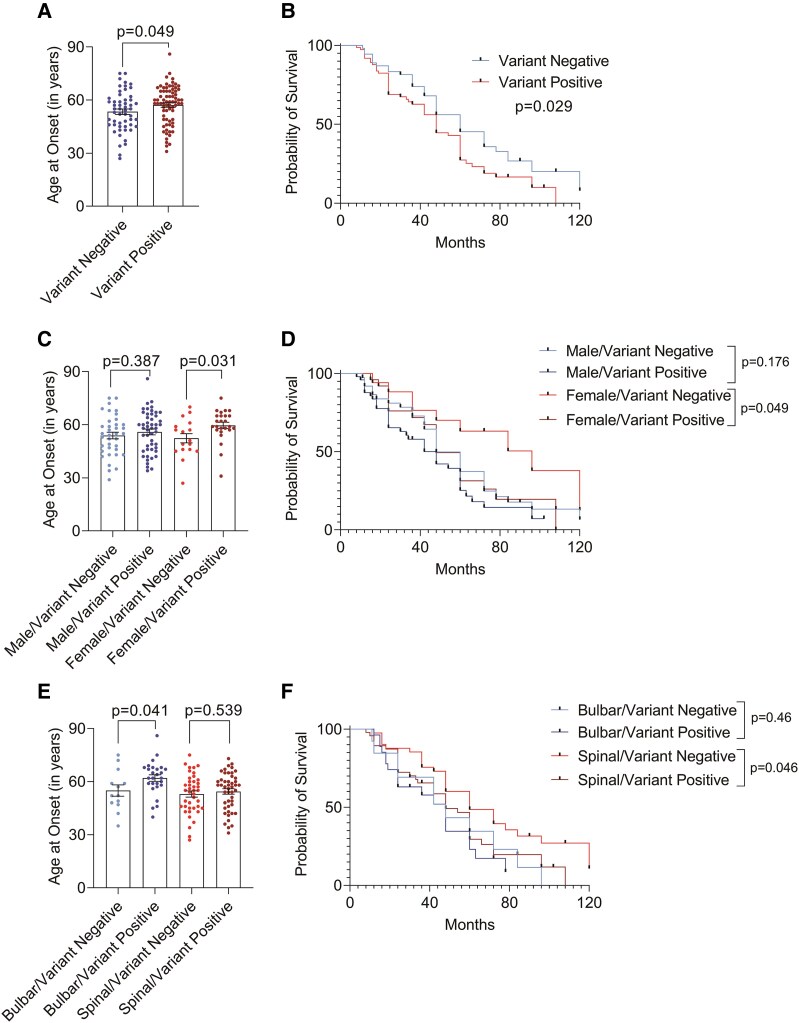 Figure 3
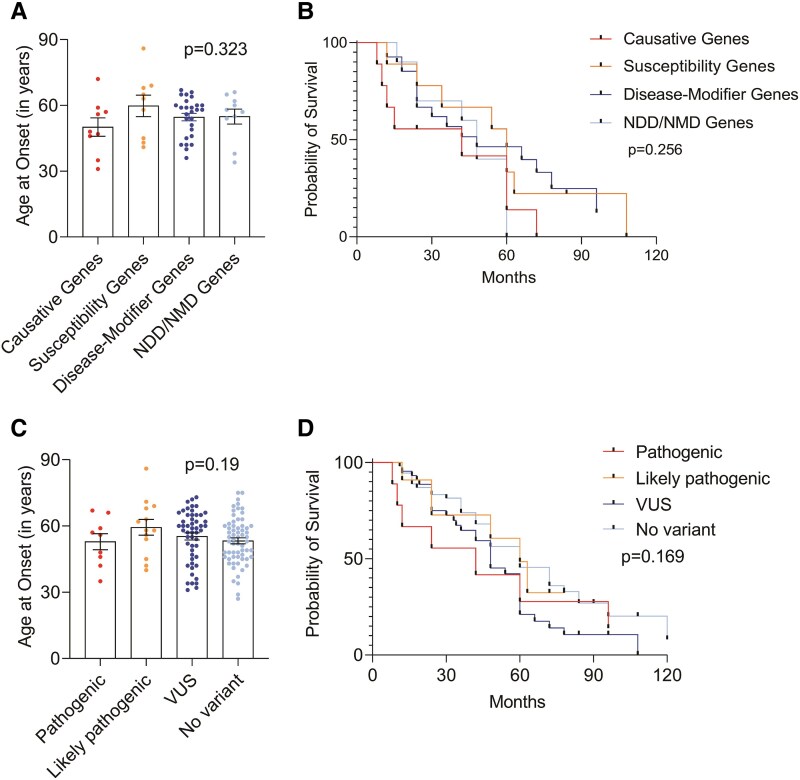 Figure 4
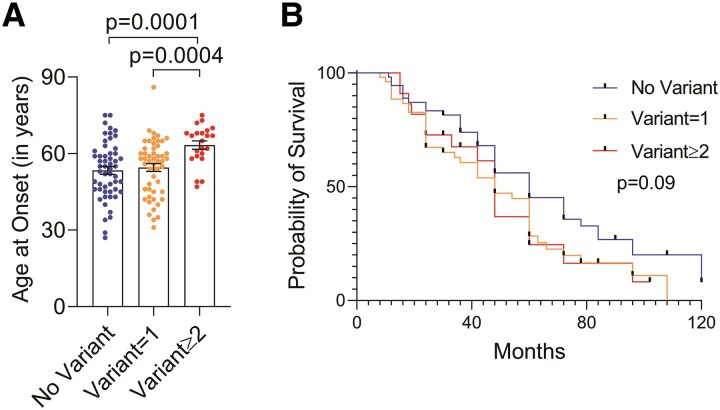 Figure 5
| Total | Males | Females |
| |
|---|---|---|---|---|
| Number of patients, | 159 | 106 (66.7%) | 53 (33.3%) | |
| Age at onset, mean ± SD | 55.31 ± 10.83 | 55.02 ± 11.14 | 55.79 ± 10.19 | 0.379 |
| Site of onset | ||||
| Bulbar, | 49 (30.8%) | 27 (25.5%) | 22 (41.5%) |
|
| Spinal, | 110 (69.2%) | 79 (74.5%) | 31 (58.4%) | |
| Survival duration (in months), median (IQR) | 48.0 (24.0–72.0) | 48 (24.0–72.0) | 60.0 (36.0–78.0) | |
| Survival status | ||||
| Deceased, | 98 (61.6%) | 68 (64.1%) | 30 (56.6%) | 0.652 |
| Alive, | 40 (25.2%) | 25 (23.6%) | 15 (28.3%) | |
| Lost to follow-up, | 21 (13.2%) | 13 (12.3%) | 8 (15.1%) | |
| Variation | ||||
| Present | 92 (60.4%) | 61 (57.5%) | 31 (58.4%) | 0.99 |
| Absent | 67 (39.6%) | 45 (42.5%) | 22 (41.5%) | |
| Short (≤24 months) | Average (25–60 months) | Long (61–120 months) | Very long (>120 months) |
| |
|---|---|---|---|---|---|
| Number of patients, | 37 (23.3%) | 59 (37.1%) | 32 (20.1%) | 10 (6.3%) | |
| Age at onset, mean ± SD | 57.68 ± 11.03 | 54.93 ± 11.90 | 54.34 ± 9.64 | 55.50 ± 6.49 | 0.634 |
| Sex | |||||
| Male, | 28 (75.7%) | 39 (66.1%) | 19 (59.4%) | 7 (70%) | 0.538 |
| Female, | 9 (24.3%) | 20 (33.9%) | 13 (40.6%) | 3 (30%) | |
| Site of onset | |||||
| Bulbar, | 17 (46%) | 16 (27.1%) | 7 (21.9%) | 3 (30%) | 0.137 |
| Spinal, | 20 (54%) | 43 (72.9%) | 25 (78.1%) | 7 (70%) | |
| Survival duration (in months), median (IQR) | 12.0 (10.5–12.0) | 42 (24.0–48.0) | 84 (72.0–99.0) | 174 (144.0–252.0) | |
| Survival status | |||||
| Deceased, | 32 (86.5%)a,d | 44 (74.6%)b,c | 20 (62.5%)a,b,e | 2 (20%)c,d,e |
|
| Alive, | 5 (13.5%) | 15 (25.4%) | 12 (37.5%) | 8 (80%) | |
| Variation | |||||
| Present | 28 (75.7%)a | 33 (55.9%) | 13 (40.6%)a | 6 (60%) |
|
| Absent | 9 (24.3%) | 26 (44.1%) | 19 (59.4%) | 4 (40%) | |
| Gene | Patient ID | Variant | ACMG classification | Another gene (variant; classification) | Demographic features | Clinical parameters | ||
|---|---|---|---|---|---|---|---|---|
| Age at onset | Sex | Site of onset | Survival duration (in months) | |||||
| SOD1 | P79 | p.H43R | P | — | 48 | M | Both lower limb | 60 |
| P17 | p.A4T | P | — | 35 | M | Right upper limb | 8 | |
| P97 | p.A4T | P | — | 57 | M | Left lower limb | 12 | |
| P140 | p.L84F | P | PLA2G6 (p.V310M; VUS) | 50 | F | Left lower limb | - | |
| P129 | p.L84F | P | NEK1 (p.R738X; LP), KANK1 (p.G1234X; LP), ATP8B3 (p.P188R; VUS),CENPJ (p.G1286D; VUS) | 59 | M | Bulbar | 15 | |
| TARDBP | P67 | p.I383V | P | — | 46 | M | Right upper limb | 10 |
| P136 | p.M405L | VUS | EP300 (p.D32G; VUS) | 47 | M | Right upper limb | 72 | |
| FUS | P206 | p.R269W | VUS | CNTN6 (p.A871V; VUS), ERLIN1 (p.A34V; VUS) | 72 | M | Bulbar | 24 |
| TBK1 | P176 | p.G272D | VUS | — | 31 | F | Right lower limb | 60 |
| OPTN | P111 | p.E399X | P | — | 56 | M | Left lower limb | 42 |
| P75 | p.E399X | P | CYP2D6 (p.A305V; VUS) | 75 | F | Bulbar | 24 | |
| P117 | p.K489E | VUS | ATM (p.S2812Vfs*3; P) | 49 | F | Right upper limb | 48 | |
| FIG4 | P158 | p.I272M | VUS | — | 65 | F | Bulbar | 60 |
| P164 | p.A358V | VUS | ELP3 (p.D183G; VUS) | 68 | F | Bulbar | 7 | |
| P32 | p.S168R | VUS | UNC13A (p.A662E; VUS), GLT8D1 (p.L160V; VUS) | 69 | M | Bulbar | 48 | |
| SQSTM1 | P205 | p.R393W | VUS | — | 58 | F | Right upper limb | 108 |
| P80 | p.R393W | VUS | VPS13C (p.G3344R; VUS) | 67 | F | Bulbar | 48 | |
| HFE | P204 | p.C282Y | P | — | 59 | F | Bulbar | 24 |
| P217 | p.H63D | LP | — | 40 | M | Bulbar | 30 | |
| P218 | p.H63D | LP | — | 54 | M | Both limb | 60 | |
| P99 | p.H63D | LP | — | 62 | F | Bulbar | 24 | |
| 192 | p.H63D | LP | — | 45 | M | Both limb | 264 | |
| 200 | p.H63D | LP | — | 49 | M | Bulbar | 240 | |
| P203 | p.C282Y | P | SYNE1 (p.R5617X; P), ABCB1 (p.V907F; VUS) | 49 | M | Left upper limb | 60 | |
| P222 | p.C282Y | P | CNTF (p.R72X; VUS) | 58 | F | Left upper limb | 36 | |
| P88 | p.H63D | LP | UBQLN2 (p.Q558L; VUS) | 41 | F | Left lower limb | — | |
| P196 | p.C282Y | P | CYP1A2 (p.E346K; VUS) | 67 | M | Bulbar | 36 | |
- —Indian Council of Medical Research10.13039/501100001411
Peer Reviews
No public reviews on file for this paper yet. If you reviewed it on a platform where reviews are public (OpenReview, ICLR, NeurIPS, ICML), you can paste yours below so the community can read it here.
Videos
No videos yet. Explain this paper in a talk, walkthrough, or lecture? Add one.
Taxonomy
TopicsAmyotrophic Lateral Sclerosis Research · Genetic Neurodegenerative Diseases · Neurogenetic and Muscular Disorders Research
Introduction
Amyotrophic lateral sclerosis (ALS) is a devastating and rapidly progressive neurodegenerative disorder that affects the upper and lower motor neurons in the motor cortex, brainstem and spinal cord. Clinically, ALS manifests as progressive muscular weakness, atrophy followed by paralysis and eventually death due to respiratory arrest. The median survival for ALS patients is typically 2–5 years from the onset of symptoms, though survival outcomes vary widely, ranging from a few months to over a decade.^1-3^ Several clinical features including the site of onset of symptoms, age at onset, diagnostic delay, respiratory dysfunction, cognitive and behavioural deficits and environmental factors may affect the disease progression and survival in ALS patients, underpinning the multifaceted nature of ALS.^4-7^ Moreover, this variability has been suggested to be influenced by inter-individual genetic differences.^6^
Familial ALS (fALS) accounts for ∼5–10% of ALS cases, whereas sporadic ALS (sALS) constitutes ∼90–95% of the cases.^8^ However, in India, the occurrence of fALS is extremely rare, accounting for <1% of cases.^2,9^ Mutations in superoxide dismutase 1 (SOD1), TAR DNA-binding protein (TARDBP), fused in sarcoma (FUS), and hexanucleotide repeat expansion in chromosome 9 open reading frame 72 (C9orf72) represent the most frequent genetic causes of ALS.^10,11^ Variations in these genes are further associated with decreased survival.^12-15^ However, certain SOD1 mutations such as L144S and D91A have been linked to relatively slower disease progression and increased survival.^16-19^ In addition to variations in disease-causative genes, variations in disease-modifying genes have also been suggested to impact the phenotypic expression of ALS, adding to the complexity of genetic influence in ALS.^11^ Furthermore, the presence of multiple rare variants within a single individual has been reported to have synergistic effects on disease presentation, suggesting the oligogenic nature of ALS.^20,21^
Multiple studies have explored the mechanisms driving disease onset and progression, but the relationship between ALS genotypes and phenotypes remains elusive. Here, we screened genetic variations in ALS-causative, susceptibility and disease-modifier genes and assessed their impact on survival outcomes in ALS patients. Furthermore, there is a considerable clinical and genetic overlap between ALS and other neurodegenerative disorders (NDD) or neuromuscular disorders (NMD).^22-28^ To address this genetic pleiotropy, genes associated with NDD and NMD were also examined. By delving deeper into the mutation spectrum, this study aims to better understand their correlation with symptom manifestation and disease progression, ultimately paving the way for more personalized prognoses and treatment strategies for ALS patients.
Materials and methods
Patient enrolment and clinical assessment
A total of 159 ALS patients were recruited at Sir Ganga Ram Hospital, Delhi, between September 2013 and December 2022. Written informed consent was taken from all the patients. The study was approved by the Institutional Ethics Committee of Sir Ganga Ram Hospital (EC/05/20/1714) and was conducted in accordance with the Declaration of Helsinki. The study was conducted according to STrengthening the REporting of Genetic Association Studies (STREGA) guidelines.^29^
Patients were diagnosed based on comprehensive evaluation, including (i) detailed history and neurological examination; (ii) motor nerve conduction of median and ulnar nerves (upper limbs) and peroneal and posterior tibial nerves (lower limbs); (iii) sensory nerve conduction of median, ulnar and sural nerves; (iv) electromyography of distal and proximal muscles of all four limbs, bulbar and paraspinal muscles; and (v) magnetic resonance imaging of the brain and spinal cord to exclude other neurological disorders.
Based on the revised El Escorial criteria, patients diagnosed as ‘Clinically Definite ALS’ and ‘Clinically Probable ALS’ were included. ‘Clinically probable ALS-Laboratory supported’, ‘Clinically possible ALS’ and ‘Clinically Suspected ALS’ patients were excluded.^30^
Clinical and demographic features including a detailed illness history with emphasis on the site of onset, symptoms suggestive of lower motor neuron involvement (atrophy, weakness manifesting as difficulty in daily activities), upper motor neuron involvement (stiffness of limbs, difficulty in walking), bulbar involvement (speech and swallowing difficulties), pseudobulbar (emotional lability), age at onset, sex distribution and family history were recorded for all the patients. The period of survival was determined from the onset of symptoms to (i) last follow-up (15th November 2024) or (ii) tracheostomy or (iii) death. As on the last date of contact, patients who were alive (40), deceased (98) or lost to follow-up (21) were included in the study.
Whole-exome sequencing
Genomic DNA was extracted from peripheral blood and whole-exome sequencing (WES) was carried out in ALS patients using NEBNext® Ultra™ II DNA Library Prep Kit (Cat No. E7645). DNA libraries were indexed, pooled and sequenced on the Illumina Novaseq 6000 Platform, with an average read depth of 48× and ranged from 39× to 78×. Data obtained was de-multiplexed, followed by adaptor trimming and quality filtering using the fastp tool. Low-quality bases (Phred score <15), poly-G and poly-X bases were removed from the 3′ end, and reads ≥50 bp were retained post-trimming. High-quality reads were mapped to the human genome reference (hg19), using Agilent SureCall tool version 4.2.2. Read targeting and variant calling were performed using Agilent Standard user guidelines, generating Variant Call Format (VCF) files. The VCF files were annotated using the ANNOVAR software tool (http://wannovar.wglab.org/).
Selection of genes and variant identification
Based on the Amyotrophic Lateral Sclerosis Online Database (http://alsod.iop.kcl.ac.uk/), genes were classified into causative (n = 17), susceptibility (n = 21) and disease-modifier (n = 126). Rare pathogenic variations in an additional set of 217 genes associated with NDD/NMD were also investigated (Supplementary Table S1).^31^
The prioritization of genetic variations was done by the following criteria: (i) non-synonymous, insertions, deletions, splice-site and nonsense variations with genotype quality score ≥25 and (ii) variants with minor allele frequency (MAF) < 0.01% in Genome Aggregation Database (gnomAD) and Combined Annotation Dependent Depletion (CADD) score >15. Functional consequences and deleteriousness of prioritized variants were assessed by prediction algorithms including, SIFT (https://sift.bii.a-star.edu.sg/), PolyPhen2 (http://genetics.bwh.harvard.edu/pph2/), Mutation taster (https://www.mutationtaster.org/ChrPos.html), FATHMM (https://fathmm.biocompute.org.uk/) and Provean (https://www.jcvi.org/research/provean). Identified variants were classified according to American College of Medical Genetics and Genomics (ACMG) guidelines into pathogenic, likely pathogenic, and variants of uncertain significance (VUS) using Varsome database (https://varsome.com/). The workflow for identification of genetic variants is outlined in Fig. 1.
Workflow for identification of genetic variants.
Statistical analysis
Descriptive statistics for continuous variables (age at onset and survival duration) are presented as mean ± SEM or median (IQR); categorical variables (sex and site of onset) are presented as frequencies and percentages. Chi-square test was used to explore differences between groups for categorical data. As the variables were not normally distributed (tested with Kolmogorov Smirnov), Mann–Whitney U or Kruskal–Wallis tests were used to find if the differences between two or more groups are significant. For multiple testing corrections, Benjamini–Hochberg correction was performed. Survival analysis was done using the log-rank Mantel-Cox test, displayed as Kaplan–Meier curves. Data were analysed using GraphPad Prism Software version 10.4.0.
The relationship of each independent variable, including sex, age at onset, site of onset, and genetic variations with survival was initially assessed using univariate Cox regression analysis to estimate hazard ratios (HRs) and 95% confidence intervals (CIs). A forward stepwise approach was applied for multivariate Cox regression, using a retention criterion of P < 0.1 for the independent variables. A P-value < 0.05 was considered statistically significant. Data were analysed using the SPSS statistical software, version 22.0 (IBM Corporation, Chicago, IL, USA).
Results
Demographic and clinical characteristics of ALS patients
Demographic and clinical features of 159 ALS patients (familial = 2, sporadic = 157), stratified based on sex, are listed in Table 1. The mean age at disease onset was 55.31 ± 10.83 years, with a male-to-female ratio of 2:1. To investigate any correlation between age at disease onset, sex, site of onset and survival, patients were categorized into four groups based on survival duration^32,33^: short (≤24 months), average (25–60 months), long (61–120 months) and very long (>120 months) (Table 2). No significant association was found between age at onset and survival duration (P = 0.634), as confirmed by univariate analysis (HR = 1.009, 95% CI = 0.990–1.030, P = 0.355, Supplementary Table S2A). Kaplan–Meier survival analysis indicated shorter survival among patients with age at onset >65 years compared to those between 46–65 years and 0–45 years of age; however, the difference did not reach statistical significance (P = 0.478, Supplementary Fig. 1A).
In our dataset, 6.3% of ALS patients (n = 10) exhibited exceptionally long survival durations (>10 years). The inclusion of these cases could significantly impact the overall survival analysis and skew the data. Hence, for a more focused and meaningful assessment of the survival patterns in ALS, we have excluded these patients from the survival analysis. Genetic variations in these patients are detailed in Supplementary Table S3.
There was no significant difference in age at onset between males and females (P = 0.379, Table 1). Although males exhibited shorter survival compared to females, this difference did not reach statistical significance (median: 48 versus 60 years, P = 0.05, Supplementary Fig. 1B) and was not corroborated in univariate analysis (HR = 1.498, 95% CI = 0.967–2.321, P = 0.071, Supplementary Table S2A).
Furthermore, we observed that patients with bulbar onset developed the disease at a significantly older age (P = 0.007, Supplementary Fig. 1C) and had a shorter median survival duration (48 months) than spinal-onset patients (60 months, P = 0.03, Supplementary Fig. 1D). This observation was further supported by univariate analysis, which revealed that bulbar onset was significantly associated with an increased hazard of mortality (HR = 1.565, 95% CI = 1.009–2.421, P = 0.045, Supplementary Table S2A).
Multivariate cox-proportional hazard analysis identified males (HR = 1.740, 95% CI = 1.105–2.740, P = 0.017) and the presence of genetic variations (hazard ratio = 1.533, 95% CI = 1.001–2.350, P = 0.05) as significant predictors of higher risk of mortality. Additionally, bulbar onset (hazard ratio = 1.75, 95% CI = 1.11–2.75, P = 0.016) was identified as a negative prognostic factor for survival (Supplementary Table S2B).
Identification of genetic variants
WES identified a total of 102 genetic variations in 57.9% (n = 92) of ALS patients, whereas 42.1% (n = 67) of the patients showed no genetic variations. Most (n = 88) of the variants were non-synonymous, 12 were nonsense, and 2 were deletions. No splice-site variants were identified. Remarkably, 45 of these variants appear to be novel [marked with asterisk (*) in Supplementary Tables S3–S5] and have not been documented previously in the literature. Among the identified variations, 12 variants were detected in 9 causative ALS genes, 14 variants in 8 susceptibility genes, 47 variants in 38 disease-modifier genes and 29 variants in 21 genes associated with NDD/NMD (Supplementary Tables S3–S5). According to ACMG guidelines, 13.5% of all the variations were classified as pathogenic, 19.8% as likely pathogenic, and 66.7% were VUS (Fig. 2A). Genes with pathogenic, likely pathogenic variants, and VUS are depicted in Fig. 2B and C. Pathogenic variants were present in 10% (n = 16) patients, likely pathogenic in 15% (n = 24) patients and VUS in 42% (n = 67) patients. Among these, 26 patients had more than one variation (Supplementary Table S5).
Summary of identified variants on the basis of ACMG guidelines (Varsome) and correlation with clinical parameters. (A) Pie-chart illustrates the classification of genetic variants: pathogenic, likely pathogenic and variant of uncertain significance. (B) and (C) Bar charts display the counts of pathogenic (in red), likely pathogenic (in orange) and variants of uncertain significance (in blue) identified in primary ALS genes, disease-modifier genes and NDD/NMD-associated genes within our subset. The genes are arranged in alphabetical order for each gene subcategory.
Furthermore, among the causative ALS genes, three pathogenic variants were detected in SOD1. Pathogenic as well as VUS were detected in TARDBP and OPTN. Additionally, a likely pathogenic variant in NEK1 and a VUS in TBK1 gene were identified. Among the susceptibility genes, pathogenic variants were detected in DNMT3A, and likely pathogenic variants were identified in CDH22 and ANG. SMN1 and DNMT3A harboured both likely pathogenic variants and VUS. Furthermore, VUS were detected in SQSTM1, FIG4 and ERBB4.
Analysis of disease-modifier genes revealed pathogenic as well as likely pathogenic variants in HFE, pathogenic variants in SPG7, pathogenic variants and VUS in CYP27A1 and SYNE1. Additionally, likely pathogenic variants and VUS were identified in NAIP and SCN7A. The VUS were found in 30 genes including EPHA4, DCTN1, MAPT, SETX, MATR3, ERLIN1 and CAMTA1.
In genes associated with other NDD or NMD, ATM and FKTN variants were pathogenic, CHRNE variant was likely pathogenic, PLA2G6 and EP300 variants were likely pathogenic as well as VUS. All other identified variants in NDD or NMD genes were VUS. The details of all identified variants are provided in Supplementary Tables S3–S5.
Correlation of clinical parameters with the presence or absence of genetic variations
Patients (n = 74) harbouring genetic variations showed a significant delay in the disease onset (P = 0.049, Fig. 3A) compared to patients (n = 54) with no genetic variations. Kaplan–Meier survival analysis revealed a shorter median disease duration in patients with genetic variations (48 months) as compared to those without genetic variations (60 months, P = 0.029, Fig. 3B).
Correlation of clinical parameters with presence or absence of genetic variations. (A) Age at onset in patients negative and positive for genetic variations. (B) Kaplan–Meier survival analysis of patients negative and positive for genetic variations. (C) Age at onset in males and females with genetic variations. (D) Kaplan–Meier survival analysis of males and females with genetic variations. (E) Age at onset in bulbar- and spinal-onset patients with genetic variations. (F) Kaplan–Meier survival analysis of bulbar- and spinal-onset patients with genetic variations.Description of tests used for statistical analysis. (A, B) Variant negative n = 54; variant positive n = 74, P = 0.049 in Mann–Whitney U-test, P = 0.029 in log-rank test. (C, D) Male/variant negative n = 37, male/variant positive n = 49; female/variant negative n = 17; female/variant positive n = 25, P = 0.387 and P = 0103 in ANOVA; male/variant negative versus male/variant positive P = 0.387; female/variant negative versus female/variant positive P = 0.031, P = 0.176 and P = 0.049 in log-rank test for male/variant negative versus male/variant positive and for female/variant negative versus female/variant positive, respectively. (E, F) Bulbar/variant negative n = 13; bulbar/variant positive n = 27; spinal/variant negative n = 41; spinal/variant positive n = 47, P = 0.036 in ANOVA; bulbar/variant negative versus bulbar/variant positive P = 0.041; spinal/variant negative versus spinal/variant positive P = 0.539, P = 0.46 and P = 0.046 in log-rank test for bulbar/variant negative versus bulbar/variant positive and for spinal/variant negative versus spinal/variant positive, respectively. A P-value of ≤0.05 was considered as statistically significant. One-way ANOVA analysis followed by Benjamini–Hochberg corrections was performed for multiple group comparisons. Kaplan–Meier curves and log-rank tests were applied to determine the effect of demographic or variation status on survival. Individual data points represent the number of patients (n) for each group.
When data were stratified based on sex, females with genetic variations had a significantly later disease onset (P = 0.031, Fig. 3C) and a shorter median survival duration (60 months) compared to females without genetic variations (96 months, P = 0.049, Fig. 3D). In contrast, no significant differences in disease onset (P = 0.387, Fig. 3C) or survival duration (P = 0.176, Fig. 3D) were observed among males, who showed median survival of 48 months irrespective of the presence of genetic variations.
In patients with bulbar onset and positive for genetic variations, disease onset occurred at a later age (P = 0.041, Fig. 3E) and shorter median survival duration (30 months) compared to those without genetic variations (48 months, P = 0.46, Fig. 3F). However, in spinal-onset patients, the presence of genetic variations was significantly associated with a shorter median survival (48 months versus 60 months; P = 0.046; Fig. 3F). Overall, the presence of genetic variations demonstrated a tendency to negatively impact survival outcomes.
Furthermore, stratification of patients based on gene subcategories, namely, causative, susceptibility, disease-modifier or NDD/NMD genes, revealed no significant differences in mean age at onset (P = 0.323, Fig. 4A). The corresponding median survival durations were 42, 60, 48 and 48 months, respectively, which also did not show statistical significance (P = 0.256; Fig. 4B). Similarly, when analysed by variant pathogenicity, no significant differences were observed in either mean age at onset (P = 0.19; Fig. 4C) or survival duration. Median survival was 42 months for patients with pathogenic variants, 60 months for likely pathogenic variants, 48 months for variants of uncertain significance (VUS) and 60 months for those without any variant, with no statistically significant difference (P = 0.169; Fig. 4D).
Clinical correlation of patients stratified by variants identified in different genes with (A) age at onset, (B) Kaplan–Meier survival analysis, (C) correlation of pathogenicity of variants with age at onset and (D) Kaplan–Meier survival analysis. Description of tests used for statistical analysis. (A, B) Causative ALS genes n = 10, susceptibility genes n = 9, disease-modifier genes n = 26, NDD/NMD genes n = 10, P = 0.8473 in ANOVA and P = 0.3854 in the log-rank test. (C, D) Pathogenic n = 27, likely pathogenic n = 85, VUS n = 26, no variant n = 54, P = 0.316 in ANOVA and P = 0.693 in log-rank test. NDD, neurodegenerative disorder, NMD, neuromuscular disorder, VUS, variants of uncertain significance. A P-value of ≤0.05 was considered as statistically significant. Individual data points represent the number of patients (n) for each group.
Multiple genetic variants influence the age at onset and survival duration
Interestingly, 16.7% of patients (n = 25) harboured more than one genetic variation. The mean age at onset was significantly delayed (63.4 years) compared to those with single variation (n = 52, 54.5 years, P = 0.0004) or no variation (n = 54, 53.4 years, P = 0.0001) (Fig. 5A). It is noteworthy that 60% of the patients with multiple variants had onset in the seventh or eighth decade (Supplementary Table S5). On the contrary, ∼70% of patients with a single variant (Supplementary Table S4) or no variant (data not shown) developed symptoms before the seventh decade. Other demographic and clinical features of the patients categorized by the absence and presence of either a single or multiple (≥2) genetic variations are detailed in Supplementary Table S6.
Clinical correlation of multiple genetic variations (A) correlation of age at onset (B) Kaplan–Meier survival in patients stratified by the absence of genetic variants and presence of either a single variant or multiple (≥2) genetic variants. Description of tests used for statistical analysis. (A, B) No variant n = 54; variant = 1 n = 74; variant ≥ 2 n = 22, P = 0.0003 in ANOVA; no variant versus variant ≥ 2, P = 0.0001; variant = 1 versus variant ≥ 2, P = 0.0004. One-way ANOVA analysis followed by Benjamini–Hochberg corrections was performed for multiple group comparisons. P = 0.09 in log-rank test. Individual data points represent the number of patients (n) for each group.
Among the patients with multiple genetic variations, 15 patients carried a combination of pathogenic or likely pathogenic variants along with VUS, while 10 patients had more than one VUS. Based on gene subcategorization, eight patients with variations in causative ALS genes and two patients with susceptibility genes (n = 2) also carried variants in disease modifiers and NDD/NMD genes. Eight patients exhibited two distinct variants in disease-modifier genes, and five patients carried variations in both disease-modifier and NDD/NMD genes. Two patients had multiple variations specifically in NDD/NMD genes (Supplementary Table S5).
When patients were compared for survival duration, the median survival was higher (60 months) for patients with no genetic variation than patients with single (42 months) or multiple (39 months) variations. However, this difference did not reach statistical significance (P = 0.09, Fig. 5B).
Genotype–phenotype correlation in patients with ALS
The genotype–phenotype correlation may have an implication in predicting the disease course and understanding the disease mechanisms. A marked clinical heterogeneity in age at onset, site of onset and disease duration, even among individuals carrying the same variant, was observed (Table 3 and Supplementary Tables S3–S5).
Among SOD1 carriers, the p.A4T variant was observed in two siblings with aggressive phenotype and very short survival durations. The patient with p.H43R SOD1 variant had longer survival duration of 60 months. Two sALS patients with p.L84F SOD1 variant carried additional variants and exhibited variable clinical features.
Two patients with variations in the TARDBP gene had onset in the fifth decade. Notably, one of these variations (p.I383V) is novel, classified as VUS with a CADD score >15, suggestive of its potential pathogenicity. This patient survived for 10 months after onset. The other patient with known pathogenic p.M405L variant and a VUS in EP300 showed a longer survival duration of 72 months.
In the OPTN gene, well-characterized pathogenic variations, p.E399X and p.K489E, were identified in three patients with short survival durations ranging from 24 to 48 months. Additional pathogenic variant and VUS were also present in ATM and CYP2D6 genes in two of these patients.
The presence of additional VUS in patients carrying variations in susceptibility genes was associated with shorter survival durations. A patient with deleterious SQSTM1 variant (p.R393W) had prolonged survival of 108 months, whereas another patient with an additional variant in VPS13C survived only for 48 months. Similarly, a patient with a single FIG4 variant showed a survival of 60 months, while a patient with an additional variant in ELP3 had a markedly shorter survival of just 7 months.
Among the disease-modifier genes, two missense variations (p.H63D, n = 7 and p.C282Y, n = 3) were identified in the HFE gene. Six patients with p.H63D were alive at the time of analysis, and one was lost to follow-up. Two of these patients had prolonged survival of >10 years. Two patients with p.C282Y were alive while one had a shorter survival of 24 months. Four patients with these two HFE variants also carried deleterious variations in other disease-modifier genes (Table 3, Supplementary Table S5).
Furthermore, patients carrying variations solely in NDD genes including LRRK2, ABCA7, ABCB1, SORL1 and IQCK had survival ≤5 years. Similar survival pattern was observed for patients with variations only in NMD genes, CACNA1S, RAPSN, CHRND and LAMA2 (Supplementary Table S4).
Discussion
This study presents a comprehensive exploration of clinical features and genetic variations and their impact on survival outcomes in ALS patients from North India. Globally, the mean age of ALS onset ranges from 51 to 66 years,^34-36^ whereas younger age at onset (46.2 ± 14.1 years) has been reported from South India.^2^ In our patient subset from North India, the mean age at disease onset was 55.31 ± 10.83 years. We observed sex-based differences in ALS presentation and prognosis, with males exhibiting poorer survival, consistent with prior reports from Italy, Brazil and China.^4,37-39^ However, contrasting studies from Spain, New Jersey and Australia have reported worse survival among females.^32,40,41^ Bulbar onset is a well-established negative prognostic factor in ALS, associated with shorter survival durations compared to spinal onset.^4,5,42-44^ Consistent with previous studies, our findings also identified bulbar onset as an independent predictor of reduced survival.
We identified both known and novel genetic variations in ALS-causative, susceptibility, disease-modifier and NDD/NMD genes in 58% of the patients. Among causative genes, SOD1 (3.1%) and OPTN (1.9%) variants were frequently observed, while FIG4 (1.9%) was the primary variant among susceptibility genes. Variants in HFE (6.3%) and NAIP (5.7%) were the most frequent among disease-modifier genes.
There are more than 150 variations in SOD1 associated with ALS. We have previously reported p.L84F-SOD1 mutation in a family with a history of ALS. Despite the same variation, significant variability in disease onset, progression and survival was observed among the affected family members.^9^ In the current study, two sALS patients with p.L84F variation also showed distinct clinical features and survival outcomes. The p.A4T variation identified in two fALS patients is relatively rare and associated with rapidly progressive form of fALS.^45,46^ The patient with p.H43R variant had extended survival of 60 months which contrasts with previous reports where p.H43R is associated with shorter disease duration compared to other SOD1 mutations.^47-49^
In TARDBP gene, ∼50 missense variations have been identified which account for about 3% of fALS and <1% of sALS cases. Majority of these variations are located within the C-terminal glycine-rich domain of TDP-43, which leads to cytoplasmic mislocalization and increased tendency to form cytoplasmic inclusions.^50^ Similar to previous studies,^14,51^ we identified two variants in the C-terminal region of TARDBP, both associated with spinal-onset and marked variability in disease duration.
Optineurin (OPTN) binds to ubiquitinated cargo and facilitates its recruitment to the autophagosome via interaction with LC3 (microtubule-associated protein 1A/1B-light chain 3). This process is tightly regulated by TBK1, a serine/threonine kinase, which phosphorylates the ubiquitin-binding (UBA) domain of OPTN and SQSTM1. Disruption of this regulatory axis via mutations in either TBK1/OPTN or TBK1/SQSTM1 can impair autophagy. We have identified p.G272D variation in the kinase domain of Tbk1, and the ALS-associated variations in this domain have previously been shown to impair its catalytic activity.^52,53^
In the OPTN gene, we identified two variations, p.E399X and p.K489E, that have been previously reported in the Indian cohort.^54,55^ Moore et al. (2016)^56^ demonstrated that p.Q398X led to deletion of the UBA domain, preventing the recruitment of mutant protein to ubiquitinated mitochondria and attenuating mitophagy. Previously, Kamada et al. (2014)^57^ reported this variation in two ALS patients: one patient with bulbar onset survived for 9 years while another with upper-limb onset survived for 4 years. Furthermore, expression of this mutant in NSC-34 cells inhibited the association of Optn with myosin VI and lead to accumulation of autophagosomes, fragmentation of neuronal Golgi apparatus and activation of ER stress.^58^ The p.K489E variant has been shown to cause increased cell death and deregulate autophagy in an in vitro cell model of ALS.^59^
Similarly, mutations in the C-terminal UBA domain of SQSTM1^60^ impair its function by reducing phosphorylation and compromising ubiquitinated cargo binding and clearance. In our study, the p.R393W variant identified within this domain may disrupt SQSTM1 function and contribute to ALS pathogenesis.
FIG4 plays a critical role in retrograde trafficking of endosomal vesicles, and variations in FIG4 have been associated with longer disease duration in ALS.^61-63^ In our study, one patient with only FIG4 variant had survival duration of 60 months. However, patients with additional variations had survival duration of <5 years. Importantly, a patient with variations in FIG4 and ELP3 genes had particularly short survival of 7 months. Overexpression of ELP3 has been suggested to be neuroprotective and reduce toxicity associated with mutant SOD1 and C9orf72 repeat expansion.^64^ Mutation in ELP3 has been shown to cause decreased survival in ALS and FTD patients with C9orf72 repeat expansion.^65^ The co-occurrence of FIG4 with SETX (p.L158V) or C9orf72 repeat expansions has also been linked with poor prognosis.^66^ The co-presence of FIG4 and ELP3 variants in our patient might have resulted in shorter survival duration..
Multiple studies have reported significant correlation between p.H63D variant of HFE and ALS risk.^67-70^ The p.H63D variant has been shown to cause reduced SOD1 levels and increase disease duration in sALS patients.^71^ More recently, Canosa et al. (2023)^72^ demonstrated that patients harbouring SOD1 mutations along with p.H63D HFE variant exhibited significantly longer survival durations. Notably, in our cohort, we observed two patients with exceptionally prolonged survival, which further supports the potential protective influence of the p.H63D variant in the context of ALS. Since most of the patients with HFE variants were alive at the time of analysis, follow-up of disease progression in these patients may aid in defining the role of HFE in ALS outcomes.
A growing body of evidence suggests that oligogenicity impacts the clinical outcomes in ALS. The co-occurrence of variations in ALS causative and susceptibility genes has been shown to be associated with earlier age at onset^20,21^ and lower survival probability.^73^ In a very recent study, Iacoangeli et al. (2025)^74^ have shown that oligogenic carriers had significantly higher disease risk compared to monogenic carriers. However, they did not observe significant relationship was found between oligogenicity and clinical outcomes like age at onset and survival. In our patient cohort, we identified 15.7% of patients with >1 genetic variations. Furthermore, these patients exhibited a significantly delayed age at onset but a shorter survival duration. The presence of additional variants, whether pathogenic, likely pathogenic, or VUS, highlights the potential role of disease-modifier genes in influencing disease pathogenesis. Interaction among these variants may significantly impact disease progression, severity and survival outcomes, contributing to the observed phenotypic heterogeneity.
In conclusion, this study provides valuable insights into the genetic complexity of ALS in the North Indian population, emphasizing the role of both well-established and novel genetic variations in defining clinical outcomes. The study further warrants the investigation into the role of gene–gene interactions and their functional implications in ALS pathogenesis.
Limitations
Despite its strengths, this study has certain limitations. Firstly, the sample size was relatively small. Secondly, ALS Functional Rating Scale-Revised (ALSFRS-R) scores were not assessed for all patients, which limits the ability to correlate genetic findings with disease severity and prognosis. Additionally, many patients in this part of the country due to socio-economic conditions and remote locations do not come for follow-up, patients diagnosed as ‘Lab Probable ALS’ were excluded.
While WES is a powerful tool to detect SNVs and indels, it does not capture deep intronic variants, CNVs or repeat expansions associated with the disease. Although the repeat expansions of C9ORF72 and ATXN2 were not analysed in the present study, we have previously reported the absence of C9ORF72 expansion in sALS patients from North India (Vats et al., 2016). Moreover, while in silico prediction tools aid in variant classification, functional studies are necessary to definitively confirm the pathogenicity of variants, especially for those categorized as VUS or implicated in oligogenic interactions. Addressing these limitations in future studies will enhance our understanding of ALS genetics and its clinical relevance.
Supplementary Material
fcag003_Supplementary_Data
The reference list from the paper itself. Each links out to its DOI / PubMed record.
- 1Pupillo E, Messina P, Logroscino G, Beghi E; Group SLALOM. Long-term survival in amyotrophic lateral sclerosis: A population-based study. Ann Neurol. 2014;75(2):287–297.24382602 10.1002/ana.24096 · doi ↗ · pubmed ↗
- 2Nalini A, Thennarasu K, Gourie-Devi M, Shenoy S, Kulshreshtha D. Clinical characteristics and survival pattern of 1,153 patients with amyotrophic lateral sclerosis: Experience over 30 years from India. J Neurol Sci. 2008;272(1-2):60–70.18550082 10.1016/j.jns.2008.04.034 · doi ↗ · pubmed ↗
- 3Testa D, Lovati R, Ferrarini M, Salmoiraghi F, Filippini G. Survival of 793 patients with amyotrophic lateral sclerosis diagnosed over a 28-year period. Amyotroph Lateral Scler Mot Neuron Disord. 2004;5(4):208–212.15799548 · pubmed ↗
- 4Grassano M, Moglia C, Palumbo F, et al Sex differences in amyotrophic lateral sclerosis survival and progression: A multidimensional analysis. Ann Neurol. 2024;96(1):159–169.38568048 10.1002/ana.26933 · doi ↗ · pubmed ↗
- 5Su WM, Cheng YF, Jiang Z, et al Predictors of survival in patients with amyotrophic lateral sclerosis: A large meta-analysis. e Bio Medicine. 2021;74:103732.34864363 10.1016/j.ebiom.2021.103732 PMC 8646173 · doi ↗ · pubmed ↗
- 6Baumann F, Henderson RD, Morrison SC, et al Use of respiratory function tests to predict survival in amyotrophic lateral sclerosis. Amyotroph Lateral Scler. 2010;11(1-2):194–202.19452343 10.3109/17482960902991773 · doi ↗ · pubmed ↗
- 7Pinto S, De Carvalho M. Comparison of slow and forced vital capacities on ability to predict survival in ALS. Amyotroph Lateral Scler Front Degener. 2017;18(7-8):528–533.10.1080/21678421.2017.135499528741375 · doi ↗ · pubmed ↗
- 8Renton AE, Chiò A, Traynor BJ. State of play in amyotrophic lateral sclerosis genetics. Nat Neurosci. 2014;17(1):17–23.24369373 10.1038/nn.3584 PMC 4544832 · doi ↗ · pubmed ↗