Molecular determinants of lung function decline: a multi-level analysis of gene expression
Zaid W. Elhusseini, Omar Rafique, Min Hyung Ryu, Peter Castaldi, Don D. Sin, Ingo Ruczinski, Craig P. Hersh

TL;DR
This study identifies gene expression patterns linked to lung function decline in COPD, revealing molecular markers that could lead to new therapies.
Contribution
A novel 20-gene signature associated with FEV1 decline was identified and validated across multiple studies.
Findings
Three distinct gene sets were identified across cross-sectional, FEV1 change, and longitudinal analyses.
A 20-gene signature was strongly associated with FEV1 decline and validated in an independent study.
Pathway analysis highlighted oxidative stress and immune processes as key in FEV1 decline.
Abstract
Chronic obstructive pulmonary disease (COPD) is characterized by progressive lung function decline, commonly measured by forced expiratory volume in one second (FEV1). Uncovering the genetic basis of FEV1 decline is essential for understanding COPD pathophysiology and for developing therapies. We hypothesized that gene expression patterns in inflammatory pathways are associated with FEV1 decline. We analyzed whole blood RNA-sequencing data from the 5 (n = 4,147) and 10 year visits (n = 435) in the COPDGene Study. Gene expression was assessed in three analyses: cross-sectional associations with FEV1 at two separate time points, association between year 5 gene expression and FEV1 changes from year 5–10, and longitudinal changes in both gene expression and FEV1. A gene signature derived from the 5-year visit was linked to FEV1 decline across three intervals (baseline to 5 years, 5 to 10…
Genes, proteins, chemicals, diseases, species, mutations and cell lines named across the full text — each resolved to its canonical identifier and authoritative record.
Click any figure to enlarge with its caption.
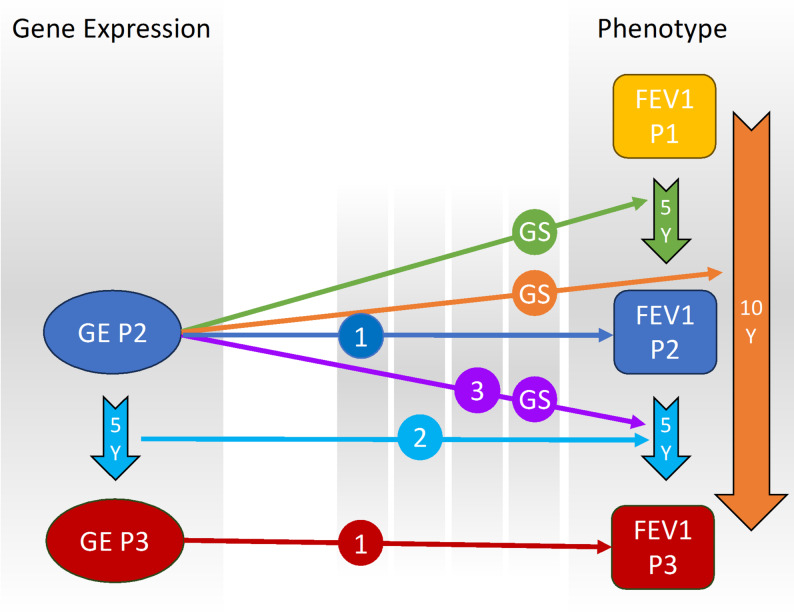 Figure 1
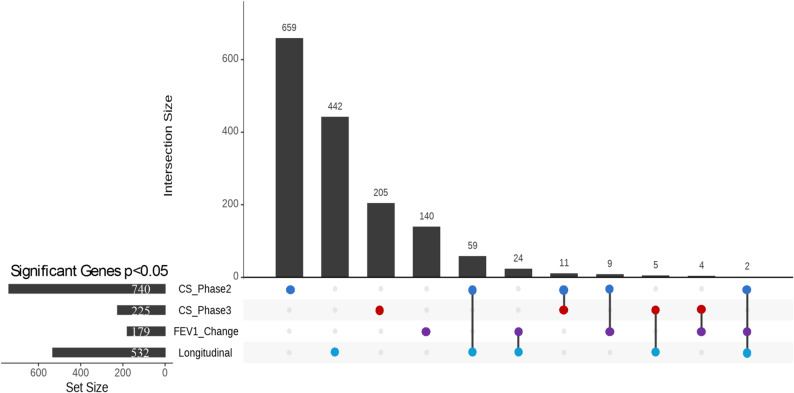 Figure 2
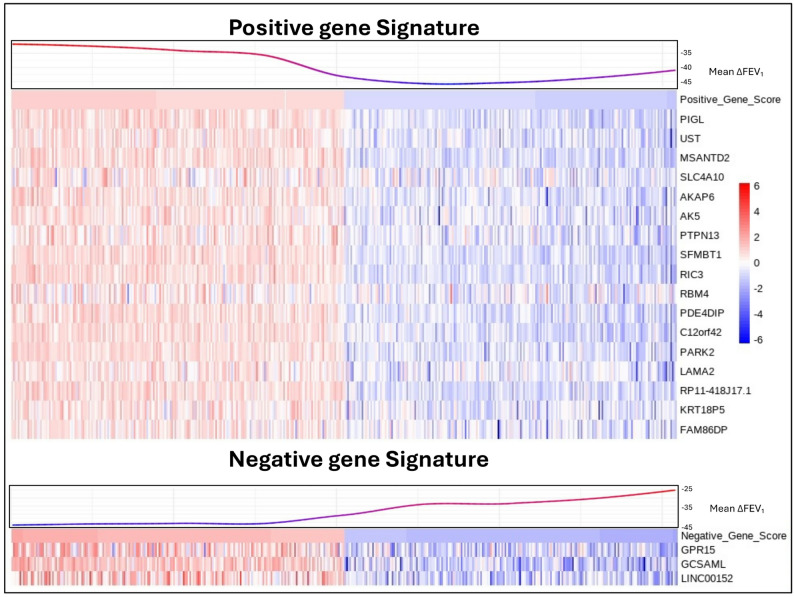 Figure 3
- —https://doi.org/10.13039/100000050National Heart, Lung, and Blood Institute
Peer Reviews
No public reviews on file for this paper yet. If you reviewed it on a platform where reviews are public (OpenReview, ICLR, NeurIPS, ICML), you can paste yours below so the community can read it here.
Videos
No videos yet. Explain this paper in a talk, walkthrough, or lecture? Add one.
Taxonomy
TopicsChronic Obstructive Pulmonary Disease (COPD) Research · Asthma and respiratory diseases · Pulmonary Hypertension Research and Treatments
Background
Chronic Obstructive Pulmonary Disease (COPD) is a heterogeneous disease characterized by persistent respiratory symptoms and airflow limitation. Major causes include environmental factors such as exposure to cigarette smoke and pollutants, together with molecular factors such as alpha-1 antitrypsin deficiency [1]. The forced expiratory volume in 1 s (FEV_1_) on spirometry is a widely recognized and critical marker used for diagnosing and monitoring the severity of COPD [2]. Studies show that FEV_1_ decline correlates with exacerbations and mortality risk [3]. Longitudinal analyses have shown that an accelerated decline in FEV_1_ is a key factor in COPD development, with research indicating that up to 50% of cases arise from this progressive decline [4]. Thus, understanding factors that contribute to FEV_1_ decline is vital for the effective management of COPD [5].
While lifestyle and environmental exposures, such as continued smoking and repeated exacerbations, are significant contributors, the mechanisms driving COPD progression are still poorly understood. Growing evidence suggests that molecular factors play a crucial role in disease progression, particularly through their effect on lung function decline [6]. Utilizing large longitudinal studies like the Genetic Epidemiology of COPD Study (COPDGene) with clinical and RNA-sequencing data, provides an opportunity to explore these mechanisms more deeply.
We hypothesized that gene expression patterns are associated with subsequent FEV_1_ decline and may serve as early biomarkers of COPD progression. To test this, we used models assessing the association between gene expression and future FEV_1_ decline, as well as within-subject changes over time. Combining insights from these approaches provides a more comprehensive understanding of COPD progression, enabling the identification of molecular underpinnings and potential therapeutic targets [6].
Methods
COPDGene study
COPDGene is a longitudinal prospective study that recruited 10,192 smokers with at least a 10-pack-year smoking history, aged between 45 and 80 years, including subjects with and without COPD at enrollment [7]. Clinical assessments and questionnaires were collected at enrollment, with follow-up visits occurring 5 (Phase 2) and 10 years (Phase 3) after enrollment. Blood samples were collected during the second and third visits for RNA sequencing. Additional details are provided in the online supplement.
Gene expression
COPDGene RNA-sequencing methods were reported previously [8, 9]. RNA-seq data from whole blood samples of 4,147 participants in Phase 2 and 511 participants in Phase 3 were retained for analysis after quality control. Phase 3 subjects were randomly selected for RNA-seq; this analysis represents the first data freeze.
Data processing and linear regression analysis
We performed linear regression analyses to evaluate the relationship between gene expression and lung function decline, focusing primarily on FEV_1_ change and longitudinal models (Fig. 1, Supplemental Table 1). The FEV_1_ change analysis used gene expression data from Phase 2 along with the change in FEV_1_ for three intervals: Phase1-Phase2, Phase2-Phase3, and Phase1-Phase3. For the longitudinal analysis, we assessed the changes of both Phase 2 and Phase 3 FEV_1_ and gene expression data.
Fig. 1. Multi-phase analysis of FEV_1_ in COPDGene. (1) Cross-sectional analysis: Association between gene expression (GE) in Phase 2 and Phase 3 with FEV_1_ in Phase 2 and Phase 3, respectively. (2) Longitudinal gene expression change analysis: Association between the change in gene expression from Phase 2 to Phase 3 and the change in FEV_1_ from Phase 2 to Phase 3. (3) FEV_1_ change analysis: Association between gene expression in Phase 2 and the change in FEV_1_ from Phase 2 to Phase 3. (GS) Gene signature generation: Combining the three analyses to create a gene signature associated with FEV_1_ change by examining gene expression in Phase 2 and FEV_1_ change across all three intervals. FEV_1_, forced expiratory volume in one second; P, Phase; Y, Years
For the longitudinal analysis, we combined gene expression data from both phases, ensuring that only samples present in both phases were included. Batch effects were adjusted using ComBat-seq [10]. Samples belonging to unique batches were excluded since the batch correction method does not accept single-batch samples. We retained genes where at least 80% of samples had counts per million (CPM) > 1. We then normalized the data using the TMM method and applied the voom transformation. In the longitudinal analysis, we calculated the difference in gene expression between the two-time points. Finally, we performed a linear model in Limma [11] which enables precise variance estimation and covariate adjustment in large sample sizes, adjusting for age, race, sex, smoking status (current or former), and white blood cell count and differential percentages.
Pathway enrichment analysis
We performed pathway enrichment analysis using the 532 genes identified with p < 0.05 in the longitudinal analysis. These genes were submitted to g: Profiler (https://biit.cs.ut.ee/gprofiler). The data sources used for this analysis included Gene Ontology (Biological Process), KEGG, Reactome, and WikiPathways. To identify significant pathways, we applied the g: SCS threshold, which adjusts for multiple testing to control the family-wise error rate. The resulting pathways were ranked based on their adjusted p-values.
FEV1 change gene signature
To reduce multiple testing burden for association with other COPD phenotypes, generated a gene signature associated with FEV_1_ change by performing linear regression analysis. We included all subjects with FEV_1_ readings across three intervals (Phase 1 to Phase 2, Phase 2 to Phase 3, and Phase 1 to Phase 3) and identified genes with a nominal p-value < 0.05 for each interval. The gene signature was determined by identifying the overlapping genes across all three intervals. Genes were separated based on the direction of their effect into a positive and negative gene signature. We then performed Gene Set Variation Analysis (GSVA) [12] to assign each subject a score based on these gene sets. We then assessed the association between the gene signature and COPD-related traits, using linear or logistic regression analysis, adjusting for age, race, sex, and smoking status, as well as white blood cell counts and differential percentages.
Validation in ECLIPSE study
The ECLIPSE Study was a longitudinal prospective study involving 2,747 participants with at least a 10-pack-year smoking history [13], aged between 40 and 75 years. Study visits occurred at enrollment, three months, and every six months until 3 years. Data collected included spirometry, questionnaires, and other clinical assessments. Gene expression microarray (Affymetrix Human Gene 1.1 ST array) data are available for 627 peripheral blood samples from both COPD and control subjects [13].
Results
We selected 435 subjects who had both RNA-sequencing and phenotype data in Phase 2 and Phase 3 (Table 1). While the primary focus was on longitudinal and FEV_1_ change analyses, we also conducted cross-sectional analyses at Phases 2 and 3 for context; full results are reported in the Supplementary Materials (Supplemental Tables 2–3). For the FEV_1_ change analysis, where we tested the association between gene expression in Phase 2 and the change in FEV_1_ from Phase 2 to Phase 3, we identified 179 genes at p < 0.05 (Supplemental Table 4). Finally, in the longitudinal analysis, where we assessed the association between the change in gene expression and the change in FEV_1_, we found 532 genes at p < 0.05 (Supplemental Table 5). Although several genes reached nominal significance (p < 0.05) in the FEV_1_ change and longitudinal analyses, none passed FDR correction, likely due to smaller sample sizes and the complexity of modeling intra-individual lung function change. To explore the overlap between these analyses, we examined the intersections of genes identified in FEV_1_ change, longitudinal, and supplementary cross-sectional analyses. Interestingly, only two genes (NOV and AC009404.2) were shared across all three analyses, suggesting a limited but potentially critical set of common molecular determinants (Fig. 2). Additionally, each analysis revealed unique sets of genes previously related to COPD (Supplemental Table 6), cross-sectional (TNF,* TLR4*,* IL6R*), FEV_1_ change (CHI3L1,* VEGFA*,* FOXO3*), and longitudinal (MMP9,* IL1RL1*,* ALOX5AP*), highlighting context-specific markers of lung function decline. These results demonstrate the importance of combining cross-sectional and longitudinal approaches to capture dynamic changes in gene expression associated with lung function decline.
Table 1. Characteristics of the study populationN = 435UnitsPhase 2Phase 3MeanSDRangeMeanSDRangeAgeYears64.528.1748.1–84.669.198.2853-89.4FEV_1_ post-bronchodilatorLiters2.310.760.4–4.442.120.750.32–4.36FEV_1_% predicted%84.2622.5914.7-137.682.3424.2412.7–144.2Neutrophils%58.269.5625–9160.029.6419.3–93.9Lymphocytes%30.59.037.0–5928.259.272.6–78.9Eosinophils%2.571.980–252.51.650-8.8Monocytes%8.042.531–22.08.432.390–22WBCK/uL6.841.982.8–18.96.831.972.3–22.6ΔFEV_1_(Phase2-3)ml/year-40.9856.46-406–179Pack Years of smoking4423.6910–14544.9423.9510–145Phase2Phase3* N* = 435UnitsN = 435Units Sex (Male)%49Sex (Male)%49 Former Smokers%67Former Smokers%70 Race (non-Hispanic White)%74Race (White)%74 Race (African American)%26Race (African American)%26Smoking status in phase 2–3FFFCCFCC2781225120FEV1 Post-BD, FEV1 Post bronchodilator, FF Former smoker in Phase2 and Phase3, CC Current smoker un Phase2 and Phase3, CF Current smoker in Phase2 and Former smoker in Phase3, FC Former smoker in Phase2 and Current smoker in Phase3
Fig. 2. Upset plot of Overlapping Genes Across Cross-Sectional and Longitudinal Analyses. See Fig. 1 for descriptions of analyses. CS, Cross-Sectional; FEV_1_, forced expiratory volume in one second
We then conducted a pathway enrichment analysis on the 532 genes identified at p < 0.05 in the longitudinal gene-expression analysis (Supplemental Table 7). This analysis identified significantly associated pathways related to hemoglobin production and erythrocyte function, including heme biosynthesis, hemoglobin metabolic process, and erythrocyte differentiation. Additionally, pathways such as myeloid cell differentiation and immune system processes were enriched.
We conducted linear regression analyses to assess the relationship between gene expression in Phase 2 and FEV_1_ change across three intervals. In the Phase 1 to Phase 2 interval, 3,805 subjects with both phenotype and RNA-seq data were analyzed, resulting in 1,545 genes with p < 0.05 and 26 genes meeting FDR < 0.05 (Supplemental Table 8). For the Phase 2 to Phase 3 interval, 2,045 subjects were included, resulting in 608 genes with p < 0.05, though none passed FDR < 0.05 (Supplemental Table 9). Lastly, in the Phase 1 to Phase 3 interval, 2,037 subjects were analyzed, resulting in 521 genes with p < 0.05, with 1 gene (GPR15) passing FDR < 0.05 (Supplemental Table 10). To generate a gene signature associated with FEV_1_ change, we identified all overlapping genes with a nominal p-value < 0.05 across the three intervals, taking into account their fold change direction. This approach resulted in 17 genes positively associated with FEV_1_ (Positive Gene Signature) and 3 genes negatively associated with FEV_1_ (Negative Gene Signature). We then assigned each patient a score based on the expression of these two gene signatures using GSVA (Fig. 3).
Fig. 3. Heatmap of FEV_1_ change Gene Signatures. Subjects are sorted based on their GSVA scores for the gene signatures, with the top 10% of subjects from each end of the GSVA score distribution selected for the figure. Non-linear LOESS regression was applied to the mean FEV_1_ change values across three intervals—Phase1-Phase2, Phase2-Phase3, and Phase1-Phase3—for each subject. The heatmap represents the normalized gene expression data for each subject, with values scaled by row to highlight relative gene expression differences across the cohort. ΔFEV_1_, forced expiratory volume in one second change
Instead of testing individual genes, we tested the association of the two composite gene signatures with phenotypes related to lung function, finding significant associations with FEV_1_ in Phase 2 (the same year as gene expression collection) and Phase 3 (five years later), rapid FEV_1_ decline (defined as more than 40 ml/yr) [14], and COPD case-control status (Table 2). The positive and negative gene signatures were associated with other COPD-related traits, including exacerbation frequency in the previous year, severe exacerbations requiring hospitalization or emergency department visits, and chest CT measurements of percent emphysema (LAA 950) and airway wall thickness (Pi10) [15]. Both signatures showed a direction of association aligning with the known association between FEV_1_ and the respective trait. To evaluate the clinical utility of the gene signatures, we performed receiver operating characteristic (ROC) analysis to predict rapid FEV_1_ decline. While both GS_Pos and GS_Neg marginally increased the area under the ROC curve compared to covariates alone, the improvement was not statistically significant (Supplementary Figure S1).
Table 2FEV_1_ decline gene signature association with COPD-related traits in COPDGeneTraitsPositive Gene SignatureNegative Gene SignatureRegressionBeta95% CIP.valueBeta95% CIP.valueFEV1 at Phase 2 (ml)310.82[241.86, 379.78]1.47E-18-170.17[-216.15, -124.19]4.79E-13LinearFEV1 at Phase 3 (ml)310.35[219.98, 400.72]2.13E-11-161.43[-222.01, -100.85]1.91E-07LinearFEV1 Rapid Decline Phase1_Phase2 (< 40 ml/yr)-0.27[-0.48, -0.06]1.17E-020.23[0.09, 0.37]1.20E-03BinaryFEV1 Rapid Decline Phase2- Phase 3 (< 40 ml/yr)-0.38[-0.66, -0.09]8.92E-030.29[0.10, 0.48]2.64E-03BinaryFEV1 Rapid Decline Phase1- Phase3 (< 40 ml/yr)-0.69[-0.98, -0.40]3.02E-060.36[0.17, 0.55]2.68E-04Binary COPD case-control (Gold Stage 0 VS 2–4) -1.06[-1.32, -0.81]3.41E-160.75[0.58, 0.92]1.03E-17Binary COPD related Traits
Airway Wall Thickness (Pi10) -0.15[-0.21, -0.09]1.50E-060.13[0.09, 0.17]1.16E-10Linear Severe Exacerbations -1.18[-1.56, -0.81]9.94E-100.33[0.09, 0.58]8.17E-03Binary Exacerbation Frequency -0.26[-0.34, -0.18]2.76E-100.08[0.03, 0.13]4.01E-03Linear % emphysema (-950HU) -2.78[-3.68, -1.87]1.84E-091.81[1.21, 2.41]4.01E-09Linear Change P1 to P2: Emphysema -0.77[-1.18, -0.36]2.12E-040.47[0.20, 0.75]6.34E-04LinearGOLD Global initiative for chronic Obstructive lung Disease, FEV1, Forced expiratory volume in 1 s; Pi10, The square root of the wall area of a hypothetical airway with a 10-mm internal perimeter
Finally, we aimed to validate our findings in the ECLIPSE study by testing the association between the two gene signatures and FEV_1_ measurements at baseline and follow-up visits, FEV_1_ decline, exacerbation frequency, percent emphysema, and Pi10. Both signatures showed significant associations with FEV_1_ at baseline and follow-up, as well as with the percent emphysema and exacerbation frequency (Table 3). However, we were unable to find a significant association between the gene signatures and the change in FEV_1_ (ml/yr).
Table 3. Validation of FEV_1_ decline gene signature association with COPD-related traits in the ECLIPSE studyTraitsPositive Gene SignatureNegative Gene SignatureRegressionBeta95% CIP.valueBeta95% CIP.valueFEV1 at baseline360.24[187.29, 533.20]4.89E-05-352.34[-476.43, -228.24]3.71E-08LinearFEV1 at 1 year333.50[161.11, 505.89]1.60E-04-300.79[-426.23, -175.36]3.09E-06LinearFEV1 at 2 years329.83[156.85, 502.80]1.98E-04-312.89[-438.13, -187.64]1.20E-06LinearFEV1 at 3 years294.18[112.63, 475.73]1.54E-03-327.72[-459.47, -195.98]1.35E-06LinearFEV1 Change ml/yr4.68[-15.69, 25.04]6.52E-01-2.50[-17.51, 12.50]7.43E-01Linear % emphysema (-950HU) -4.49[-7.77, -1.20]7.49E-034.28[1.94, 6.63]3.59E-04Linear Exacerbation Frequency -0.73[-1.13, -0.34]3.10E-040.03[-0.26, 0.32]8.54E-01Linear Airway Wall Thickness (Pi10) -0.02[-0.05, 0.02]2.89E-010.02[-0.03, 0.06]4.39E-01LinearFEV1, Forced expiratory volume in 1 s; Pi10, The square root of the wall area of a hypothetical airway with a 10-mm internal perimeter
Discussion
We performed RNA-sequencing on whole blood samples collected at Phase 2 (5-year) and Phase 3 (10-year) visits in the COPDGene Study to identify gene expression signatures associated with FEV_1_ decline. Our primary analyses included FEV_1_ change and longitudinal models; cross-sectional findings are presented in the Supplementary Materials to provide additional context. Each analysis revealed a unique set of genes, and there was a limited overlap between the results, highlighting the complexity of gene expression changes over time in COPD. In addition, we generated a gene signature relevant to lung function decline that is significantly associated with key clinical traits related to COPD. Finally, we were able to replicate most of the gene signature associations in the ECLIPSE study, demonstrating the robustness of the composite signatures.
We compared the outcomes of the FEV_1_ change analysis with the cross-sectional analysis. We found that 15 genes (p < 0.05) overlapped between the FEV_1_ change analyses and the cross-sectional analysis. Additionally, 137 genes were uniquely associated with FEV_1_ change and not identified in the other analyses. These findings suggest that while some genes are consistently associated with FEV_1_ in both types of analysis, other genes may be more relevant for changes in lung function over time.
Finally, when we compared these previous analyses with the longitudinal linear regression analysis, which examined the association between changes in gene expression from Phase 2 to Phase 3 and the change in FEV_1_ over the same period, we observed several overlaps. Two genes were common to both the cross-sectional and FEV_1_ change analyses, 64 genes overlapped only with the cross-sectional analysis, 24 genes were shared exclusively with the FEV_1_ Change analysis, and 442 genes were unique to the longitudinal analysis. These results suggest that the longitudinal analysis uncovers additional gene associations that may be missed by cross-sectional or FEV_1_ change approaches, emphasizing the value of longitudinal methods in identifying genes related to changes in lung function.
Among the genes identified in the longitudinal analysis, several have previously been associated with FEV_1_ and COPD. MMP9 encodes the enzyme Matrix metalloproteinase-9 (MMP-9) which is implicated in the development of emphysema, mediating inflammation through extracellular matrix degradation and neutrophil recruitment [16]. IL1RL1 encodes Interleukin 1 receptor-like 1 (IL1RL1), also known as suppression of tumorigenicity 2 (ST2), is a receptor for interleukin 33 (IL-33) and is part of the interleukin 1 receptor family. IL-33 and its receptor ST2 have a role in mediating immune responses and alveolar damage [17], and this pathway is a target for novel COPD therapies including itepekimab and astegolimab [18, 19]. ALOX5AP gene encodes arachidonate 5-lipoxygenase activating protein (ALOX5AP) that is essential in producing leukotriene B4 (LTB4), a molecule that drives inflammation by recruiting neutrophils to the lungs in COPD [20]. Elevated LTB4 levels in sputum are associated with worsened lung function and disease progression in COPD [21].
Only two genes (NOV and AC009404.2) overlapped across all three analyses, highlighting their potential significance in COPD and lung function regulation. NOV, encoding the CCN3 protein, is involved in inflammation and apoptosis. It has been identified as a biomarker for acute lung injury [22], suggesting its potential role in lung repair and disease pathogenesis. AC009404.2 is annotated as a long non-coding RNA (lncRNA) located on chromosome 2, but it has not been studied in the respiratory literature.
The gene signature we generated for FEV_1_ change includes several genes previously associated with lung function, COPD, and related traits. AKAP6, which encodes A-kinase anchoring protein 6 (AKAP6), has been implicated in both COPD and lung function (FEV_1_/FVC ratio) through genome-wide association studies [23, 24]. Similarly, GPR15, which encodes G protein-coupled receptor 15, has emerged as a key gene associated with smoking status and more severe COPD [25, 26]. It acts as a chemoattractant receptor regulating immunity and T-cell migration, and its increased expression in smokers highlights its role in inflammation and smoking-related lung damage [27]. Single nucleotide polymorphisms in SLC4A10 and LAMA2, which encode solute carrier family 4 member 10 (SLC4A10) and laminin subunit alpha 2 (LAMA2) respectively, have also been associated with smoking status and lung function (forced vital capacity) [28–30], further supporting their relevance in COPD pathophysiology. Other genes in the signature, such as Chromosome 12 Open Reading Frame 42 (C12orf42) and phosphatidylinositol glycan anchor biosynthesis, class L (PIGL), have been associated with pulmonary arterial hypertension [31], smoking initiation [29], and FVC [24].
In addition to the genes previously associated with lung function and COPD, our gene signature was also associated with important COPD clinical traits related to FEV_1_ decline, such as severe exacerbations, exacerbation frequency, percent emphysema, and airway wall thickness. These associations suggest that the molecular factors influencing FEV_1_ decline may also be relevant to structural changes in the lungs and the severity of disease manifestations. Smoking cessation was associated with a significant reduction in the negative gene signature, highlighting its potential utility as a marker of inflammation or smoking-induced gene activity (see Supplementary material).
Interestingly, we were able to replicate most of the gene signature associations in another longitudinal COPD study, demonstrating consistent associations with FEV_1_ on a cross-sectional level, as well as with traits like airway wall thickness and exacerbation frequency. However, we were unable to replicate the association with FEV_1_ change. A possible reason is the differences in the time scale for lung function testing. In COPDGene, spirometry was performed every five years, whereas, in ECLIPSE, the measurements were taken annually, with a maximum follow-up of three years, which may have reduced the power of the analysis. This shorter follow-up may not have allowed enough time for a significant change in FEV_1_ to be detected.
Our study has several limitations. RNA-seq data were taken from blood samples, which may not perfectly capture the lung-specific aspects of COPD, However, they are well-suited for clinical applications and epidemiological research. This approach is particularly useful given that COPD has significant systemic comorbidities, including muscle loss, cardiovascular disease, and osteoporosis [32], highlighting the need for broader biomarker analysis beyond the lungs. The gene signature was generated using RNA-seq data from COPDGene, but the validation study used microarray data. Despite the differing technologies, the signature was replicated for many of the traits, which may imply better transferability of a gene signature biomarker as opposed to the expression of single genes. The sample size of Phase 3 RNA-sequencing was relatively small, which may have reduced our statistical power. Additionally, the longitudinal analysis was performed on only two-time points five years apart, which does not provide a full trajectory of FEV_1_ decline. Future studies will include larger sample sizes and more time points to improve the prediction of gene expression associations with lung function decline.
In conclusion, we identified genes associated with FEV_1_ decline in COPD, providing both previously known and novel insights into the molecular contributors to lung function decline. Our findings suggest that the identified genes may serve as potential biomarkers for COPD progression and targets for therapeutic intervention. Further studies are needed to validate these findings in larger cohorts, with more frequent longitudinal assessments, and in diverse populations, to better understand the clinical utility of these gene signatures in predicting disease trajectory for COPD patients.
Supplementary Information
Supplementary Material 1
Supplementary Material 2
The reference list from the paper itself. Each links out to its DOI / PubMed record.
- 1Chronic obstructive pulmonary disease (COPD). https://www.who.int/news-room/fact-sheets/detail/chronic-obstructive-pulmonary-disease-(copd) (accessed 5 September 2024).
- 22024 GOLD Report - Global Initiative for Chronic Obstructive Lung Disease - GOLD. https://goldcopd.org/2024-gold-report/ (accessed 5 September 2024).
- 3Zhang Y, Parmigiani G, Johnson WE. Com Bat-seq: batch effect adjustment for RNA-seq count data. NAR Genom Bioinform. 2020;2. 10.1093/NARGAB/LQAA 078.10.1093/nargab/lqaa 078PMC 751832433015620 · doi ↗ · pubmed ↗
- 4Hänzelmann S, Castelo R, Guinney J. BMC Bioinformatics. 2013;14:1–15. 10.1186/1471-2105-14-7/FIGURES/7. GSVA: Gene set variation analysis for microarray and RNA-Seq data.10.1186/1471-2105-14-7PMC 361832123323831 · doi ↗ · pubmed ↗
- 5Parker MM, Chase RP, Lamb A, et al. RNA sequencing identifies novel non-coding RNA and exon-specific effects associated with cigarette smoking. BMC Med Genomics. 2017;10. 10.1186/S 12920-017-0295-9.10.1186/s 12920-017-0295-9PMC 622586628985737 · doi ↗ · pubmed ↗
- 6Andersen AM, Lei MK, Beach SRH, et al. Inflammatory biomarker relationships with helper T cell GPR 15 expression and cannabis and tobacco smoking. J Psychosom Res. 2021;141. 10.1016/J.JPSYCHORES.2020.110326.10.1016/j.jpsychores.2020.110326 PMC 904500133310155 · doi ↗ · pubmed ↗
- 7Pu A, Ramani G, Chen Y-J, et al. Identification of novel genetic variants, including PIM 1 and LINC 01491, with ICD-10 based diagnosis of pulmonary arterial hypertension in the UK biobank cohort. Front Drug Discovery. 2023;3. 10.3389/FDDSV.2023.1127736.10.3389/fddsv.2023.1127736 PMC 1012121437089865 · doi ↗ · pubmed ↗