Association of different serum creatinine trajectories with 28-day mortality in patients with acute kidney injury on chronic kidney disease: based on the MIMIC-IV database
Jun Ying, Hanjing Zhou, Yingxin Zhang, Shan Zhu, Gancong Zhang, Jian Huang

TL;DR
This study examines how changes in serum creatinine levels in patients with chronic kidney disease and acute kidney injury relate to 28-day mortality using hospital data.
Contribution
The study identifies distinct serum creatinine trajectories and their association with mortality risk in AKI on CKD patients.
Findings
Five serum creatinine trajectory groups were identified, with Groups G4 and G5 showing higher 28-day mortality risks.
The predictive model (model 3) demonstrated good performance with an AUC of 0.795.
Subgroup analysis confirmed increased mortality risk in Groups G4 and G5 for both males and females.
Abstract
To evaluate the relationship between short-term longitudinal serum creatinine (Scr) trajectories and 28-day mortality in patients with acute kidney injury (AKI) on chronic kidney disease (CKD). The data sources of this study were the Medical Information Mart for Intensive Care IV (MIMIC-IV) database. Group-Based Trajectory Modeling was used to classify the trajectories of Scr indices within 96 h after Intensive Care Unit admission. Kaplan–Meier survival curves were used to analyze the 28-day survival probabilities of patients with different Scr trajectories. Multivariate Cox proportional hazards models were applied to explore the association between different Scr trajectories and 28-day mortality. Receiver operating characteristic curves were employed to assess the predictive performance of the predictive model (model 3) for 28-day mortality. Decision curve analysis (DCA) was conducted…
Genes, proteins, chemicals, diseases, species, mutations and cell lines named across the full text — each resolved to its canonical identifier and authoritative record.
Click any figure to enlarge with its caption.
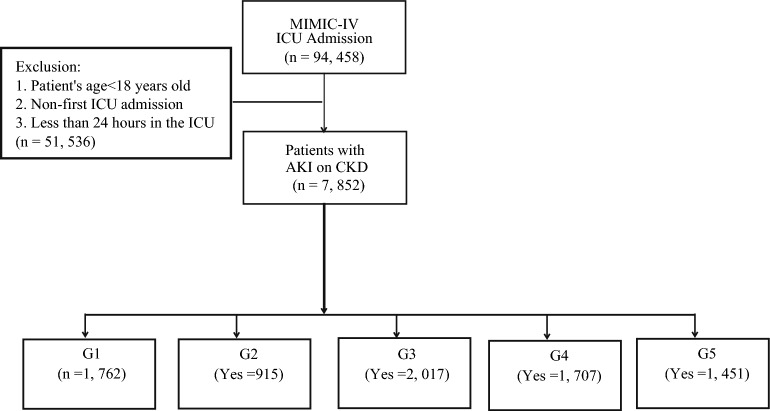 Figure 1
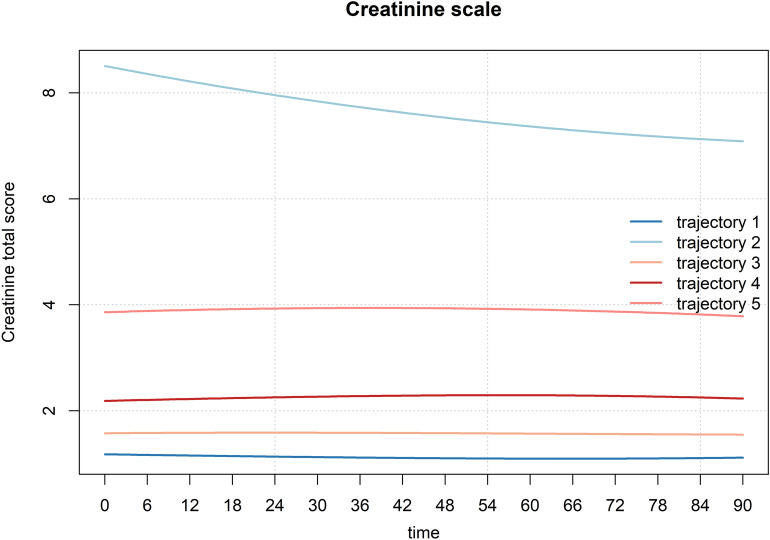 Figure 2
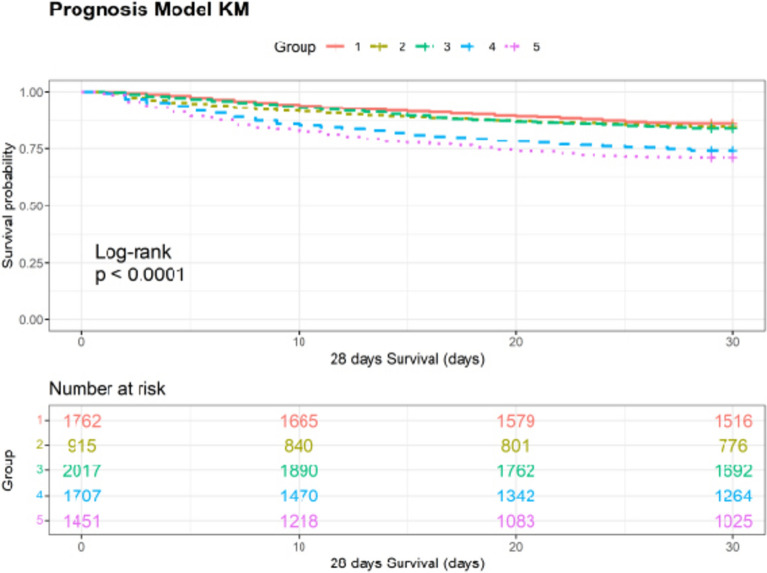 Figure 3
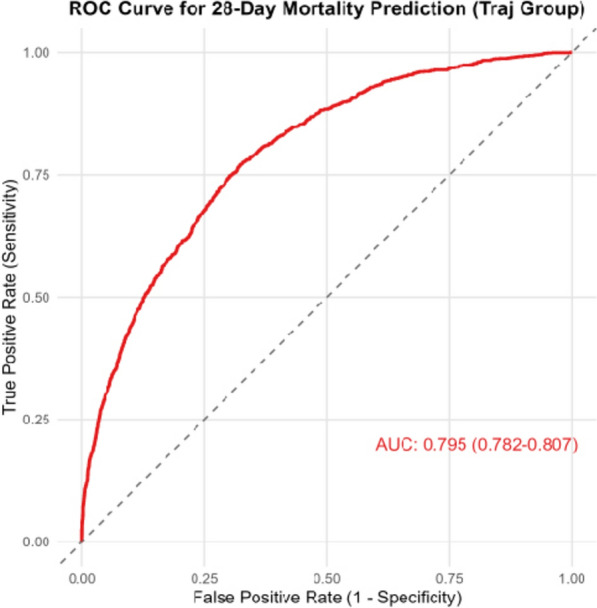 Figure 4
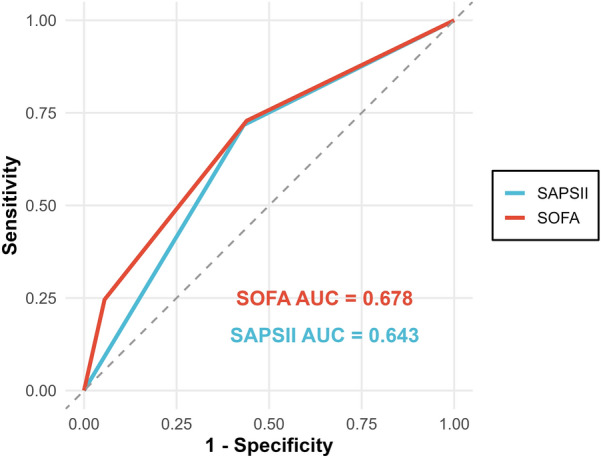 Figure 5
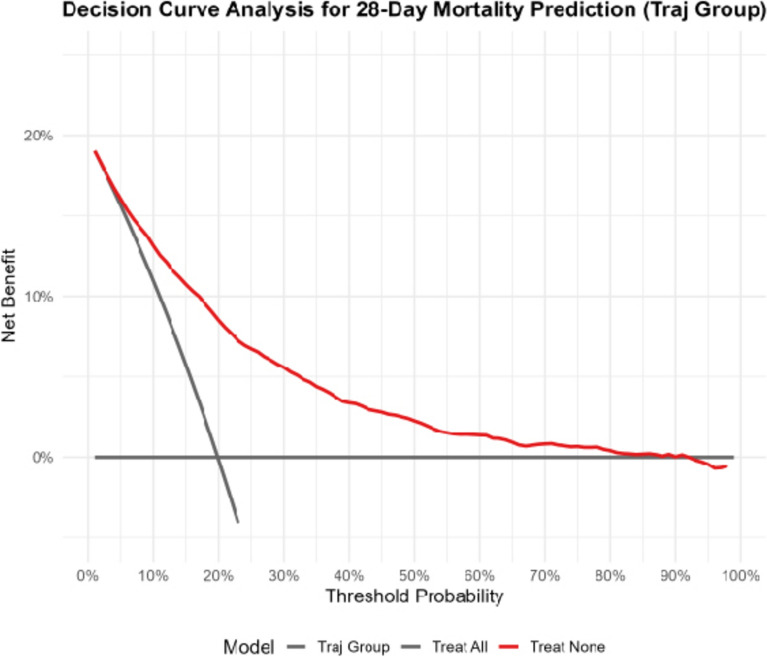 Figure 6
- —Jinhua Science and Technology Project
Peer Reviews
No public reviews on file for this paper yet. If you reviewed it on a platform where reviews are public (OpenReview, ICLR, NeurIPS, ICML), you can paste yours below so the community can read it here.
Videos
No videos yet. Explain this paper in a talk, walkthrough, or lecture? Add one.
Taxonomy
TopicsAcute Kidney Injury Research · Chronic Kidney Disease and Diabetes · Inflammation biomarkers and pathways
Introduction
Chronic kidney disease (CKD) is defined as a group of diseases characterized by structural or functional abnormalities of the kidneys lasting for more than 3 months [1]. In 2021, there were 19,935,038 new cases of CKD globally, with 673,722,703 prevalent cases and 1,527,629 deaths [2]. CKD is a major cause of chronic renal failure, cardiovascular diseases, and other conditions, posing a significant public health problem [3]. Acute kidney injury (AKI) is defined as a rapid increase in serum creatinine (Scr) levels, decreased urine output, or both [4]. AKI is a major risk factor for the development of CKD and end-stage renal disease [5]. Studies have found that 24.6% of AKI patients develop CKD within a 3-year follow-up period [6]. Conversely, CKD is also a risk factor for AKI [7]. CKD patients often develop AKI during hospitalization, significantly increasing short-term mortality risk. Given the substantial public health burden of both CKD and AKI, as well as the significant harm of AKI on CKD, urgent attention should be paid to AKI on CKD.
Scr, as a biomarker reflecting glomerular filtration function, has been widely used to assess renal function and diagnose kidney-related diseases [8]. The latest evidence showed that fluctuations in Scr are closely associated with the risk of death in CKD, but systematic trajectory typing research is lacking [9]. Trajectory studies can more strongly infer causal relationships through the sequence of time series. Group-based Trajectory Modeling (GBTM) is a common research method for time series. It can classify continuously measured data into several subgroups with similar evolutionary patterns [10]. Therefore, this study uses the Medical Information Mart for Intensive Care IV (MIMIC-IV) database to explore the association between Scr trajectories and 28-day mortality in AKI on CKD patients, which is of great significance for the early and precise identification of high-risk populations, as well as clinical intervention and resource allocation.
Methods
Data source
This study was a retrospective study. The data sources of this study was the MIMIC-IV databases. The MIMIC-IV database is a large publicly available intensive care dataset containing de-identified health-related data of Intensive Care Unit (ICU) patients from Beth Israel Deaconess Medical Center in the United States.
Patient selection
Inclusion criteria: 1. patients with a pre-admission or discharge diagnosis of CKD according to the International Classification of Diseases (ICD): ICD-9 code (585.x) or ICD-10 code (N18.x); 2. patients who develop AKI during hospitalization were diagnosed according to the Kidney Disease: Improving Global Outcomes (KDIGO) criteria: an increase in Scr of ≥ 0.3 mg/dL within 48 h, or an increase in Scr of ≥ 50% from the baseline within 7 days. Exclusion criteria: 1. patients aged < 18 years; 2. patients were not first-time ICU admissions; 3. patients with an ICU length of stay < 24 h. The patient screening processes for the MIMIC-IV were shown in Fig. 1.Fig. 1. The flowchart of participants in the MIMIC-IV database in this study. MIMIV-IV Medical Information Mart for Intensive Care IV
Outcome measure
The outcome of this study was 28-day mortality.
Data collection
This study collected age, gender (female, male), marital status (divorced, married, single, widowed), race (black, other, white), weight, diabetes (no, yes), congestive heart failure (no, yes), chronic pulmonary disease (no, yes), cerebrovascular disease (no, yes), rheumatic disease (no, yes), sepsis (no, yes), white blood cell (WBC), blood urea nitrogen (BUN), anion gap, total calcium, glucose, potassium, sodium, bicarbonate, chloride, Scr-baseline, Physiology Score II (SAPSII), Charlson Comorbidity Index (CCI), Sequential Organ Failure Assessment (SOFA), continuous renal replacement therapy (CRRT), renal replacement therapy (RRT), proteinuria, output urine, estimated glomerular filtration rate (eGFR), Δ eGFR, Δ eGFR percentage and hospital length of stay. For variables with missing data ≤ 20%, multiple imputation was performed, while those with missing data > 20% were excluded.
Serum creatinine measurement
Scr was measured and recorded at least three times during the first 96 h after admission to the ICU. In the case of multiple recordings of Scr in 6-h intervals, we calculated the mean of these recordings for further analysis in the present study. The Scr missing data were handled consistently with other covariates: for variables with missing data ≤ 20%, multiple imputation was performed, while those with missing data > 20% were excluded.
Statistical analysis
R 4.4.3 software was used for data description and statistical analysis. This study employed GBTM to analyze the trajectories of Scr indices within 96 h after ICU admission. To ensure an adequate sample size in each group, we constructed models with 2 to 5 groups and assigned group memberships accordingly. The optimal number of groups was determined by evaluating the following parameters: lower absolute values of Bayesian Information Criterion (BIC), Akaike Information Criterion (AIC), Consistent Akaike Information Criterion (CAIC), and Hannan–Quinn Information Criterion (HQIC); and an average posterior probability (AvePP) > 0.7 for each group. After determining the trajectories, normally distributed quantitative data were presented as mean [standard deviation (SD)] and analyzed using Student’s t-test. Non-normally distributed quantitative data were expressed as median (interquartile range [IQR]) and analyzed using the Mann–Whitney U test. Categorical variables were described as numbers (percentages) and analyzed using the Chi-square test. Kaplan–Meier (KM) survival curves were used to analyze the 28-day survival probabilities of patients with different Scr trajectories. Multivariate Cox proportional hazards models were used to explore the relationship between different Scr trajectories and 28-day mortality across three models (Model 1, Model 2, and Model 3). The results are presented as hazard ratios (HR) with 95% confidence intervals (95% CI). Model 1 included no adjustments. Model 2 was adjusted for age, gender, race, marital status, and weight. Model 3 was adjusted for age, gender, marital status, race, weight, diabetes, congestive heart failure, chronic pulmonary disease, cerebrovascular disease, rheumatic disease, sepsis, WBC, BUN, anion gap, total calcium, glucose, potassium, sodium, bicarbonate, chloride, Scr-baseline, SAPSII, CCI, SOFA, CRRT, RRT, proteinuria, output urine, eGFR, Δ eGFR. Model 3 was identified as the predictive model in this study. Receiver operating characteristic (ROC) curves were used to evaluate the predictive performance of the predictive model, SOFA and SAPSII in predicting 28-day mortality. Decision curve analysis (DCA) was performed to explore differences in the clinical net benefit of the predictive model. Subgroup analysis was stratified by Scr-baseline and sex to explore the robustness of the relationship. Statistical significance was defined as P < 0.05.
Results
Serum creatinine trajectories
A total of 7,852 patients with AKI on CKD were included in this study. GBTM analysis identified 5 distinct trajectories (Fig. 2 and Table 1). These groups exhibited high AvePP (> 0.97) and the smallest BIC, AIC, and HQIC values. The five trajectory groups were as follows: Group G1 (n = 1762, 22.4%) with Scr levels maintained at approximately 1 and showing a stable trend (Scr low-stable group); Group G2 (n = 915, 11.7%) with baseline Scr levels above 8 and showing a decreasing trend (Scr high-decreasing group); Group G3 (n = 2017, 25.7%) with Scr levels maintained at approximately 1.3–1.5 and showing a stable trend (Scr moderate-low stable group); Group G4 (n = 1707, 21.7%) with Scr levels maintained at approximately 2 and showing a stable trend (Scr moderate-stable group); and Group G5 (n = 1451, 18.5%) with Scr levels maintained at approximately 4 and showing a stable trend (Scr moderate-high stable group).Fig. 2. Trajectories of serum creatinine within 96 h after ICU admission in patients with CKD complicated by AKI. ICU Intensive Care Unit, CKD chronic kidney disease, AKI acute kidney injuryTable 1Selection of trajectory groupsModelAvePPAICBICCAICSSBICHQICTrajectory 1100%569031.1569060.3569063.3569050.7569039.8Trajectory 299.7%/99.7%346578.1346646.3346653.3346624.0346598.6Trajectory 399.3%/099.3%/98.7%284827.2284983.1284999.1284932.2284874.0Trajectory 499.0%/99.1%/98.2%/98.7%248462.1248666.6248687.6248599.9248523.5Trajectory 597.8%/98.9%/97.2%98.0%/98.6%229370.9229633.9229660.9229548.1229449.9AvePP average posterior probability, AIC Akaike Information Criterion, BIC Bayesian Information Criterion, CAIC Consistent Akaike Information Criterion, SSBIC Sample-Size Adjusted Bayesian Information Criterion, HQIC Hannan–Quinn Information Criterion
Baseline characteristics of patients
The basic characteristics of AKI on CKD patients across different trajectory groups are shown in Table 2. Compared with other groups, Group G1 (76.32 years, SD = 11.81) and Group G3 (76.02 years, SD = 11.53) had higher mean ages. Group G1 also had a higher proportion of females (N = 781, 44.3%). In females, Group G1 (27.1%) and Group G3 (24.1%) were more represented, whereas in males, Group G3 (26.6%) and Group G4 (22.3%) accounted for a higher proportion (Supplementary Table 1). There were differences in marital status and race distribution among the groups. In terms of comorbidities, Group G5 had a significantly higher prevalence of diabetes and sepsis; Group G4 had a higher prevalence of chronic pulmonary disease and congestive heart failure; and Group G1 had a higher prevalence of cerebrovascular diseases. Regarding prognostic scores, Group G1 had lower SAPS II and SOFA scores, while Group G2 had a lower CCI score. Significant differences were observed among the five groups in WBC, BUN, anion gap, total calcium, glucose, potassium, sodium, bicarbonate, and chloride levels. Group G2 had the highest Scr-baseline levels and Δ eGFR percentage. Group G2 and Group G5 had a higher demand for CRRT and RRT. Group G1 showed the highest urine output, eGFR levels, and Δ eGFR. There were also differences in 28-day mortality among the five groups, with Groups G4 and G5 having higher 28-day mortality rates. Table 2. Baseline characteristics of patientsLevelG1G2G3G4G5PN1762915201717071451Gender (%) Female781 (44.3)280 (30.6)694 (34.4)600 (35.1)527 (36.3) < 0.001 Male981 (55.7)635 (69.4)1323 (65.6)1107 (64.9)924 (63.7)Age, mean (SD)76.32 (11.81)62.62 (14.47)76.02 (11.53)74.26 (12.52)71.53 (12.87) < 0.001Marital status (%) Divorced135 (7.7)72 (7.9)165 (8.2)103 (6.0)123 (8.5) < 0.001 Married851 (48.3)436 (47.7)1011 (50.1)889 (52.1)736 (50.7) Single399 (22.6)333 (36.4)402 (19.9)378 (22.1)370 (25.5) Widowed377 (21.4)74 (8.1)439 (21.8)337 (19.7)222 (15.3)Race (%) Black180 (10.2)250 (27.3)227 (11.3)208 (12.2)210 (14.5) < 0.001 Other354 (20.1)253 (27.7)392 (19.4)372 (21.8)337 (23.2) White1228 (69.7)412 (45.0)1398 (69.3)1127 (66.0)904 (62.3)Hospital length of stay, mean (SD)12.27 (10.97)13.79 (13.69)12.64 (11.68)14.15 (13.59)13.95 (16.86) < 0.00128-day mortality (%) No1519 (86.2)777 (84.9)1697 (84.1)1266 (74.2)1034 (71.3) < 0.001 Yes243 (13.8)138 (15.1)320 (15.9)441 (25.8)417 (28.7)Weight, mean (SD)81.61 (22.47)84.38 (24.10)85.47 (23.54)85.44 (24.60)83.69 (24.52) < 0.001Diabetes (%) No1007 (57.2)398 (43.5)1007 (49.9)840 (49.2)624 (43.0) < 0.001 Yes755 (42.8)517 (56.5)1010 (50.1)867 (50.8)827 (57.0)Congestive heart failure (%) No996 (56.5)491 (53.7)927 (46.0)669 (39.2)636 (43.8) < 0.001 Yes766 (43.5)424 (46.3)1090 (54.0)1038 (60.8)815 (56.2)Chronic pulmonary disease (%) No1240 (70.4)736 (80.4)1432 (71.0)1176 (68.9)1033 (71.2) < 0.001 Yes522 (29.6)179 (19.6)585 (29.0)531 (31.1)418 (28.8)Cerebrovascular disease (%) No1403 (79.6)793 (86.7)1661 (82.4)1442 (84.5)1234 (85.0) < 0.001 Yes359 (20.4)122 (13.3)356 (17.6)265 (15.5)217 (15.0)Rheumatic disease (%) No1679 (95.3)878 (96.0)1936 (96.0)1625 (95.2)1397 (96.3)0.478 Yes83 (4.7)37 (4.0)81 (4.0)82 (4.8)54 (3.7)SAPSII, mean (SD)39.58 (11.65)44.62 (13.79)42.12 (12.18)46.21 (13.51)48.12 (14.10) < 0.001SOFA, mean (SD)5.49 (3.13)8.43 (3.24)6.18 (3.25)7.86 (3.73)8.81 (3.75) < 0.001CCI, mean (SD)8.10 (2.32)6.78 (2.61)8.26 (2.28)8.28 (2.24)8.14 (2.45) < 0.001WBC, mean (SD)10.81 (8.20)10.62 (6.59)10.75 (7.65)12.27 (12.53)11.85 (7.39) < 0.001BUN, mean (SD)25.38 (12.26)68.62 (35.17)34.63 (16.21)47.18 (23.46)60.25 (31.87) < 0.001Anion gap, mean (SD)13.86 (3.70)20.12 (5.03)14.56 (3.57)15.68 (4.14)17.65 (4.77) < 0.001Total calcium, mean (SD)8.62 (0.78)8.56 (1.12)8.67 (0.83)8.58 (0.90)8.46 (0.96) < 0.001Chloride, mean (SD)103.01 (5.97)97.97 (7.04)103.08 (6.09)102.98 (7.08)101.52 (7.45) < 0.001Glucose, mean (SD)145.36 (86.86)151.51 (103.92)154.69 (82.00)161.96 (93.91)158.65 (100.72) < 0.001Potassium, mean (SD)4.15 (0.65)4.85 (0.99)4.33 (0.73)4.46 (0.83)4.64 (0.92) < 0.001Sodium, mean (SD)139.00 (28.99)136.90 (5.37)138.30 (5.00)137.88 (5.70)137.25 (5.66)0.001Bicarbonate, mean (SD)23.91 (4.31)21.73 (5.74)23.42 (4.49)22.10 (4.97)21.02 (5.48) < 0.001Scr-baseline, mean (SD)1.19 (0.29)8.43 (3.61)1.59 (0.37)2.20 (0.68)3.87 (1.38) < 0.001CRRT (%) No1729 (98.1)695 (76.0)1939 (96.1)1495 (87.6)1113 (76.7) < 0.001 Yes33 (1.9)220 (24.0)78 (3.9)212 (12.4)338 (23.3)RRT (%) No1718 (97.5)182 (19.9)1922 (95.3)1448 (84.8)771 (53.1) < 0.001 Yes44 (2.5)733 (80.1)95 (4.7)259 (15.2)680 (46.9)Proteinuria (%) No1760 (99.9)914 (99.9)2016 (100.0)1707 (100.0)1451 (100.0)0.466 Yes2 (0.1)1 (0.1)1 (0.0)0 (0.0)0 (0.0)Output urine, mean (SD)216.18 (210.66)127.76 (206.41)203.21 (223.03)182.45 (202.41)150.75 (192.79) < 0.001eGFR, mean (SD)59.39 (18.41)7.49 (4.26)43.86 (14.11)31.90 (13.70)17.47 (10.15) < 0.001Sepsis (%) No835 (47.4)366 (40.0)933 (46.3)594 (34.8)443 (30.5) < 0.001 Yes927 (52.6)549 (60.0)1084 (53.7)1113 (65.2)1008 (69.5)Δ eGFR, mean (SD)4.59 (21.24)2.14 (8.76)1.14 (18.79)−0.96 (20.12)0.22 (14.65) < 0.001Δ eGFR percentage, mean (SD)14.64 (41.62)56.49 (158.78)12.05 (49.54)16.51 (83.21)29.13 (109.77) < 0.001WBC white blood cell, BUN blood urea nitrogen, SAPSII Simplified Acute Physiology Score II, CCI Charlson Comorbidity Index, SOFA Sequential Organ Failure Assessment, Scr serum creatinine, CRRT continuous renal replacement therapy, RRT renal replacement therapy, eGFR estimated glomerular filtration rate
28-day survival curves for different serum creatinine trajectory groups
As shown in Fig. 3, there were differences in 28-day mortality among the five Scr trajectory groups. The 28-day survival probabilities in Groups G1, G2, and G3 were higher than that in Groups G4 and G5. Group G5 had the highest 28-day mortality rate, while Group G1 had the lowest.Fig. 328-day survival curves for different serum creatinine trajectory groups
Relationship between serum creatinine trajectory groups and 28-day mortality
In model 1, compared with Group G1, Group G4 (HR = 2.039, 95% CI: 1.743–2.384, P < 0.001) and Group G5 (HR = 2.349, 95% CI: 2.005–2.751, P < 0.001) showed a significantly increased risk of 28-day mortality (Table 3). Table 3. Relationship between serum creatinine trajectory groups and 28-day mortalityReferenceTrajectory groupPHR (95% CI)Model 1 Group G1 (Reference)Group G20.2881.120 (0.909–1.380)Group G30.0721.165 (0.986–1.377)Group G4 < 0.0012.039 (1.743–2.384)Group G5 < 0.0012.349 (2.005–2.751)Model 2Group G1 (Reference) Group G2 < 0.0011.699 (1.366–2.113)Group G30.0211.217 (1.029–1.438)Group G4 < 0.0012.229 (1.905–2.609)Group G5 < 0.0012.783 (2.371–3.267)Model 3 Group G1 (Reference)Group G20.0071.819 (1.176–2.816)Group G30.4461.081 (0.885–1.319)Group G40.0031.454 (1.139–1.856)Group G5 < 0.0011.860 (1.362–2.540)Model 1 without adjustments. Model 2 was adjusted for age, gender, race, marital status, and weight. Model 3 was adjusted for age, gender, marital status, race, weight, diabetes, congestive heart failure, chronic pulmonary disease, cerebrovascular disease, rheumatic disease, sepsis, WBC, BUN, anion gap, total calcium, glucose, potassium, sodium, bicarbonate, chloride, Scr-baseline, SAPSII, CCI, SOFA, CRRT, RRT, proteinuria, output urine, eGFR, Δ eGFR
In model 2, compared with Group G1, the risk of 28-day mortality was significantly increased in Group G2 (HR = 1.699, 95% CI: 1.366–2.113, P < 0.001), Group G3 (HR = 1.217, 95% CI: 1.029–1.438, P = 0.021), Group G4 (HR = 2.229, 95% CI: 1.905–2.609, P < 0.001), and Group G5 (HR = 2.783, 95% CI: 2.371–3.267, P < 0.001) (Table 3).
In model 3, compared with Group G1, the risk of 28-day mortality increased by 0.819-fold in Group G2 (HR = 1.819, 95% CI: 1.176–2.816, P = 0.007), by 0.454-fold in Group G4 (HR = 1.454, 95% CI: 1.139–1.856, P = 0.003) and by 0.860-fold in Group G5 (HR = 1.860, 95% CI: 1.362–2.540, P < 0.001) (Table 3).
Predictive performance and clinical net benefit of predictive model
The model 3 was identified as the predictive model in this study. ROC curves were constructed to explore its ability to predict 28-day mortality in patients with AKI on CKD. As shown in Fig. 4, the area under the curve (AUC) of the predictive model was 0.795 (95% CI 0.782–0.807). The AUCs of SOFA and SAPSII for predicting 28-day mortality in patients with AKI on CKD were 0.678 and 0.643, respectively (Fig. 5). The predictive performance of the predictive model was superior to that of SOFA and SAPSII. The DCA results indicated that when the threshold probability ranged from 5 to 85%, the net benefit of the predictive model was significantly higher than that of the "treat all" and "treat none" models (Fig. 6).Fig. 4ROC curve of the predictive model for 28-day mortality in patients with CKD complicated by AKI. ROC receiver operating characteristic, CKD chronic kidney disease, AKI acute kidney injuryFig. 5ROC curve of SOFA and SAPSII for 28-day mortality in patients with CKD complicated by AKI. ROC receiver operating characteristic, SOFA Sequential Organ Failure Assessment, SAPSII Simplified Acute Physiology Score II, CKD chronic kidney disease, AKI acute kidney injuryFig. 6Clinical net benefit of the predictive model
Subgroup analysis
As shown in Table 4, Group G4 and Group G5 were associated with an increased 28-day mortality in both male and female subgroups. The Scr-baseline and Scr trajectory had an interaction, and the positive association of Group G4 and Group G5 with 28-day mortality was observed in the subgroup with Scr- baseline ≤ 1.8. Table 4. Subgroup analysisSubgroupHR(95% CI)P**P for interactionFemale0.181 Group G1Reference Group G20.95 (0.67–1.34)0.756 Group G31.09 (0.85–1.41)0.499 Group G41.72 (1.36–2.17) < 0.001 Group G51.46 (1.14–1.88)0.003Male Group G1Reference Group G20.83 (0.64–1.09)0.176 Group G30.92 (0.74–1.15)0.465 Group G41.35 (1.10–1.67)0.005 Group G51.59 (1.29–1.96) < 0.001Scr-baseline (≤ 1.8)0.042 Group G1Reference Group G22.75 (0.68–11.06)0.154 Group G30.97 (0.81–1.16)0.753 Group G41.74 (1.41–2.14) < 0.001 Group G52.71 (1.86–3.96) < 0.001Scr-baseline (> 1.8) Group G1Reference Group G23.59 (0.50–25.64)0.203 GroupG34.13 (0.57–29.72)0.159 GroupG45.76 (0.81–41.03)0.080 Group G56.19 (0.87–44.09)0.069Scr serum creatinine
Discussion
Based on the MIMIC-IV database, this study explored the relationship between different Scr trajectory groups and 28-day mortality in patients with AKI on CKD. It was found that patients in Group G2 (Scr high-decreasing trend), Group G4 (Scr moderate-stable trend), and Group G5 (Scr moderate-high stable trend) had a higher risk of 28-day mortality.
In this study, distinct Scr trajectories were associated with varying 28-day mortality risks. In a study, AKI patients with a rapid increase in Scr had significantly higher 7-day mortality, and all-cause in-hospital mortality, with a positive correlation observed between Scr trajectory and these outcomes [11]. Scr trajectories have also been linked to prognosis in various other diseases. A retrospective cohort study categorized 7-day Scr trajectories into four groups and found that patients with a significant and persistent increase in Scr had significantly higher 1-year mortality after heart valve surgery compared to the other groups, and this trajectory was an independent risk factor for 1-year mortality [12]. Another retrospective cohort study on acute organophosphorus poisoning showed that compared to the "normal-consistent Scr" group, the "normal-increasing Scr" and "high-declining Scr" groups had higher ICU mortality, with HRs of 15.2 (95% CI: 4.2–54.6) and 15.7 (95% CI: 3.4–71.6), respectively [13]. A real-world study found that patients with increased Scr had a higher risk of in-hospital mortality, while those with normal baseline renal function and decreased Scr during hospitalization had a higher in-hospital mortality risk but a lower 90-day mortality risk [14]. In summary, the Scr trajectory can serve as an important indicator for assessing the short-term and long-term mortality risks of patients (especially critically ill or post-operative patients) and has significant reference value for clinical prognosis judgment.
The normal reference range for Scr is 0.7–1.4 mg/dL in males and 0.6–1.0 mg/dL in females [15]. In this study, the baseline Scr levels in Groups G2, G4, and G5 were significantly higher than these normal ranges. Elevated Scr reflects reduced glomerular filtration rate, which induces metabolic waste retention and water-electrolyte imbalance, increasing cardiovascular load and arrhythmia risk [16, 17]. In AKI on CKD, intra-renal inflammation is aggravated; pro-inflammatory factors trigger systemic inflammatory response syndrome to promote multi-organ dysfunction, while uremic toxins damage vascular endothelium, accelerating atherosclerosis and fatal cardiovascular events such as acute heart failure [18–21]. Additionally, impaired renal function causes abnormal protein metabolism and immune dysfunction, elevating infection risk and forming a vicious "infection–renal injury" cycle [22, 23]. Notably, Group G3 was not associated with increased 28-day mortality, which may be attributed to the lower Scr levels, lower SOFA scores, and higher eGFR levels in this group. The Scr levels in Group G3 remained stable at approximately 1.3–1.5, indicating that renal filtration function was essentially maintained to excrete metabolic wastes in the body. The lower SOFA scores suggest that the degree of multiple organ dysfunction in this group was mild, with a lower risk of systemic inflammatory response and organ failure, thereby reducing the likelihood of 28-day mortality due to multiple organ failure [24]. The higher eGFR levels indicate that the actual filtration capacity of the kidneys was adequate, further supporting the kidneys' compensatory capacity for metabolic demands and avoiding a series of life-threatening metabolic disorders caused by severe impairment of renal function [25].
The results of subgroup analysis showed that Group G4 and Group G5 were significantly associated with an increased risk of 28-day mortality in both male and female subgroups, suggesting that the adverse effects of these two trajectory groups on mortality have gender universality and are not interfered with by differences in physiology and clinical interventions caused by gender disparities. Particularly critical is that there was a significant interaction between Scr-baseline and Scr trajectory; the positive association of Group G4 and Group G5 with 28-day mortality was only observed in the subgroup with Scr -baseline ≤ 1.8. This may be because when Scr-baseline ≤ 1.8, the renal filtration function is fundamentally adequate, and abnormal changes in Scr trajectory at this time are more likely to reflect potential damage to renal function, thereby affecting prognosis. This finding provides a reference for clinical practice in formulating individualized prognostic assessment protocols for patients with different baseline Scr levels.
Traditional disease mortality risk assessment methods like prospective cohort studies usually categorize subjects by an indicator’s single-time-point measurement. However, such a single measurement is insufficient for mortality prediction, as it overlooks inter-individual heterogeneity and fails to reflect longitudinal data’s variation patterns and trends, thus limiting the description of inherent associations. Therefore, this study adopted trajectory analysis to explore the relationship between Scr and 28-day mortality in CKD patients complicated with AKI. Common trajectory analysis methods include GBTM, Growth Mixture Model (GMM), and cluster analysis. Relevant studies have shown that GMM performs best in single-trajectory analysis; GBTM has good overall performance and can be extended to multi-trajectory studies; cluster analysis works adequately for multi-trajectory analysis but requires high-quality follow-up data [26]. Thus, the choice of trajectory analysis method should be based on the specific characteristics of the data.
In this study, we identified distinct Scr trajectories and further analyzed their associations with 28-day mortality in AKI on CKD patients. Our findings may provide epidemiological evidence for understanding the changes in Scr levels after ICU admission and their correlation with 28-day mortality in this patient population. However, this study has several limitations. First, relying on a single-center dataset inherently limits generalizability. The MIMIC-IV database-derived cohort may not represent broader CKD or AKI populations, as patient characteristics, diagnostic criteria, and treatment protocols can vary significantly across medical institutions, regions, and healthcare systems. Future research must validate these results in independent, multi-center cohorts encompassing diverse patient populations—including different age groups, races, comorbidity spectrums, and varying levels of healthcare access. Second, we only analyzed the impact of Scr trajectories within 96 h of ICU admission on 28-day mortality; the effect of longer-term Scr trajectories on the prognosis of CKD patients with AKI requires further investigation.
Conclusion
This study analyzed the impact of Scr trajectories on 28-day mortality in patients with AKI on CKD. The results showed that patients with a Scr high-decreasing trend, Scr moderate-stable trend, and Scr moderate-high stable trend, these three groups of patients, had a higher risk of 28-day mortality. These findings may help in the early identification of high-risk populations, facilitating clinical intervention and resource allocation.
Supplementary Information
Supplementary material 1.