Defining Elite Zones: A Scoping Review of Body Physique and Body Fat in Elite Athletes
Ximena Martinez-Mireles, Erik Ramírez, José Omar Lagunes-Carrasco, Ricardo López-García, Silvia García, Cristina Bouzas, Rogelio Salas-García, Josep A. Tur

TL;DR
This study reviews body physique and fat percentages in elite athletes using the Hattori chart to define an 'elite zone' for performance optimization.
Contribution
The study introduces the use of the Hattori chart to visualize and define body composition profiles specific to elite athletes.
Findings
Elite male athletes showed intermediate solid body physique and 13.6% ± 3.6% body fat using indirect methods.
Elite female athletes showed lean intermediate body physique and 22.3% ± 2.8% body fat using indirect methods.
The Hattori chart helps monitor body composition changes and guide nutrition for performance and health.
Abstract
Background: Body physique refers to body size, structure, and composition. PS is used to describe the profile of athletes in different sports. Aims: To determine body physique and body fat percentage in elite athletes using the Hattori chart and to identify the elite zone. Methods: Scoping review. The search was performed in PubMed, Google Scholar, Ovid Books, CAB eBooks, Clarivate InCites, MyiLibrary, Web of Science, Taylor & Francis Online, Core Collection, and Scopus. The search strategy was “body physique” OR “anthropometric” OR “body composition” AND “elite athlete” OR “athlete” OR “elite”. Results: Using indirect methods, elite athletes showed intermediate solid body physique (male) and lean intermediate body physique (female), and 13.6% ± 3.6% (male) and 22.3% ± 2.8 (female) body fat. Using doubly indirect methods, elite athletes showed lean intermediate body physique (male), and…
Click any figure to enlarge with its caption.
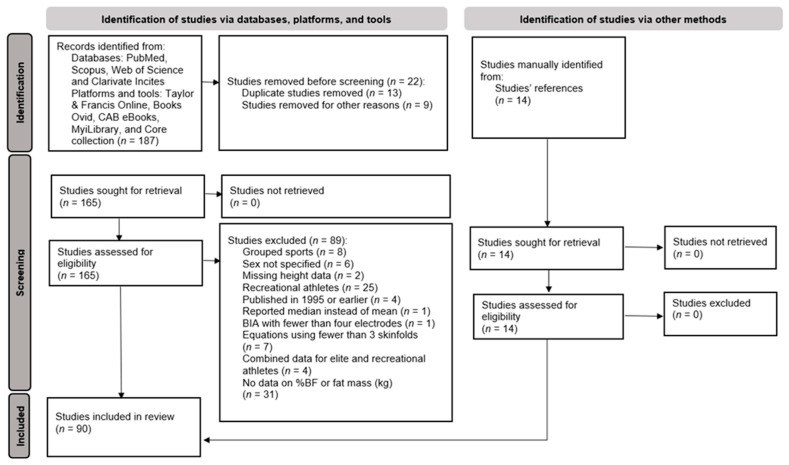 Figure 1
- —Instituto de Salud Carlos III through the Fondo de Investigación para la Salud
- —European Regional Development Fund, Red EXERNET-Red de Ejercicio Físico y Salud
- —IDISBA Grants (FOLIUM, PRIMUS, SYNERGIA, and LIBERI)
Peer Reviews
No public reviews on file for this paper yet. If you reviewed it on a platform where reviews are public (OpenReview, ICLR, NeurIPS, ICML), you can paste yours below so the community can read it here.
Videos
No videos yet. Explain this paper in a talk, walkthrough, or lecture? Add one.
Taxonomy
TopicsBody Composition Measurement Techniques · Genetics and Physical Performance · Nutrition and Health in Aging
1. Introduction
Body physique refers to body size, structure, and composition [1] and is used to describe the profile of athletes in different sports [2]. The Heath & Carter [3] somatotype is one of the most common methods for classifying somatotypes, which divides morphology into fat, musculoskeletal development, and relative linearity. Another method is the modified weight somatogram [4], which distinguishes muscular and non-muscular areas. The Phantom proportionality model [5] evaluates body proportions subjectively, without relying on absolute measurements. The Hattori chart [6] used the fat-free mass index (FFMI) and the fat mass index (FMI) to represent body physique, combining the percentage of body fat (BF%), a key component of body physique, and the body mass index (BMI). This last method is flexible and applicable to any population group. All of these methods can be applied to athletes of all sports [7], evaluating both muscle development [8] and body physique [9]. This method is flexible, applicable to any population group, and allows comparisons across sexes, disciplines, and performance levels. Furthermore, unlike the other methods mentioned above, which can mask differences in FMI and FFMI, the Hattori chart separates fat and lean contributions, providing a more precise morphological phenotype into nine categories. Given these advantages, the Hattori method offers clearer interpretability for sport scientists aiming to monitor body composition changes, classify physique types, and identify morphological zones associated with performance.
Morphological optimization is essential to maximize performance and monitor training success [10]. BF% is a crucial performance indicator for elite athletes in sports such as boxing, wrestling, and athletics. In aerobic disciplines such as marathon, low BF% and control of lean mass improves performance and helps to meet weight classes. Conversely, a high BF% may be beneficial in sports where body weight is relative, such as kayaking and canoeing [11]. Methods to measure BF% have evolved, from invasive procedures to more accessible indirect non-invasive techniques. However, despite the advances, differences between methods and the lack of standardization make it difficult to compare their precision [12].
Elite athletes are noted for their superior performance, consistent achievements, and years of experience [13]. Particularly, endurance athletes exhibit better adaptations in anaerobic threshold and VO_2_max [14]. Over time, athletes have shown increases in height and body mass, outpacing trends in the general population. This change has been associated with better performance and economic benefits. However, in some sports, athletes are required to maintain a specific range of body size, which has led to a stable morphology [15].
The evaluation of body physique in athletes is essential to classify and establish differences in terms of size, structure, and composition. This allows precise monitoring of performance, as well as comparisons between positions and other sports, helping to evaluate changes throughout macrocycles and facilitating the monitoring of morphological optimization. These results can be useful as a basis for future research, helping sports professionals to make appropriate decisions to improve the physique and performance of athletes. The evaluation of body physique in elite athletes has been used in fencing, artistic gymnastics, and combat sports to evaluate body composition, weight categories, styles of sport disciplines, and differences between sexes [16,17,18,19,20,21,22,23]. The performance of elite athletes is closely linked to their body physique, especially BF%. Despite biological and adaptive differences in body physique among elite athletes, few studies have summarized BF% data. Research in this area has been scarce lately, focusing on data from athletes prior to the year 2000 [11,16,24,25,26]. However, despite the greater availability of body composition studies in international athletes, the body physique and variation in fat percentage in modern elite athletes of both sexes has been scarcely determined [16]. The novelty of this scoping review lies not in the use of Hattori’s chart for elite athletes, but in its comprehensive synthesis of the available information, identification of gaps in knowledge, and provision of a solid basis for future research on the body physique of elite athletes of both sexes. Therefore, this scoping review aimed to determine body physique and body fat percentage in elite athletes using the Hattori chart [6] and to identify the elite zone.
2. Methods
Design. This study was carried out based on the 2018 PRISMA Extension for Scoping Reviews (PRISMA—ScR) guideline [27]. As this study is a scoping review, it was not registered in PROSPERO.
Eligibility criteria. The studies included in this scoping review were published between 1995 and 2024. From this date, indirect methods such as air-displacement plethysmography (ADP) and dual x-ray densitometry (DXA) were more widely used in assessment of body composition [28]. During the analysis of these data, an attempt was made to represent the secular evolution in the morphology of the elite athlete. Articles in English, Portuguese, and Spanish languages were selected, and studies on elite male and female athletes aged 12 to 45 were reviewed. This broad age spectrum was chosen because the highest performance varies widely across sports, occurring mainly in adolescence for several specialized disciplines such as gymnastics, but extending into the late 20s, 30s, or even 40s in endurance and strength events [29,30,31,32,33,34,35]. Articles that did not specify age (n = 3) or with open category for age (n = 1) were also included. The athletes were elite level, senior, Olympic, first division professionals, world record, world class, national level representatives, black belt, French Rating Scale of minimum 7a, non-professional sports with at least 10 years of experience, TOP ranking 10th at the national or international level, or high-level collegiate (world class, national representatives, or first division of the National Collegiate Athletics Association or first league of universities) [36].
The indirect methods used to assess body composition were hydrostatic weighing, air-displacement plethysmography (ADP) and dual energy X-ray absorptiometry (DXA). The doubly indirect methods considered were bioelectrical impedance analysis (BIA) with a minimum of four electrodes, ultrasounds, and anthropometry with equations derived from two-, three-, and four-compartment models. In papers that showed measurements with several methods, priority was given to data derived from the following techniques in this order: ADP, DXA, hydrostatic weighing, BIA, ultrasound, and anthropometry. Studies that calculated BF% with at least three skinfolds, including those for calculating body density, were also considered. When a study did not report the BF%, this value was determined as: BF% = fat mass (kg) * 100/body mass (kg). Finally, body composition data in basal, initial, or pre-competition periods were considered.
Articles that featured male and female athletes at the amateur, recreational, Paralympic, preschool, and school level (under 12 years of age), second and third division athletes, those with less than 9.9 years of experience, extreme sports, and winter sports were excluded. Winter sports were excluded because their environmental and physiological demands such as cold exposure and thermoregulation, as well as equipment constraints create morphological patterns not comparable to those of non-winter sports. Including winter sports would have reduced conceptual and methodological consistency in the analysis.
However, an article on an amateur athlete with a national TOP ranking of 7 was included. Articles from elite athletes that did not specify sex, sport practiced, reported median, or reported grouped body composition data were not considered. Also, those who used formulas to obtain BF% with less than two skinfolds and who did not present fat mass data (kg) were not considered.
Information sources. The literature search was carried out in the electronic databases Medline via PubMed, Google Scholar, Books Ovid, CAB eBooks, Clarivate InCites, MyiLibrary, Web of Science, Taylor & Francis Online, Core Collection, and Scopus. All studies from 1995 to 2024 were filtered. The first author conducted the search strategy and then discussed them with all authors. To conduct a more comprehensive scoping review, within the selected articles, other potential references were identified through manual searching, allowing them to add relevant articles not considered in the initial search.
Search. The search strategy for each electronic database included the terms “physical status” OR “anthropometric” OR “body composition” AND “elite athlete” OR “athlete” OR “elite”. Additionally, article references from other reviews were manually retrieved.
Selection and sources of evidence. The first author reviewed the articles in duplicate, and the second author performed a review to ensure that they met all inclusion criteria. The authors then examined 233 data from elite athletes and sought information on each body composition team that met the eligibility criteria. In articles that used published equations to predict BF%, the original sources were consulted to verify the correct transcription of the equations used. Three meetings were held between May and August (2024) to review the database. The review resulted in deleting 111 articles. The data from the studies collected included the following: last name of the first author, year published, title of the article, sport, type of sport, athlete level, specialty or position, body composition method, skin caliper, equation used, software version or model of the equipment (ADP, DXA, and BIA,), age, sex, height (cm), body mass (kg), BF%, and/or fat mass (FM).
Data collection process. Following the deleted articles, a meeting was held with all authors to discuss data elements relevant to a scoping review. The data for the development of the Hattori chart [6] were body mass (kg), height (m), BMI (kg/m^2^), and BF%. To prepare the body physique tables, the Nutri Solver^®^ software v.1 was used [36]. As quality control, the fat mass index (FMI) and fat-free mass index (FFMI) values were compared between the software and those calculated using Excel^®^. For the analysis of BF% and BMI, the D’Agostino Kurtosis descriptive statistical test was carried out to evaluate whether the data were normally distributed.
Data elements. To develop the results tables of this study, information on the country of origin or type of competition, athlete level, first author, year of publication, age, body mass, height, BMI, FMI, and FFMI were extracted from the publications, and the classification of body physique according to Hattori’s chart [7] was followed. To prepare the body physique graphs, FMI, FFMI, and athlete type data were used; moreover, the weighted average of BMI and BF% were obtained.
The elite zone was determined by integrating four variables: BMI, BF%, FMI, and FFMI. The FMI and FFMI were used to position athletes within the Hattori chart, as these indices independently represent fat and lean tissue adjusted for height and therefore define the compositional basis of the physique categories. BMI and BF% were analyzed alongside FMI and FFMI because they are consistently reported across studies using indirect and doubly indirect methods, enabling the synthesis of heterogeneous datasets. Moreover, BMI and BF% define the external phenotype in Hattori’s conceptual framework and allow the construction of interpretable boundaries that reflect the distribution of elite athletes. The mean and standard deviation of BMI and BF% were calculated across all included samples, and the ±1 SD and ±2 SD limits were used to outline the central morphology of elite athletes within the FMI–FFMI coordinate space. This combined approach provides both compositional precision and practical interpretability for sport scientists.
Synthesis of results. Studies were grouped by doubly indirect methods and indirect methods (male and female elite athletes), which were presented in tables separately by method and sex. To graph the results, the NCSS-8 program version 8.0.24, (Number Cruncher Statistical Systems, Kaysville, UT, USA) was used [37]. Body physique categories were derived from the mean and standard deviation (SD) of BMI and FFMI of adults aged 20.0 to 29.9 years [38] based on the third survey of the National Health and Nutrition Examination Survey (NHANES III). This age was selected since the elite athletes in the current study showed a mean age of 24.0 ± 5.4 years. The equation to determine BMI was body mass (kg)/height (m)^2^. In accordance with Hattori’s methodology [39], fat mass and fat-free mass were adjusted by the subject’s height to obtain body composition indices: FMI = fat mass (kg)/height (m)^2^ and FFMI = fat-free mass (kg)/height (m)^2^. The FMI and FFMI cut-off points were calculated from the mean ±1 SD. The FMI was placed on the Y-axis and the FFMI on the X-axis. The resulting categories are described in Table 1.
The combination of the coordinates of the X-axis (FFMI) and Y-axis (FMI) resulted in nine categories that determined different body physique morphotypes according to Hattori et al. [39] (Table 2).
The weighted means of BF% and BMI were used only to plot the group’s central point in the Hattori chart. To draw the constant BF% lines, BF% was derived from the mathematical relationship between FMI and FFMI using Hattori’s equation BF% = FMI/(FMI + FFMI) (100) [39]. This equation was applied exclusively to generate the lines in the chart and not to estimate the BF% of individual athletes, whose values were extracted directly from the original studies. In the second chart, the elite zone for athletes was represented as ±1 SD for BMI and BF% (68.2% of athletes). The second elite zone, ±2 SD of BF% and BMI, encompassed 95.45% of the population. To prepare the descriptive tables of the body physique categories, the weighted means of BMI, BF%, FMI, and FFMI were also determined. The risk of bias in the studies, summary measures, and additional analyses of the included studies was not assessed [27].
3. Results
From the initial searched articles (n = 187), 14 articles were added through manual searching in review studies, resulting in 201 obtained articles. Duplicate studies (n = 13) and keywords (n = 9) were screened and deleted. Next, 165 articles were evaluated for eligibility; 89 studies were excluded and 90 were included for the final review. Figure 1 shows the PRISMA flow-chart for the inclusion, exclusion, and removal of studies.
The main characteristics of the selected studies were presented with the following data: sport practiced, elite level, reference, age (years), height (meters), BMI (kg/m^2^), BF%, FMI (kg/m^2^), FFMI (kg/m^2^), and body physique. Likewise, the body composition results of elite athletes were shown with a total of 232 data points. Data from indirect methods in male athletes (n = 43) are shown in Table 3. The least used was hydrostatic weighing (n = 1), followed by ADP (n = 10) and DXA (n = 32). Data on elite female athletes (n = 18) are shown in Table 4. All data were obtained by DXA. See Supplemental Figures S1 and S2 for males and females, respectively.
Table 5 shows the body composition results of the elite male athletes (n = 115) that were measured with doubly indirect methods such as ultrasound (n = 3), BIA (n = 22), and anthropometry (n = 90). Table 6 shows articles from elite female athletes (n = 56). The methods reported were ultrasound (n = 3), BIA (n = 17), and anthropometry (n = 36). In total, combining indirect and doubly indirect methods, data from 232 athletes from 61 sports were considered. The risk of bias of the studies and additional analyses of the included studies were not assessed [27].
Body composition assessment using doubly indirect methods was applied in 65 papers, of which 47 used anthropometry. The equations most used in articles to calculate body composition in elite male athletes were Jackson and Pollock [63] (n = 9), followed by Durnin and Womersley [66] (n = 8) and Withers et al.’s unpublished data [10] (n = 7). In elite female athletes, the most used equations were Jackson et al. [124] (n = 7), Durnin and Womersley [66] (n = 5), Yuhasz [87] (n = 3), and Withers et al. [135] (n = 3).
The body physique of male elite athletes was lean intermediate with a BF% of 14.1 ± 5.4% (elite zone ±1 SD for BF%: 8.7% to 19.5%; BMI: 21.3 to 28.7 kg/m^2^). Similarly, female elite athletes exhibited lean intermediate physique with a BF% of 21.8 ± 4.1% (elite zone ±1 SD for BF%: 17.7% to 25.9%; BMI: 20.5 to 23.6 kg/m^2^).
A predominantly intermediate solid body physique (41.9%), followed by lean intermediate (23.3%) and lean solid (20.9%), adipose solid (9.3%), and intermediate (4.7%) physiques, was defined using indirect methods in 26.5 ± 5.2-year-old elite male athletes. The average BF% was 13.6% ± 3.6. Dominant body physiques of lean intermediate (38.9%), intermediate (33.3%), intermediate solid (22.2%), and lean solid (5.6%) were defined in 23.4 ± 5.6-year-old elite female athletes. The BF% in elite female athletes, measured by indirect methods, was 22.3% ± 2.8.
Using doubly indirect methods, the mean age of the elite male athletes was 23.8 ± 5.7 years. They showed a predominant body physique of lean intermediate (42.6%), followed by intermediate (27.0%), lean solid (14.8%), intermediate solid (12.2%), adipose solid (2.6%), and lean slender (0.9%). The average BF% was 13.7% ± 5.2. The elite female athletes assessed with the doubly indirect method had an average age of 23.3% ± 4.8 and an intermediate dominant body physique (44.6%), followed by lean intermediate (41.1%), lean solid (7.1%), and intermediate solid (7.1%). The mean BF% was 21.7% ± 4.3.
The elite zone of the athletes was defined as ±1 SD and ±2 SD for BF% and BMI. With indirect methods, the elite zone of BF% in male athletes at ±2 SD was from 6.4% to 20.8% and for BMI, from 19.8 to 33.8 kg/m^2^. In female athletes at +2 SD, the elite zone of BF% was 16.7% to 27.9% and for the BMI of 18.4 it was 25.2 kg/m^2^. With the doubly indirect methods, the elite zone of BF% in male athletes (±2 SD) was from 3.3% to 24.1% and for BMI, from 19.5 to 28.3 kg/m^2^.
In female athletes, the elite zone at ±2 SD of BF% was from 13.1% to 30.3% and for BMI, from 19.2 kg/m^2^ to 25.2 kg/m^2^. The elite zone at +2 SD encompassed five morphotypes in male and female athletes of indirect and doubly indirect methods: intermediate slender, intermediate, intermediate solid, lean solid, and lean intermediate. None of the elite athletes were in the lean intermediate quadrant, even though the elite zone encompassed this morphotype.
A description of the different categories of body physique for indirect and doubly indirect methods in elite athletes was made. Applying indirect methods, the predominant body physique in male athletes was intermediate solid (BMI 30.1 ± 3.4; BF% 15.9 ± 2.6; BMI 4.8 ± 1.2; FFMI 25.2 ± 2.5) (Table 7). In female elite athletes assessed with indirect methods, the dominant body physique was lean intermediate (BMI 20.2 ± 0.9; BF% 20.9 ± 1.7; 4.1 ± 0.6; FFMI 16.0 ± 0.7) (Table 7). With the doubly indirect methods, in elite male athletes, the predominant body physique was lean intermediate (BMI 22.2 ± 1.1; BF% 9.8 ± 2.1; BMI 2.1 ± 0.5; FFMI 20.0 ± 1.0) (Table 8). In female elite athletes assessed with doubly indirect methods, the dominant body physique was intermediate (BMI 22.9 ± 0.8; BF% 24.4 ± 2.4; IMG 5.5 ± 0.7; FFMI 17.2 ± 0.5) (Table 8). See Supplemental Figures S3 and S4 for males and females, respectively.
4. Discussion
This study shows that male elite athletes measured using indirect methods predominantly had an intermediate solid body physique. In female elite athletes, the dominant body physique was lean intermediate. Using the doubly indirect methods, male elite athletes had a lean intermediate body physique, whereas female elite athletes had an intermediate body physique.
The variability in indirect and doubly indirect methods to estimate BF% varies between ethnic groups due to differences in subcutaneous fat distribution [140]. Accordingly, this review reported the methods separately. Moreover, the heterogeneity and accuracy of body composition methods may affect the assessment of body physique, mainly due to the limitations of each method, and then affect the classification of athletes in categories according to those described in Table 2.
In a study conducted in young adults, several methods were compared, including hydrostatic weighing, BIE (doubly indirect method), and DXA (indirect method); the last is considered the gold standard. It was observed that hydrostatic weighing (indirect method) showed the highest data in women, overestimating BF% by 2.9%, followed by BIE (doubly indirect method), which overestimates it by 2.7%. Anthropometric equations (doubly indirect method) can show significant variations in BF% ranging between 8.0% and 29.0% in women, and between 6.0% and 29.0% BF in men. Therefore, the choice of any equation must be made with caution, considering its precision and the characteristics of the population to be measured [141].
In the same discipline, in this case ballet, differences in BF% of 6.2% were observed between hydrostatic weighing and DXA (indirect methods) and BIE (doubly indirect method) [59]. Differences have also been found in elite gymnasts when comparing methods such as DXA with anthropometry (doubly indirect method) with a difference of 3.0% [57]. But even between DXA equipment with differences between pencil beam and fan beam, differences of 0.9% were found in Australian football players [46]. These discrepancies underline the importance of considering the methodological error that affects the comparison of results. As has been generally observed, DXA (indirect method) is used as a precise method for evaluating body composition in athletes [12,142,143,144].
Male elite athletes evaluated with indirect methods are mostly classified as intermediate solid, characterized by a high FFMI (25.2 ± 3.0 kg/m^2^), a moderate FMI (4.8 ± 1.2 kg/m^2^), and a mean BF% of 15.9 ± 2.6, classified as “Fair” according to the American College of Sports Medicine [145]. This body physique includes American football players, judokas, water polo players, and rugby players, who require strength and power, although they showed differences depending on the specific demands of each sport. In American football, positions could change according to strength and body mass, while speed and agility are more important in other positions such as linebackers and running backs [146]. In sports such as rugby and water polo, higher aerobic ability is required due to continuous physique activity, while judokas tended to have a low BF% and high muscle mass, which favors their performance [147]. Strength athletes are characterized by high body mass and bone mineral content, with a high BMI and a significant amount of fat mass [42,56,148,149,150,151]. The adipose solid category includes offensive and defensive linemen, who have a large size and high level of strength to absorb impacts [50,152,153] Sumo wrestlers are characterized by their high body mass, fat, and muscle [16,154,155]. Endurance sports, and those divided into weight categories tend to have the lowest BF% values, while in sports where body size is advantageous, there may be higher BF%.
In female elite athletes measured with indirect methods, the main body physique was lean intermediate, its main characteristics were a moderate FFMI (16.0 ± 0.7 kg/m^2^) and a low FMI (4.1 ± 0.6) with a mean BF% of 20.9% ± 1.7, within the “Fair” classification [145]. In this category are ballet dancers, soccer players, field runners, and gymnasts, who, despite their morphological differences, have a lower BMI that highlights their muscle tone. Ballet dancers have a higher BF% and lower muscle mass than gymnasts, but they stand out for their biomechanical and balanced skills. Dancers, field runners [156] and gymnasts [157] face health problems associated with low energy availability and bone mineral density. Female soccer players showed better biomechanical patterns and bone health in general [158,159,160].
Applying the doubly indirect methods, male elite athletes showed a predominantly lean intermediate physique, with a moderate FFMI (20.0 ± 1.0 kg/m^2^), a low FMI (2.1 ± 0.5 kg/m^2^), and a BF% of 9.8 ± 2.2, classified as “Excellent” [145]. This body physique, which emphasizes muscle definition and lean appearance, includes volleyball players, basketball players, boxers, taekwondo athletes, rowers, marathon runners, triathletes, sprinters, gymnasts, sprint swimmers, and other athletes who benefit from a low BF%. These characteristics improve agility, speed, endurance, and ability to change direction rapidly [121,161,162,163,164,165,166]. In the adipose solid body physique, athletes showed a mean FFMI of 28.1 ± 2.2 kg/m^2^, an FMI of 10.8 ± 0.3 kg/m^2^, and a BF% of 27.9 ± 2.1. This group includes heavy-weight powerlifters, where high fat-free mass is crucial to maximize squat, bench press, and deadlift performance [167,168,169]. However, high FMI can negatively affect relative strength [169].
In female elite athletes measured using doubly indirect methods, an intermediate body physique predominated, characterized by a moderate FFMI (17.2 ± 0.5 kg/m^2^) and FMI (5.5 ± 0.7 kg/m^2^) and a BF% of 24.4% ± 2.4 of poor classification [145]. Within this morphotype, open water swimmers benefit from higher BF%, which provides them with buoyancy and reduces water resistance; they tend to be smaller and lighter than competitive pool swimmers, which helps them in their endurance performance [170,171]. Female basketball and tennis players share several physical characteristics, including a lean body composition, high agility, significant aerobic and anaerobic capacity, and strong coordination and movement skills. These attributes are essential for the fast and dynamic movements required in both sports [172,173]. Female kayakers generally have larger body sizes, including higher body mass and height. This larger body size is associated with the specific demands of their sport [174]. There are also softball players, who tend to be taller and have larger biacromial and iliocristal diameters of the femur, as well as a greater femoral bicondylar diameter [175].
Comparing Hattori’s chart [39] with Heath and Carter’s [3] somatotype, the mesomorphic component, which reflects musculoskeletal robustness [176], is related in Hattori’s chart to the lean solid body physique. Ectomorphy corresponds to lean slender, and endomorphy to adipose intermediate. Studies in elite athletes [177] showed similarities between mesomorphy and the categories of Hattori’s chart. While somatotype focuses on a single component, Hattori’s chart classifies mesomorphic into four types, providing a more precise evaluation. However, few studies categorized body physique in elite or recreational athletes using the categories proposed by Hattori [6,39,178]. Among the studies published using this methodology, most of them focused on high or low FMI or FFMI [16,17,18,19,20,21,22,23]. In summary, the Hattori chart is useful for classifying body physique and monitoring changes in body composition, offering comparative references. However, it is suggested that further studies be conducted across disciplines and among elite female athletes.
In this study, the elite zone was identified in male athletes using indirect methods with BF% between 6.4% and 20.8% and BMI from 19.8 kg/m^2^ to 33.8 kg/m^2^. In female elite athletes, the range was 16.7% to 27.9% for BF% and 18.4 kg/m^2^ to 25.2 kg/m^2^ for BMI. For the doubly indirect methods, the male elite zone was established with a BF% of 3.3% to 24.1% and a BMI of 19.5 kg/m^2^ to 28.3 kg/m^2^, while in women it was from 13.1% to 30.3% for BF% and from 19.2 kg/m^2^ to 25.2 kg/m^2^ for BMI. The morphotypes analyzed at ±2 SD included categories such as adipose solid, intermediate slender, intermediate, and intermediate solid, and lean slender, lean intermediate, and lean solid.
It was observed that SDs reflect variations in the athletes’ body physique, depending on the sport, and even the position or category within the same discipline. For example, gymnasts fall into the lean category, while sumo wrestlers and football linemen fall into the adipose solid category. These variations optimize sports performance according to the specific demands of the sport, such as judo, boxing, or rowing, where body composition directly influences performance [177].
To our knowledge, only one study differentiated the elite zone into categories for sumo wrestlers compared to the general population [16]. Identifying the elite zone could facilitate the monitoring of athletes in the different disciplines. The elite zone is a universal phenomenon experienced by almost all elite athletes, and it has been described as the pinnacle of achievement for an athlete and characterizes a state in which an athlete performs to the best of his or her ability [175,176]. The ±1 SD (±2 SD) zone would help identify differences between sports and optimize body composition to improve training cycles and sports performance or take advantage of biomechanical advantages, obtaining the highest performance in each sport discipline.
Identifying the elite zone (BMI ± 2 SD and BF% ± 2 SD) offers sport scientists a reference for monitoring athletes’ morphological changes throughout a training cycle. Athletes whose values fall outside this zone can be evaluated to determine whether the deviation reflects desired adaptations (e.g., increases in muscle mass) or potential issues such as excessive fat gain, low energy availability, or loss of lean mass. The elite zone can guide nutritional planning, training adjustments, and return-to-play decisions. In weight-category or aesthetic sports, the ±1 SD range may help identify when an athlete is approaching thresholds associated with increased injury risk or reduced energy availability, while the ±2 SD boundaries can serve as upper and lower limits beyond which performance may be compromised.
Strengths and Limitations of the Study
The main novelty of this study lies in the breadth of the review or in the comprehensive identification of the “elite zone” across a wider spectrum of sports and genders. Frisancho’s [38] cut-off points for ages 20 to 29.9 years were chosen due to the average age of the athletes evaluated. Although this reference is used as a growth curve because it is derived from the US NHANES surveys, it cannot adequately represent the body size and composition of athletes or all ethnicities. Elite athletes generally have lower body fat percentages compared to the general population, with significant variations by sport. However, this reference can be used as a basis to allow comparison of studies in which variables such as somatotype are used.
Furthermore, each method of estimating body composition has limitations that can influence the classification of athletes. Hydrostatic weighing (indirect method) appears to be unsuitable for athletes who focus on strength due to its demanding technique, and DXA (indirect method) has variations in manufacturers’ algorithms and differences between pencil and fan beams [174]. BIA (doubly indirect method) can be affected by factors such as limb length and hydration [179]. Ultrasound (doubly indirect method), although useful, requires considerable skill and is not standardized [174]. ADP and anthropometry (doubly indirect method) also have limitations in their accuracy. Anthropometry (doubly indirect method) is less precise than DXA (indirect method) and requires specific equations to avoid significant errors in athletes [174,180]. Although the aforementioned methods such as hydrostatic weighing, ADP, and DXA (both indirect methods) are considered reference methods for evaluating body composition in athletes, they are not widely accessible in most evaluation centers. Another limitation is that indirect methods (e.g., DXA) have higher precision than those that are doubly indirect (e.g., BIA).
Regarding anthropometric equations, the algorithm most used to predict BF% in elite athletes was previously proposed [63,124]. Although it does not specifically include athletes, its popularity is broad. Many of the equations reported by the studies are not generalizable to all athletes, since they are not a main part of the sample or are only specific to certain disciplines. Each equation is specific to the population studied, and the structure, body composition, and exercise habits of the population from which they are derived.
5. Conclusions
Body physique measured with indirect methods was intermediate solid in male elite athletes, and lean intermediate in elite female athletes. Body physique measured using doubly indirect methods was lean intermediate in male elite athletes, and intermediate in female elite athletes. Hattori’s chart facilitates the visualization of changes in body mass index, fat-free mass index, fat mass index and percentage of body fat, helping personalize training, monitor composition changes, and guide nutrition programs to optimize performance and health. Future research could apply Hattori’s method to differentiate athletes’ body composition by category, specialty, position, and training period.
The reference list from the paper itself. Each links out to its DOI / PubMed record.
- 1Boileau R.A. Lohman T.G. The Measurement of Human Physique and Its Effect on Physical Performance Orthop. Clin. N. Am.1977856310.1016/S 0030-5898(20)30677-5887247 · doi ↗ · pubmed ↗
- 2Slaughter M. Christ C. The role of body physique assessment in sport science Body Composition Techniques in Health and Disease, Society for the Study of Human Biology Symposium Series, Symposium 36 Davies P. Cole T. Cambridge University Press Cambridge, UK 1995166195
- 3Heath B. Carter L. A modified somatotype method Am. J. Phys. Anthropol.196727577410.1002/ajpa.13302701086049820 · doi ↗ · pubmed ↗
- 4Katch F.I. Behnke A.R. Katch V.L. The Ponderal Somatogram: Evaluation of Body Size and Shape from Anthropometric Girths and Stature Human 1987594394583610119 · pubmed ↗
- 5Ross W.D. Wilson N.C. A stratagem for proportional growth assessment Acta Paediat. Belg.1974281691824446980 · pubmed ↗
- 6Hattori K. Body Composition and Lean Body Mass Index for Japanese College Students J. Anthropol. Soc. Nippon.19919914114810.1537/ase 1911.99.141 · doi ↗
- 7Tóth T. MichalíkováM. BednarčíkováL. Živčák J. Kneppo P. Somatotypes in sport Acta Mech. Automat.20148273210.2478/ama-2014-0005 · doi ↗
- 8Stuempfle K.J. Drury D.G. Petrie D.F. Katch F.I. Ponderal Somatograms Assess Changes in Anthropometric Measurements Over an Academic Year in Division III Collegiate Football Players J. Strength Cond. Res.2007216896961768568710.1519/R-19565.1 · doi ↗ · pubmed ↗