Spatiotemporal dynamics of age-related genes and the regulatory network of LaAGL2-3 in Larix kaempferi (Lamb.) Carr. based on the latest genome annotation
Tang-Quan Liao, Ao-Jie Luo, Zha-Long Ye, Wanfeng Li

TL;DR
This study explores how age-related genes and the LaAGL2-3 gene regulate development and aging in the Larix kaempferi tree.
Contribution
The study identifies 307 age-related genes and reveals the regulatory role of LaAGL2-3 in conifer ontogeny.
Findings
307 age-related genes were identified and grouped into two expression clusters with opposing temporal trends.
LaAGL2-3 directly regulates six genes, including itself and cycloartenol synthase, through promoter binding.
Over-expression of LaAGL2-3 in Arabidopsis accelerates life cycle progression, indicating its role in aging processes.
Abstract
In plants, time information is recorded in strictly ordered sequences of development events, resulting in age-associated physiological and morphological differentiation, including clear spatial gradients from the base to the crown within a single tree. However, the molecular mechanisms driving such ontogeny-related differentiation remain largely unknown. Based on our newly generated Larix kaempferi (Lamb.) Carr. genome annotation, we identified 307 age-related genes, which were grouped into two expression clusters reflecting opposite temporal trends. Spatial expression analysis further revealed 13 differentially expressed genes along the vertical axis of the tree, suggesting their roles in regulating spatially distinct physiological traits. Yeast one-hybrid and dual-luciferase reporter assays demonstrated that LaAGL2-3b directly binds to the promoters of six genes, including LaAGL2-3a,…
Genes, proteins, chemicals, diseases, species, mutations and cell lines named across the full text — each resolved to its canonical identifier and authoritative record.
Click any figure to enlarge with its caption.
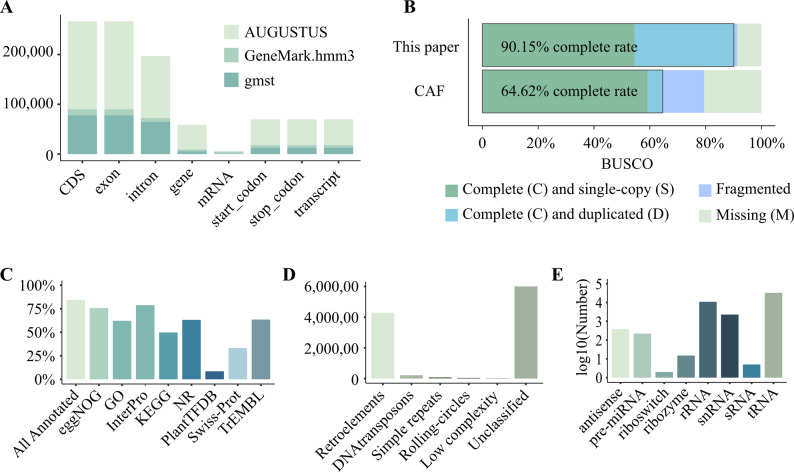 Figure 1
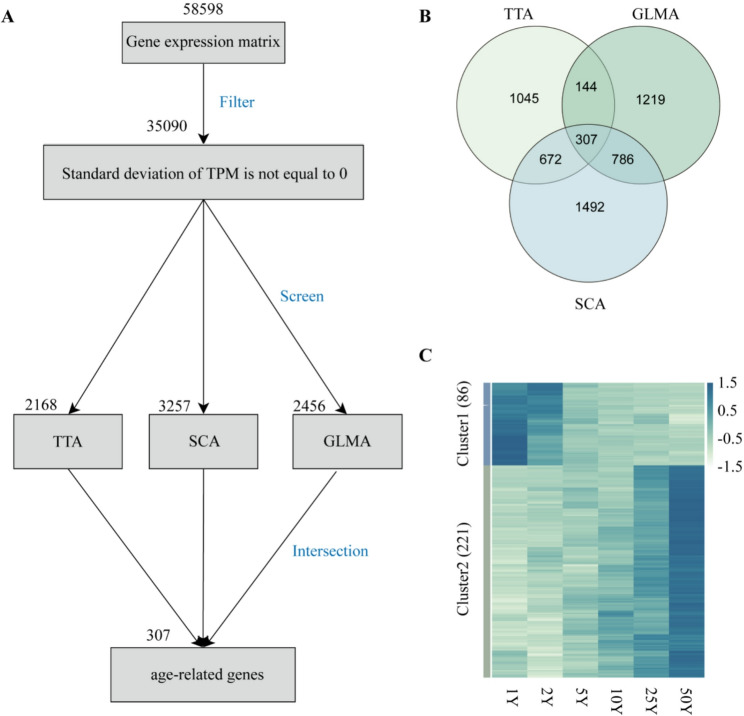 Figure 2
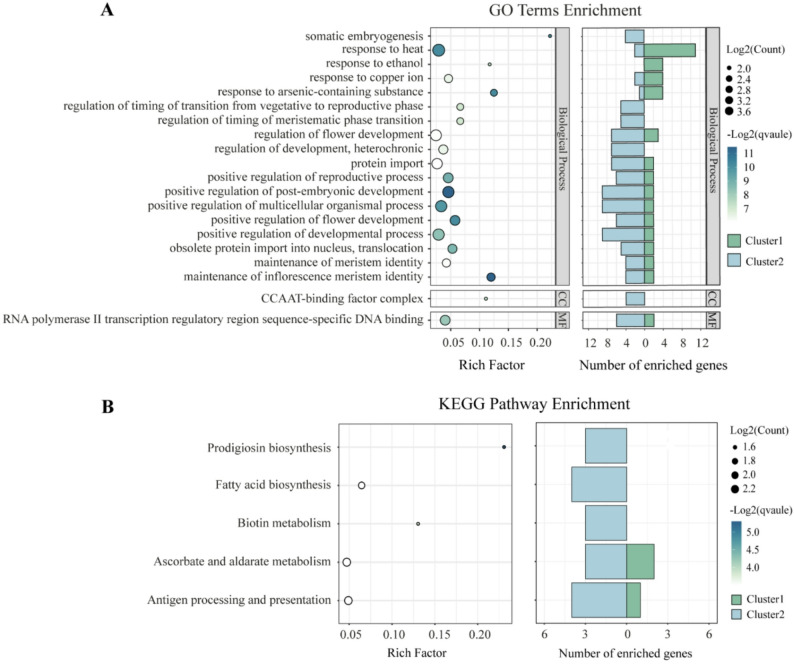 Figure 3
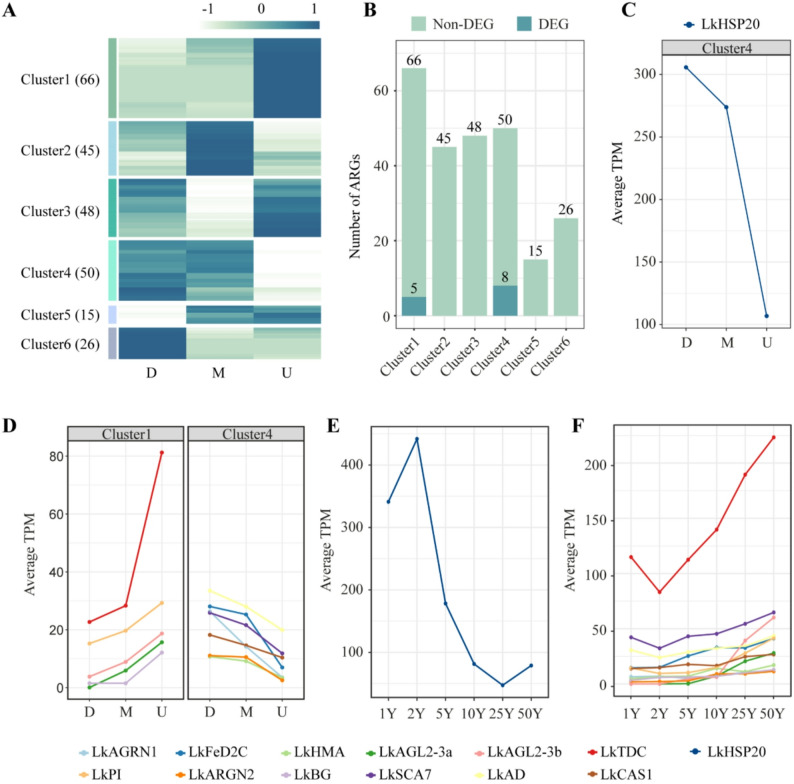 Figure 4
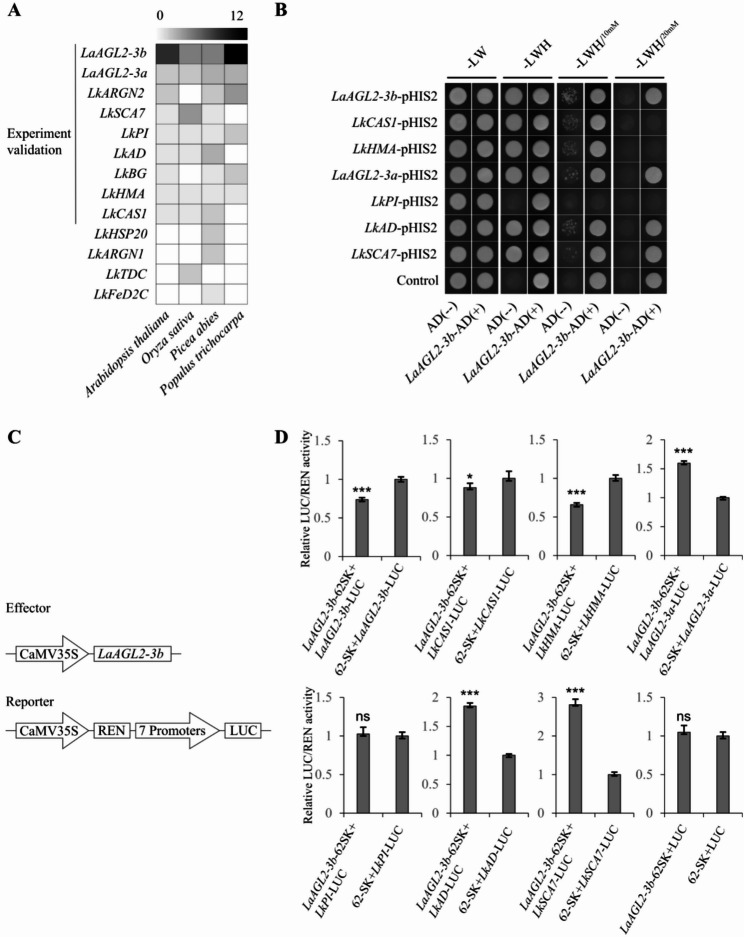 Figure 5
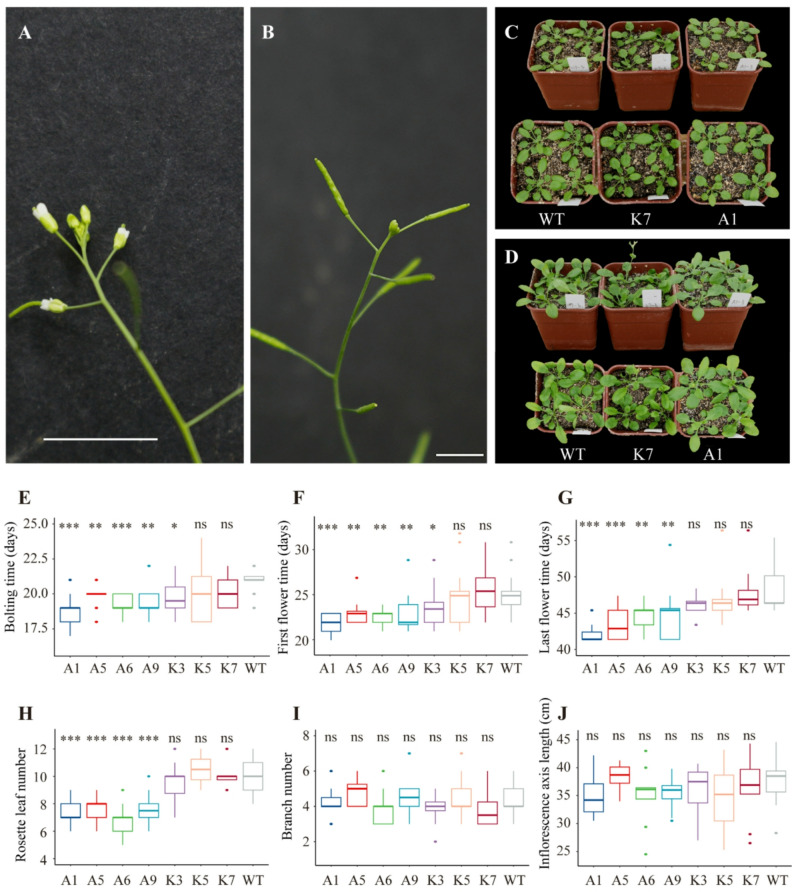 Figure 6
- —Biological Breeding-Major Projects
- —National Natural Science Foundation of China
Peer Reviews
No public reviews on file for this paper yet. If you reviewed it on a platform where reviews are public (OpenReview, ICLR, NeurIPS, ICML), you can paste yours below so the community can read it here.
Videos
No videos yet. Explain this paper in a talk, walkthrough, or lecture? Add one.
Taxonomy
TopicsPlant Molecular Biology Research · Plant Reproductive Biology · Photosynthetic Processes and Mechanisms
Background
In the life cycle of plants, development events occur in a strict sequence. A seedling starts vegetative growth after seed germination and then enters the reproductive phase, in which it can flower and produce seeds. For Larix kaempferi (Lamb.) Carr., about 10 years is required for one life cycle to finish, whereas 20 years is needed for Picea abies (L.) H. Karst. In this dynamic occurrence of life cycle events, time information is recorded and kept, resulting in variant age-dependent physiological characteristics. For example, juvenile seedlings often exhibit faster growth rates and extended growth periods compared to mature trees [1, 2]. Meanwhile, as trees grow, they exhibit an age gradient from the base to the crown, resulting in distinct and spatially distributed phenotypic and physiological traits, including wood properties, leaf morphology, protein identity, and regeneration capacity of vegetative propagation [3–7]. Despite these well-documented observations, the molecular mechanisms underlying these age-related differences in trees and their interconnections across temporal and spatial dimensions remain poorly elucidated.
A growing body of research has identified numerous genes that regulate plant aging, with distinct roles in promoting or delaying developmental transitions. Genes such as Suppressor of Overexpression of Constans 1 (SOC1) [8], APETALA1 (AP1) [9], Squamosa-Promoter Binding Protein-Like (SPL) [10, 11], and DAL1 (a MADS-box gene) [12] drive maturation, while microRNAs such as miR156 [13] and miR171 [14] and genes like TERMINAL FLOWER1 (MdTFL1 and MdTFL1a) [15], Juvenile-to-Adult transition (JAT) [16] and LaAP2L1 (a heterosis-associated AP2/EREBP transcription factor from Larix) [17] maintain juvenility or delay maturation. Some of these genes have been proposed as molecular markers for assessing plant aging states, which allows us to determine the age status of trees in practice. For instance, miR156 serves as a marker of juvenility [13, 18], while DAL1 and SOC1 may reflect broader life-cycle stages [7, 19, 20]. In slash pine (Pinus elliottii × caribaea), the age-marking genes, including PtAP2L3, PtDAL10 and PtMADS28, have been successfully used to elucidate the spatial patterns of ontogenetic ageing [21]. Although these discoveries have been well-documented in developmental transitions, little is known about how these age-related genes regulate phenotypic and physiological variations in space.
Previously, a comparative transcriptomic analysis was performed in L. kaempferi to reveal the molecular basis of age-dependent development processes. Twenty-seven age-related transcription factors differentially expressed between the juvenile vegetative phase and the adult reproductive phase were identified through transcript assembly [22]. Among them, LaDAL1, a MADS-box transcription factor and a homolog of Arabidopsis thaliana (L.) Heynh. AGL6, was found to coordinate with age and environmental signals in the life cycle of L. kaempferi and to accelerate the life cycle progression of A. thaliana by promoting the transitions of meristem fate [19, 20]. Furthermore, the genome assembly of L. kaempferi was revealed [23, 24], providing a genome reference for easier and more precise investigations of conifer trees’ biological function compared to transcript assembly. So far, various studies have investigated the age-dependent expression patterns and functions of age-related transcription factors. However, further research of the underlying regulatory mechanism and function of other potential age-related genes is still needed, especially when working with the reference genome.
Here, we identified age-related genes from previous age-series samples [25] using our new structure annotation of the latest genome of L. kaempferi, analyzed their potential functions and investigated their spatial expression patterns using our new spatial samples. Then, we screened out 13 differentially expressed age-related genes in spatial dimensions, including the MADS-box transcription factor LaAGL2-3b, which was identified as an age-related gene in our previous study [7]. Further, yeast one-hybrid (Y1H) and dual-luciferase reporter (DLR) assays confirmed direct regulatory relationships between LaAGL2-3b and six other genes. Additionally, over-expression of LaAGL2-3 accelerated development transitions in A. thaliana, suggesting that it may play a role in regulating life cycle progression. These findings expand the range and function of multidimensional age-related genes in L. kaempferi and provide new targets for promoting vegetative transitions, offering theoretical support for studying the mechanism of age-dependent phenotypic and physiological variations in plants.
Methods
Sample preparation and sequencing
Age-series samples were collected and sequenced in our previous study [25]. In July 2011, we harvested the current-year uppermost main stems, the newly formed terminal shoot of the main stem produced during the current growing season, from L. kaempferi trees aged 1, 2, 5, 10, 25, and 50 years. All needles and branches were removed from each stem. For every age group, stems from at least three individual trees with comparable vigor were collected and pooled to generate one representative sample.
To examine vertical variation, spatial (height-gradient) samples were collected from the same three 25-year-old trees as those listed above and sequenced in the present study. After each tree was felled and the current-year uppermost main stem was sampled as an age-series sample, the left main stem was divided into three sections corresponding to (1) the lower part (D): approximately 0.40 m above ground; (2) the middle part (M): approximately 8.93 m above ground; and (3) the upper part (U): approximately 17.85 m above ground. At each of the three height positions, a 10–15 cm trunk segment was cut for sampling, resulting in three biological replicates per height. For each segment, the bark was removed and tissues for RNA extraction were collected by scraping the surface of the xylem with a sterile scalpel.
All collected samples were immediately frozen in liquid nitrogen and stored at − 80 °C until RNA extraction. RNA extraction, cDNA library construction, and Illumina sequencing followed the same standardized protocols as those described in our previous work [26].
The trees were planted in the State-owned Dagujia Forestry Farm (42°22′ N, 124°51′ E) in Qingyuan Man Autonomous County, Liaoning Province, Northeast China. The species L. kaempferi is widely cultivated in this farm, and its identity was confirmed based on morphological characteristics and local forestry records by Yue Wang and Yudong Ren, staff members of the State-owned Dagujia Forestry Farm.
Genome structure annotation
The recently published genome assembly of L. kaempferi (NCBI GenBank accession number: GCA_027924585.1) [24], with a total size of 13.5 Gb (Table S1), was used for structure annotation.
We first used RepeatModeler v2.0.5 to generate a de novo repeat library for the genome, integrating TRF, RepeatScout, and RECON [27–29] with default settings. The resulting custom repeat library was then supplied to RepeatMasker v4.1.6, which was run with default parameters to annotate and mask repetitive elements, including retrotransposons, DNA transposons, and tandem repeats. The repeat-masked genome produced by this step was subsequently used as the input for downstream gene prediction.
Structural annotation was performed using BRAKER3 [30–33], a fully automated pipeline that integrates de novo prediction, protein homology, and transcriptome evidence (Figure S1). In this step, three data sources were provided as the input of BRAKER3: (1) the repeat-masked genome assembly, (2) the RNA-seq datasets generated in our lab, and (3) a combined protein database derived from previously published predictions [23, 34]. BRAKER3 was run in RNA-seq + protein data mode using default parameters.
Briefly, RNA-seq reads were aligned to the genome using HISAT2 [35] and assembled with StringTie2 [36]. The resulting transcripts were used for initial gene prediction with GeneMarkS-T [37], followed by homology-based refinement using ProtHint [32]. BRAKER3 iteratively combined these data to train GeneMark-ETP and AUGUSTUS [38–40], and the final gene models were selected using TSEBRA [41]. After structural annotation, we assessed the completeness of our genome annotation using the BUSCO (Benchmarking Universal Single-Copy Orthologs; http://busco.ezlab.org/) [42] v6.0.0 pipeline with the 1,614 embryophyte_odb10 BUSCO genes as the reference.
Non-coding RNA, a kind of RNA with various known functions, including microRNA (miRNA), ribosomal RNA (rRNA), transfer RNA (tRNA), and other RNA families, was predicted using Infernal v1.1.5 [43] with Rfam database v14.10 [44] under default parameters. All predicted non-coding RNA features were converted to GFF3 format for downstream analysis.
The predicted genes were functionally annotated using the BLAST toolkit against seven databases: NR (NCBI nonredundant protein sequences), UniProt (the Universal Protein knowledgebase), Pfam (Protein family), GO (Gene Ontology), KEGG (Kyoto Encyclopedia of Genes and Genomes), eggNOG (Evolutionary Genealogy of Genes: Non-supervised Orthologous Groups) and PlantTFDB (Plant Transcription Factor Database). The searching parameters were “--evalue 1e-5 --max-target-seqs 1 –sensitive”.
Transcriptome quantification
To generate a gene expression matrix, a reference-guided transcriptomic workflow was implemented. Raw sequencing reads were first processed using fastp v0.23.4 [45] to remove adapters, low-quality bases, and ambiguous reads. Cleaned reads were then aligned to the L. kaempferi reference genome [24] using HISAT2 v2.2.1 [35]. Alignment statistics were assessed using SAMtools v1.13 [46]. Gene-level quantification was performed with featureCounts v2.0.6 [47] using our newly generated structural genome annotation. Transcript abundance was normalized using the TPM (Transcripts Per Million) method to allow cross-sample comparison. All steps above were compiled into a workflow using Snakemake [48] for reproducibility and pipeline efficiency [49].
Identification of age-related genes
To identify age-related genes, we assumed that gene expression patterns change systematically over growth time. Three complementary statistical methods were applied to screen candidate genes: time trend analysis (TTA), Spearman correlation analysis (SCA), and generalized linear modeling analysis (GLMA).
First, TTA was performed using the Mfuzz R package to identify genes exhibiting consistent temporal expression trends across the age gradient. Second, SCA was conducted to assess the monotonic association between gene expression and sample age (Table S2), with significance determined at p < 0.05. Third, GLMA was applied using the limma package with a linear time-series design, identifying genes with age-associated expression dynamics at a liberal threshold of p < 0.5.
Only genes that passed all three methods were retained as robust age-related candidates. This intersection approach was used to determine final age-related genes. All analyses were conducted using R v4.3.2.
Functional enrichment analysis (GO and KEGG)
GO and KEGG enrichment analyses were performed to investigate the functional categories and pathways associated with age-related genes. Both analyses were conducted using the ClusterProfiler R package v4.10.0 [50] with default parameters.
Spatial expression analysis of age-related genes
To assess the spatial expression patterns of age-related genes, expression data were extracted from height-gradient (D–M–U) samples. Genes with zero or highly unstable expression levels were excluded, based on the following criteria: TPM standard deviation > 50 within sample groups or TPM = 0 across all samples. The genes that passed this filtering step were subjected to hierarchical clustering using the ward.D2 method to group genes with similar spatial expression patterns. Differential expression analysis was performed using edgeR v4.0.16 [51]. Pairwise comparisons between stem segments (“D vs. M” and “M vs. U”) were used to identify differentially expressed genes (DEGs), with thresholds set at p < 0.05 and |log₂FC| > 0.5. Only genes that were differentially expressed in at least one of the two comparisons were considered for further analysis.
Cloning of full-length cDNAs and promoter regions
Branches from 29-year-old L. kaempferi trees were collected in February 2023 for RNA extraction. Lateral branches located on the uppermost portion of the main stem were selected. After removing all buds, the remaining stems were used. Each branch segment was 14 cm in length. The trees were planted in the State-owned Dagujia Forestry Farm. Total RNA was extracted using the EasyPure^®^ Universal Plant Total RNA Kit (ER302-01, TransGen Biotech, Beijing, China), following the manufacturer’s instruction. First-strand cDNA synthesis was performed with 2.0 µg of total RNA using the TransScriptOne-Step gDNA Removal and cDNA Synthesis SuperMix (AH311-03, TransGen Biotech). The resulting cDNA was diluted and used as a template for cloning. Gene-specific primers were designed based on transcript sequences from the genome annotation (Table S3) to amplify full-length cDNAs. PCR products were purified with the EasyPure^®^ Quick Gel Extraction Kit (EG101-02, TransGen Biotech), ligated into the pEASY^®^-T1 cloning vector (CB501-02, TransGen Biotech), and verified by Sanger sequencing.
Genomic DNA was extracted from the same branches using the Hi-DNAsecure Plant Kit (DP350-03, TIANGEN Biotech, China). Promoter sequences (2,000 bp upstream of the start codon) were obtained from the genome annotation. Specific primers were designed for promoter amplification (Table S3), and PCR products were purified and cloned using the same methods as described for cDNA cloning.
Promoter binding site prediction
Promoter sequences of the selected age-related genes were submitted to the PlantRegMap database [52] to predict potential transcription factor binding sites. Predictions were based on known transcription factor binding motifs from four model species: A. thaliana, Oryza sativa subsp. japonica, P. abies and Populus trichocarpa Torr. & A.Gray ex Hook.
Yeast one-hybrid assay for promoter–transcription factor (TF) interactions
Coding sequences of candidate transcription factors were amplified by PCR and cloned into the pGADT7 vector to generate prey constructs (pGADT7–TF) [53] (Table S3). Promoter fragments of target genes were amplified and inserted into the pHIS2 vector to generate bait constructs (pHIS2–promoter) [53] (Table S3).
Prey and bait plasmids were co-transformed into Saccharomyces cerevisiae strain Y187 using the lithium acetate method [53]. Transformants were first selected on SD/–Leu/–Trp medium and incubated for 3–5 days. Positive clones were then transferred to SD/–Leu/–Trp/–His medium supplemented with 30, 40, or 50 mM 3-amino-1,2,4-triazole (3-AT) to assess promoter–TF interactions. Protein–DNA binding was inferred from yeast colony growth under selective conditions.
Dual-luciferase reporter assay in larch callus
Full-length coding sequences of transcription factors were cloned into the pGreenII 62-SK vector to generate effector constructs (Table S3). Promoter sequences of the target genes were inserted into the pGreenII 0800-LUC vector to generate reporter constructs (Table S3). All constructs were introduced into Agrobacterium tumefaciens strain GV3101 [53].
A. tumefaciens cultures carrying effector and reporter plasmids were co-infiltrated into L. kaempferi callus tissues [54]. After incubation, firefly luciferase (LUC) and Renilla luciferase (REN) activities were measured using the Dual-Luciferase^®^ Reporter Assay System (Promega, USA). Promoter activity was represented by the LUC/REN ratio. For each effector–reporter combination, measurements were obtained from at least three independent biological replicates.
Functional validation in transgenic A. thaliana
Seeds of A. thaliana ecotype Columbia-0 (Col-0) were surface-sterilized with 0.9% NaClO solution and germinated on half-strength Murashige and Skoog (½ MS) medium. After stratification at 4 °C for three days, seedlings were grown under a 16 h light/8 h dark photoperiod at 22 °C and 60% relative humidity. When seedlings developed 2–3 true leaves, they were transplanted into pots containing a 1:1 mixture of nutrient soil and vermiculite.
The full-length coding sequence of LaAGL2-3b was cloned into the pK2FMCS7 binary vector under control of the CaMV 35 S promoter, generating the construct 35 S::LaAGL2-3b. Transformation was carried out using the floral dip method with A. tumefaciens strain GV3101. Transgenic lines were selected on kanamycin-containing (50 mg/L) LB agar plates. Homozygous T3 plants were verified by PCR and used for phenotypic analysis.
Phenotypic traits assessed included bolting time, first flowering time, the time of formation of the last flower in the principal inflorescence axis, the number of rosette leaves and branches, and the length of the inflorescence axis. Measurements were performed on at least 10 independent plants per line. The Wilcoxon test was used to determine whether there was a significant difference between wild-type and other groups. All statistical analyses and visualizations were conducted using the tidyverse package in R.
Results
Annotation of genome structure and gene function
Genome structural annotation of L. kaempferi predicted five major genomic features using three complementary strategies: de novo prediction, protein homology, and transcriptome-based approaches. A total of 58,598 genes were annotated, along with 266,712 exons, 196,906 introns, 5,276 mRNAs, and 69,806 transcripts. Although the average intron length was 8,014 bp, the total intron length was the second longest among all annotated elements (Table 1; Table S4; Fig. 1A).
Table 1. The statistical results of genome structure annotation of Larix KaempferiStructure typeNumberTotal length (bp)Average length (bp)exon266,71267,422,498253gene58,5981,138,916,60019,436intron196,9061,577,934,8548,014mRNA5,27610,003,2321,896transcript69,8061,645,357,35223,570Notes: Structural annotation was performed using BRAKER3 with 3 strategies: de novo prediction, protein homology, and transcriptome evidence. The number of each structure type isthe sum of the results from three prediction tools: AUGUSTUS, GeneMark.hmm3 and gmst Fig. 1. Structure and function annotations of Larix kaempferi genome. A: The number of features predicted in L. kaempferi genome. The y axis represents the number of features predicted in structure annotation. B: The comparison of BUSCO (The benchmarking sets of universal single-copy orthologs) assessment results between the structure annotation in the studies of this paper and Chinese Academy of Forestry (CAF) (Sun et al. 2022). The completeness of the structure annotation in this paper was 90.15%, much higher than that of CAF (64.62%). C: The percentage of annotated genes in each database. 84.5% of all genes were functionally annotated based on sequences similarity to at least one public database. D: The total length of recognized repetitive sequences. Length is presented in kbp. E: The number of annotated non-coding RNA. The number was transformed with log10 function
Assessment of annotation completeness using BUSCO (protein mode) revealed a high completeness rate of 90.15% (Table S5; Fig. 1B), exceeding that of the previous CAF genome version [23] and indicating a more accurate and comprehensive gene model set.
Of all annotated genes, 49,513 (84.5%) were functionally assigned based on sequence similarity to at least one public database. The highest annotation coverage was from InterPro (46,164 genes, 78.78%), while Swiss-Prot annotated the fewest genes (19,499 genes, 33.28%). Additionally, 4,973 (8.49%) genes were identified as transcription factors using the PlantTFDB database (Table 2; Fig. 1C).
Table 2. The statistical results of functional annotation of Larix Kaempferi genomePublic databaseNumber of annotated genesPercentageGO Annotation36,43062.17%KEGG Annotation29,14549.74%eggNOG Annotation44,37675.73%NR Annotation37,00763.15%InterPro Annotation46,16478.78%Swiss-Prot Annotation19,49933.28%TrEMBL Annotation37,19563.47%PlantTFDB Annotation4,9738.49%All Annotated Genes49,51384.50%Notes: Functional annotation was implemented using the BLAST toolkit against seven databases (Swiss-Prot and TrEMBL belong to UniProt database) and the most similar sequence annotation was maintained
Repeat annotation showed that 78.96% (10.65 Gb) of the L. kaempferi genome consists of repetitive sequences. Among these sequences, retrotransposons accounted for 31.78%, including 28.31% long terminal repeat (LTR) elements and 14.79% Gypsy/DIRS1 elements. DNA transposons and tandem repeats made up 1.59% and 0.68%, respectively. Notably, 44.50% of repeats were unclassified, representing the single largest category (Table S6; Fig. 1D).
Non-coding RNA annotation identified 220 miRNA precursors (pre-miRNAs), 10,812 rRNAs, and 32,206 tRNAs, with average lengths of 117 bp, 1,162 bp, and 74 bp, respectively. Additionally, small nuclear RNAs (snRNAs) and antisense RNAs were also annotated, both showing substantial abundance (Table S7; Fig. 1E).
Identification and functional enrichment of age-related genes
A total of 28.5 Gb of raw RNA-seq data were obtained from 16 samples. After quality control, 311,541,568 clean reads were retained, with mapping rates to the reference genome ranging from 89.70% to 94.78% (average 92.86%) (Table S8). Based on our novel genome annotation, 58,598 genes were used for downstream analysis. All RNA-seq datasets have been deposited in the CNCB GSA database (Table S8).
To identify age-related genes, we applied three independent methods. First, TTA identified 2,168 genes with consistent temporal expression patterns. Second, SCA identified 3,257 genes whose expression levels significantly correlated with sample age (Table S2). Third, GLMA identified 2,456 candidate age-related genes using empirical Bayes statistics. The intersection of these three methods yielded 307 high-confidence age-related genes (Fig. 2A-B). Fig. 2. Identification and expression patterns of age-related genes (ARGs). A: Identification flowchart. 58598 genes were annotated from the BRAKER3 pipeline and then quantified in each sample. Among them, 35090 genes met our screen standards and then were analyzed to find genes that have a regular expression pattern over age using time trend analysis (TTA), spearman correlation analysis (SCA) and generalized linear model analysis (GLMA). Finally, 307 genes were identified as ARGs for further study. B: A Venn diagram to show the intersection of the results from TTA, SCA and GLMA. C: Expression patterns of 307 ARGs in age samples. The ARGs could be divided into two clusters, Cluster1 has a decreasing expression trend over age and Cluster2 has an opposing pattern
These genes were clustered into two expression groups: Cluster1 (downregulated with age) and Cluster2 (upregulated with age) (Fig. 2C). Cluster2 contained 221 genes—more than twice the number in Cluster1 (Table S9).
GO enrichment analysis was performed to explore biological functions. Among the 307 genes, 225 were annotated in the GO database. A total of 40 GO terms were significantly enriched, including 36 in the “biological process” category, three in “molecular function”, and one in “cellular component” (Table S10). Notably, the top three (according to the rich factor) enriched terms included “somatic embryogenesis,” “response to arsenic-containing substance,” and “maintenance of inflorescence meristem identity.” Cluster1 genes were predominantly enriched in abiotic stress-related terms, while Cluster2 genes were enriched in developmental functions (Fig. 3A). Fig. 3. Gene Ontology (GO) terms and Kyoto Encyclopedia of Genes and Genomes (KEGG) pathways enrichment of age-related genes (ARGs). A: GO terms enrichment. Only head 20 terms with qvalue < 0.05 were shown here. MF, molecular function; CC, cellular component. The number of ARGs in each enriched GO term was shown here. B: KEGG pathway enrichment. Only pathways with qvalue < 0.2 were shown here. The number of ARGs in each enriched KEGG pathway was shown here
KEGG pathway enrichment revealed five significantly associated pathways. Overall, age-related genes were enriched in “prodigiosin biosynthesis” and “biotin metabolism” (top two enriched pathways according to the rich factor). Cluster-specific enrichment showed that Cluster1 genes were uniquely associated with “ascorbate and aldarate metabolism” and “antigen processing and presentation” (Fig. 3B, Table S11).
Spatiotemporal expression patterns of age-related genes
To investigate spatial variation in the expression of age-related genes, we analyzed RNA-seq data from height-gradient samples collected at three vertical positions—down (D), middle (M), and upper (U)—of 25-year-old L. kaempferi trees. After applying the expression stability filter (TPM = 0 across all samples or TPM SD > 50 within sample groups), 250 of the 307 age-related genes were retained for analysis. Hierarchical clustering using the ward.D2 method grouped these genes into six distinct clusters, designated Cluster1 through Cluster6. Cluster1 (genes highly expressed in the upper stem) contained the largest number of genes (66 genes), while Cluster5 (genes primarily expressed in the middle and upper stem) contained the fewest (15 genes) (Fig. 4A).
Fig. 4. Spatial expression patterns of age-related genes (ARGs). A: Spatial expression patterns of ARGs. 250 fine genes were divided into six clusters, with various expression patterns in space. B: The number of ARGs in each cluster. Only Cluster1 and Cluster4 have ARGs that were differentially expressed in height gradient under a standard of pvalue < 0.05 and |logFC| > 0.5. Two comparison groups, D vs. M and M vs. U, were used to screen out differentially expressed genes (DEGs). C-D: The spatial expression patterns of 13 identified DEGs. Genes with an average TPM (Transcripts Per Million) higher than 100 were drawn alone. E-F: The temporal expression patterns of 13 identified DEGs. Genes with an average TPM higher than 100 were drawn alone
To identify genes showing significant spatial expression differences, we performed differential expression analysis using edgeR for “D vs. M” and “M vs. U” pairwise comparisons. Only genes that were significantly differentially expressed in at least one comparison (p < 0.05, |log₂FC| > 0.5) were retained. This analysis identified 13 differentially expressed genes (DEGs), all belonging to Cluster1 or Cluster4 (Fig. 4B; Table 3).
Table 3. The basic information of differentially expressed age-related genes in height-gradient samplesGene IDGene nameCASCHSTFg12361 LkARGN1 Cluster2Cluster4Falseg15668 LkFeD2C Cluster2Cluster4Falseg20333 LkHSP20 Cluster1Cluster4Falseg22031 LkHMA Cluster2Cluster4Falseg23306 LaAGL2-3a Cluster2Cluster1MIKC_MADSg23308 LaAGL2-3b Cluster2Cluster1MIKC_MADSg25649 LkTDC Cluster2Cluster1Falseg26505 LkPI Cluster2Cluster1Falseg26902 LkARGN2 Cluster2Cluster4Falseg39379 LkBG Cluster2Cluster1Falseg39549 LkSCA7 Cluster2Cluster4Falseg54894 LkAD Cluster2Cluster4Falseg55746 LkCAS1 Cluster2Cluster4FalseNotes: CAS, the cluster id in Fig. 3B, Cluster1 demonstrated a decline in gene expression overage, whereas Cluster2 exhibited an increase. CHS, the cluster id in Fig. 5A. TF, the informationof transcription factors
Among these thirteen DEGs, two were annotated as MIKC-type MADS-box transcription factors (LaAGL2-3a, gene ID: g23306; LaAGL2-3b, gene ID: g23308), suggesting potential regulatory roles in spatial developmental processes. Notably, several genes displayed consistent temporal and spatial expression trends. For example, LkHSP20 (gene ID: g20333), encoding a small heat shock protein, exhibited a high expression level in both young trees and lower stem regions (Fig. 4C, E), suggesting a role in early developmental stages. These 13 DEGs were used for further regulatory and functional characterization.
Regulatory role of LaAGL2-3b in age-related gene networks and developmental progression To explore potential regulatory relationships among these 13 differentially expressed age-related genes, promoter binding site analysis was performed. All 13 genes were predicted to contain MADS-box transcription factor binding sites (Fig. 5A), but only genes that were predicted to be bound in at least three species were selected for experiment validation. LaAGL2-3a and LaAGL2-3b, both MIKC-type MADS-box genes located on the same genomic scaffold, showed high similarity in primary structural and predicted tertiary structural levels (Figure S2). However, only LaAGL2-3b was successfully cloned.
Fig. 5. Analysis of interactions between LaAGL2-3b and other seven genes. A: Promoter binding site prediction. 13 age-related genes were submitted to predict potential transcription factor binding sites and the number of potential MADS-box transcription factor binding sites were presented here. We selected nine high confident genes (predicted to be bound in at least three species) for further experiment validation B: Yeast one-hybrid (Y1H) assay results. Y1H confirmed that L. kaempferi AGAMOUS*-Like (LaAGL2-3b)* directly binds to the promoters of seven genes: LaAGL2-3a, LaAGL2-3b (self-regulation), L. kaempferi cycloartenol synthase (LkCAS1), LkHMA, LkPI, LkAD, and LkSCA7. C: Schematic diagrams of the effector and reporter vector used in dual-luciferase reporter (DLR) assays. D: DLR assay results, which showed that LaAGL2-3b increased the promoter activity of LaAGL2-3a, LkAD and LkSCA7 and decreased the promoter activity of LaAGL2-3b (self-regulation), *LkCAS1 *and LkHMA. Values are the ratio of firefly luciferase (LUC) to Renilla luciferase (REN) activity. Data represents the mean of three biological replications. Error bars represent standard error. Statistical significance was determined using Student’s t-test. *** p ≤ 0.001, ** p ≤ 0.01, * p ≤ 0.05, ns p > 0.05
Using full-length cDNA and promoter sequences, Y1H assays confirmed that LaAGL2-3b directly binds to the promoters of seven genes: LaAGL2-3a, LaAGL2-3b (self-regulation), LkCAS1, LkHMA, LkPI, LkAD, and LkSCA7 (Fig. 5B). DLR assays further confirmed that LaAGL2-3b increased the promoter activity of LaAGL2-3a, LkAD, and LkSCA7 and decreased the promoter activity of LaAGL2-3b (self-regulation), LkCAS1, and LkHMA (Fig. 5C-D). These results support a complex regulatory role for LaAGL2-3b within a spatially coordinated transcriptional network.
To assess the function of LaAGL2-3 in plants, we over-expressed this gene in A. thaliana (Col-0). Transgenic lines exhibited significantly accelerated developmental transitions compared to wild-type lines (Fig. 6A-D). On average, bolting occurred 2 days earlier, first flowering 2.8 days earlier, and final flower formation 5 days earlier; in addition, 2.53 fewer rosette leaves were produced in over-expression lines. However, no differences in the phenotypic indices of branch number and inflorescence axis length were found between over-expression and wild-type lines (Fig. 6E-J).
Fig. 6. Phenotypic indices measured in wild-type (WT), negative control and positive control of Arabidopsis thaliana. Negative control is transgenic lines with plasmid empty vector (pK2FMCS7 empty, K3-K7). Positive control is transgenic lines with recombinant plasmid vector (pK2FMCS7 CaMV35S::LkAGL2-3, A1-A9). The Wilcoxon test was used to determine whether there is a significant difference between WT and other groups. *** p ≤ 0.001, ** p ≤ 0.01, * p ≤ 0.05, ns p > 0.05. At least 10 independent individuals in each line were measured. A: Image of the flower formed at the apex of the principal inflorescence of wild-type A. thaliana after 49 days when they were sown in soil. Bar 1 cm. B: Image of the spherical structure formed at the apex of the principal inflorescence of positive control A. thaliana after 49 days when they were sown in soil. Bar 1 cm. C: Image of wild-type (left), negative control (middle) and positive control (right) A. thaliana after 19 days when they were sown in soil. D: Image of wild-type (left), negative control (middle) and positive control (right) A. thaliana after 22 days when they were sown in soil. E: Bolting time of wild-type, negative control and positive control A. thaliana. F: First flower time of wild-type, negative control and positive control A. thaliana. G: Last flower time of wild-type, negative control and positive control A. thaliana. H: Rosette leaf number of wild-type, negative control and positive control A. thaliana.** I**: Branch number of wild-type, negative control and positive control A. thaliana. J: Inflorescence axis length of wild-type, negative control and positive control A. thaliana.
Altogether, these findings demonstrate that LaAGL2-3b can bind the promoters of several candidate genes and regulate their expressions. Its over-expression in A. thaliana alters developmental timing, suggesting a potential involvement in age-associated transcriptional and biological processes.
Discussion
The availability of a high-quality reference genome and the integration of three complementary analytical approaches in the present study allow us to extend the previous findings [7, 19, 20, 22]. Earlier studies identified age-associated transcription factors mainly through transcriptome assemblies, whereas our genome-guided workflow enables more accurate mapping of reads and improves coding gene discovery and the detection of age-related genes beyond transcription factors. By combining TTA, SCA, and GLMA, rather than relying solely on the analysis of differentially expressed genes, we substantially increased the robustness and confidence of age-related gene identification, providing a more comprehensive and refined view of the molecular landscape underlying L. kaempferi aging.
Genome structure annotation of L. kaempferi facilitates the study of biological function and evolution
The availability of a high-quality reference genome has revolutionized molecular biology and genetics, enabling more accurate gene discovery, evolutionary inference, and functional studies. However, the utility of genomic data critically depends on the accuracy and completeness of its annotation, as erroneous or incomplete annotations can mislead downstream analysis and compromise biological interpretation [55–57].
In this study, we presented an updated structural annotation of the L. kaempferi genome based on the most recent assembly, which demonstrates substantial improvements over the previous CAF version in terms of assembly continuity (reduced contig number and increased contig N50; Table S1). By integrating both publicly available protein datasets and our own large-scale transcriptomic resources, we annotated a higher number of high-confidence protein-coding genes (Table S4). Additionally, we identified a higher proportion of repetitive elements (Table S6), a feature more comparable to the genome of Pinus lambertiana Douglas [58]. Importantly, the completeness of our annotation was validated using BUSCO analysis, which revealed a higher percentage of complete BUSCOs (both single-copy and duplicated) compared to previous versions (Table S5, Fig. 1B). Notably, the elevated rate of duplicated BUSCOs should be interpreted with caution, because gymnosperm genomes typically contain many large gene families that expanded in ancient times, and genuine paralogous copies are frequently under-represented or collapsed in fragmented assemblies [59, 60]. In addition, some duplicated BUSCOs may also result from incomplete removal of alternative haplotypes, a known challenge in assembling large and highly heterozygous conifer genomes [61].
Together, these improvements provide a more accurate and comprehensive genomic framework for L. kaempferi, which will facilitate downstream investigations of gene function, regulatory mechanisms, and evolutionary dynamics in this ecologically and economically important conifer species.
Temporal transcriptomic profiling reveals age-dependent shifts in stress responses and developmental program in L. kaempferi
Tree aging is accompanied by dynamic changes in physiological traits such as abiotic stress responses and reproductive development [62, 63]. Understanding the molecular mechanisms underlying these transitions is essential for improving our knowledge of long-term plant adaptation and informing forest management strategies. In the present study, we analyzed transcriptomic data across an age gradient sample of L. kaempferi using three complementary statistical approaches (Fig. 2B) and identified a set of age-related genes. Functional enrichment analysis suggests that two major expression clusters may represent different biological emphases during tree aging. Genes in Cluster1 (Fig. 2C), which show decreasing expression across the age gradient, are enriched for stress-related GO terms. This pattern implies that stress-responsive processes could be more transcriptionally prominent during the early stages of growth, when young trees experience rapid establishment and may be more sensitive to environmental fluctuations. Conversely, genes in Cluster2 (Fig. 2C), which show increasing expression across the age gradient, are enriched in developmental and biosynthetic categories. Such enrichment is consistent with the notion that, as trees mature, processes related to tissue differentiation, secondary growth, and biomass accumulation gradually become more transcriptionally represented (Fig. 3).
Among the identified age-related genes, two stand out as representative markers of age-dependent physiological transitions: LkHSP20 and LkTDC. LkHSP20 encodes a small heat shock protein, a class of molecular chaperones that help maintain protein homeostasis under stress by refolding denatured proteins [64, 65]. This gene exhibits high expression levels in young trees followed by a consistent decline with age (Fig. 4C, E), a pattern consistent with previous observations in Pinus koraiensis Siebold & Zucc., where 15 heat shock protein genes show peak expression at age 5 and then decrease with age [66]. In contrast, LkTDC, involved in the jasmonic acid signaling pathway and known to function as a suppressor in the upstream of floral organ identity regulatory network in O. sativa [67], shows a similar age-dependent expression with an increasing pattern during tree aging (Fig. 4D, F). Together, these results demonstrate that traits like stress response and reproduction change with age in L. kaempferi, and it is possible to capture these dynamics with gene expression. Future studies focusing on the upstream regulatory pathway and transcriptional regulatory networks of these genes will deepen our understanding of age-mediated stress adaptation and development in conifers.
Spatiotemporal expression and regulatory network of age-related genes reveal the molecular basis of phenotypic and physiological transitions in L. kaempferi
AGAMOUS-like 6 (AGL6) genes encode MIKC-type MADS box transcription factors that have been primarily studied in angiosperms for their roles in floral meristem identity [68]. In A. thaliana and O. sativa,* AGL6* genes function redundantly with other floral homeotic regulators to control meristem fate during flower development [68–71]. In the present study, the L. kaempferi AGL6 homolog, LaAGL2-3b, was identified as an age-related gene through spatiotemporal transcriptomic analysis. Its over-expression in A. thaliana resulted in a significant acceleration in life cycle progression (Fig. 6), supporting the hypothesis that LaAGL2-3b may share conserved functional features with angiosperm AGL6-like genes.
In addition to LaAGL2-3b, we identified two other functionally relevant genes involved in hormonal signaling: LkTDC, associated with the jasmonic acid pathway and known to be a suppressor in the upstream of the regulatory network of AGL6-like genes in floral development [67, 72–74], and LkPI, encoding a peptidyl-prolyl cis-trans isomerase that regulates auxin transport via modulation of ABC transporters [75]. These genes exhibited coordinated age-dependent expression patterns both temporally and spatially (Fig. 4D, F), suggesting that these genes may serve as candidates for exploring molecular signatures of ontogenetic age.
Age-related regulation also extends to traits associated with wood formation. In conifers, xylem development involves the cyclical production of earlywood and latewood, with wood density being a key mechanical trait dependent on their relative proportions [76]. We identified two age-related genes linked to this process: LkHMA, encoding a heavy-metal transporter potentially involved in lignin biosynthesis via copper homeostasis [77–79], and LkFeD2C, a 2-oxoglutarate and Fe(II)-dependent dioxygenase that likely regulates secondary cell wall formation through gibberellin-mediated suppression of DELLA proteins and activation of NAC/MYB transcription factors [80, 81]. These observations raise the possibility that age-dependent transcriptional changes may be associated with vertical variation in wood-related physiological processes.
Strikingly, our Y1H and DLR assays demonstrate that LaAGL2-3b directly binds to the promoters of six age-related genes, including LaAGL2-3a, LaAGL2-3b, LkCAS1, LkHMA, LkAD, and LkSCA7 (Fig. 5), all of which show spatial differential expression patterns (Fig. 4C-F). This suggests that LaAGL2-3 may participate in integrating temporal and spatial expression patterns within age-associated transcriptional networks.
Taken together, our results uncover a regulatory framework in which age-related transcription factors LaAGL2-3 may be positioned upstream of pathways associated with development and wood formation, although the precise regulatory mechanisms remain to be investigated. These insights bridge the gap between molecular aging and observable phenotypes in trees and lay the groundwork for future research on genetic modulation of aging traits in long-lived woody species.
Conclusions
In this study, we generated a new structural annotation of the L. kaempferi genome and integrated it with spatiotemporal transcriptomic analysis to investigate age-dependent developmental variation in L. kaempferi. We identified 307 robust age-related genes, among which 13 showed clear vertical expression gradients within the stem, suggesting their coordinated age-associated transcription patterns across spatial positions. We further showed that LaAGL2-3b, a MIKC-type MADS-box transcription factor, directly binds to the promoters of several of these 13 genes, including LaAGL2-3a, LaAGL2-3b, LkCAS1, LkHMA, LkAD, and LkSCA7, and regulates their expression. Over-expression of LaAGL2-3 in A. thaliana altered developmental timing, supporting a potential involvement of this gene in developmental regulatory processes. Collectively, these findings provide a set of age-related genes and functional hypotheses for understanding transcriptional programs associated with aging in L. kaempferi, along with valuable genomic and transcriptomic resources for future functional and developmental studies in conifers.
Supplementary Information
Supplementary Material 1: Figure S1-S2.
Supplementary Material 2: Table S1-S11.
Supplementary Material 3: The structure annotation of *Larix kaempferi *genome.
The reference list from the paper itself. Each links out to its DOI / PubMed record.
- 1Price AL, Jones NC, Pevzner PA. De novo identification of repeat families in large genomes. Bioinformatics 2005, 21 Suppl 1(suppl_1):i 351–358 10.1093/bioinformatics/bti 101810.1093/bioinformatics/bti 101815961478 · doi ↗ · pubmed ↗
- 2Gabriel L, Bruna T, Hoff KJ, Ebel M, Lomsadze A, Borodovsky M, Stanke M. BRAKER 3: fully automated genome annotation using RNA-seq and protein evidence with Gene Mark-ETP, AUGUSTUS and TSEBRA. Bio Rxiv 2024:2023.2026.2010.544449 10.1101/2023.06.10.54444910.1101/gr.278090.123PMC 1121630838866550 · doi ↗ · pubmed ↗
- 3Danecek P, Bonfield JK, Liddle J, Marshall J, Ohan V, Pollard MO, Whitwham A, Keane T, Mc Carthy SA, Davies RM et al. Twelve years of SA Mtools and BC Ftools. Giga Science 2021, 10(2)10.1093/gigascience/giab 00810.1093/gigascience/giab 008PMC 793181933590861 · doi ↗ · pubmed ↗
- 4Mölder F, Jablonski KP, Letcher B, Hall MB, Tomkins-Tinch CH, Sochat V, Forster J, Lee S, Twardziok SO, Kanitz A et al. Sustainable data analysis with Snakemake. In.: F 1000 Research; 202110.12688/f 1000 research.29032.110.12688/f 1000 research.29032.1PMC 811418734035898 · doi ↗ · pubmed ↗
- 5Rice ES, Green RE. New approaches for genome assembly and scaffolding. Annu Rev Anim Biosci 2019, 7(Volume 7, 2019):17–40 10.1146/annurev-animal-020518-11534410.1146/annurev-animal-020518-11534430485757 · doi ↗ · pubmed ↗
- 6Brunner AM, Varkonyi-Gasic E, Jones RC. Phase change and phenology in trees. In: Comparative and evolutionary genomics of angiosperm trees. Edited by Groover A, Cronk Q, vol. 21. Cham: Springer International Publishing; 2017: 227–274.