Structure and Spectroscopy of Triruthenium Dodecacarbonyl, Ru3(CO)12
Stewart F. Parker, A. Dominic Fortes

TL;DR
This study investigates the structure and vibrational properties of triruthenium dodecacarbonyl using multiple spectroscopic techniques and neutron diffraction.
Contribution
The paper provides the most precise structural determination of Ru3(CO)12 and reassigns vibrational modes using INS and low-temperature spectroscopy.
Findings
The P21/n structure of Ru3(CO)12 is stable down to 10 K with a 5.9% volume contraction.
INS spectroscopy revealed all fundamentals below 700 cm–1 for the first time.
Vibrational mode assignments were revised based on new spectroscopic data.
Abstract
We have reinvestigated the structure and vibrational spectroscopy of triruthenium dodecacarbonyl, Ru3(CO)12, in the solid state by neutron powder diffraction, inelastic neutron scattering (INS), infrared and Raman spectroscopies. We find that the known room temperature P21/n structure is maintained down to 10 K. The unit-cell parameters follow a Debye relationship, with an overall 5.9% volume contraction from 300 to 10 K. The high resolution data at 10 K has enabled the most precise determination of the structure to date. INS spectroscopy, which has no selection rules, has allowed the observation of all the fundamentals below 700 cm–1 for the first time. In combination with new low temperature infrared and Raman spectra, this has resulted in the reassignment of several of the modes. Our previous work has shown that density functional theory calculations of the vibrational spectra of…
Genes, proteins, chemicals, diseases, species, mutations and cell lines named across the full text — each resolved to its canonical identifier and authoritative record.
Click any figure to enlarge with its caption.
 1
1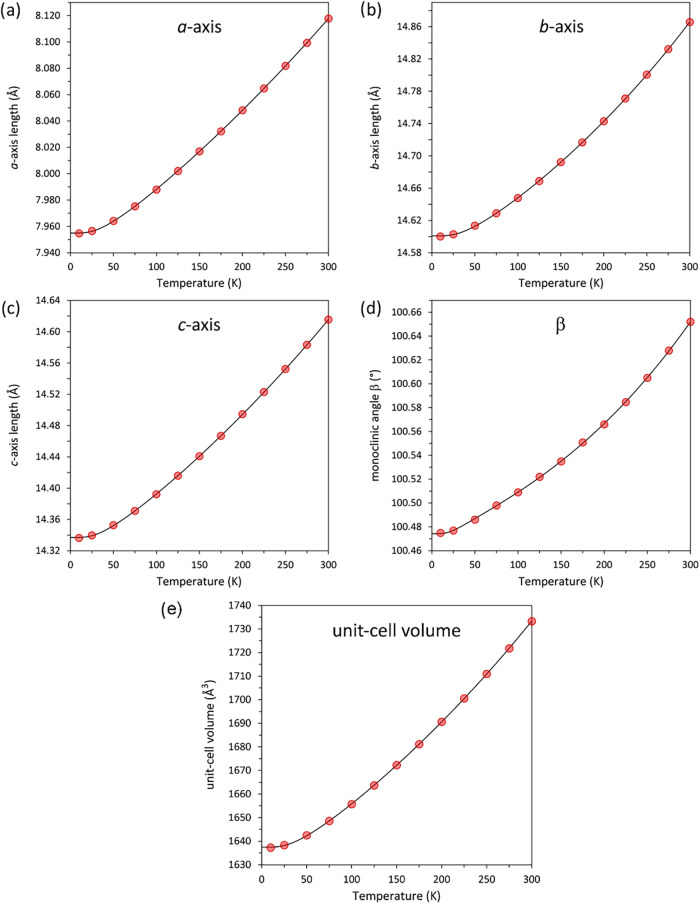 2
2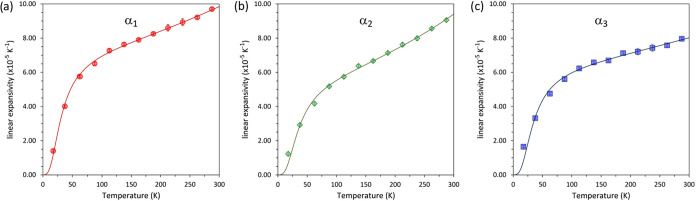 3
3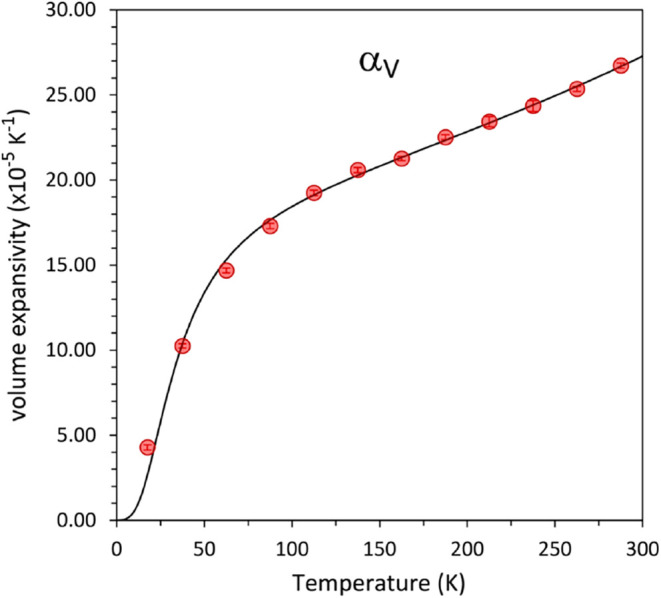 4
4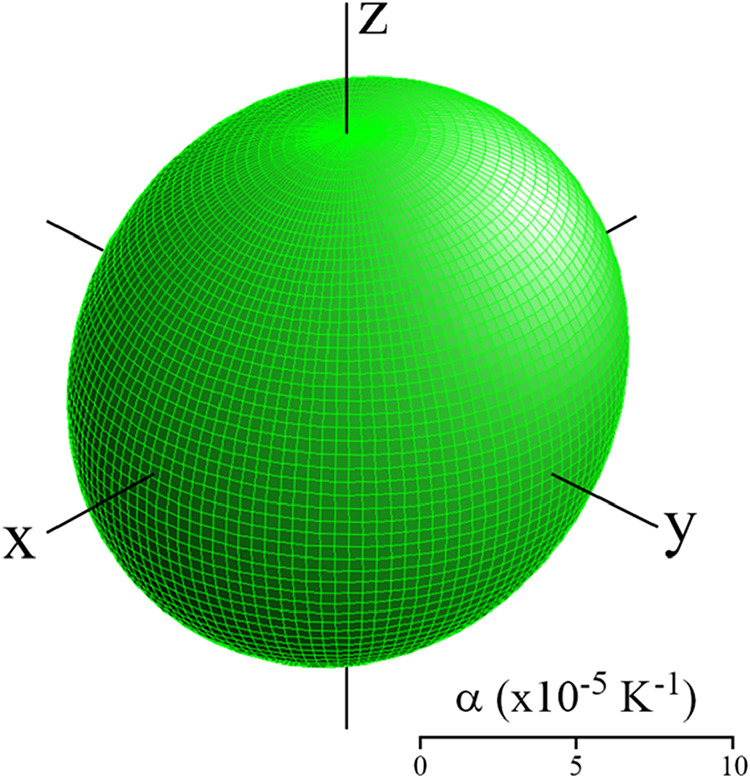 5
5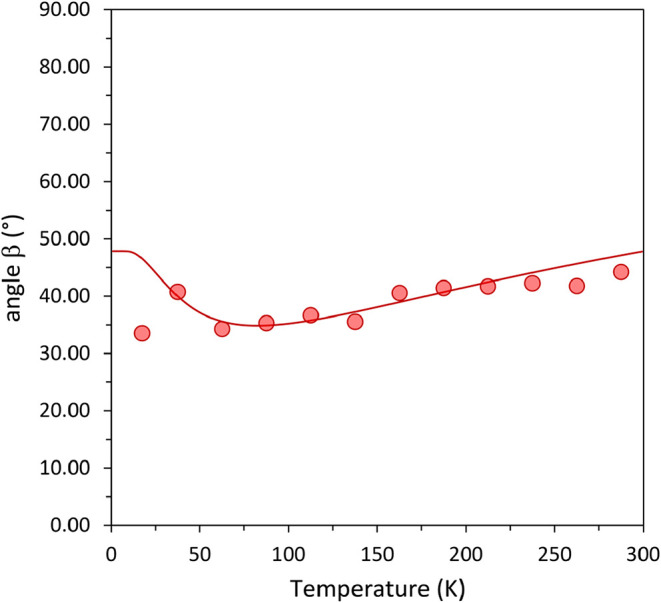 6
6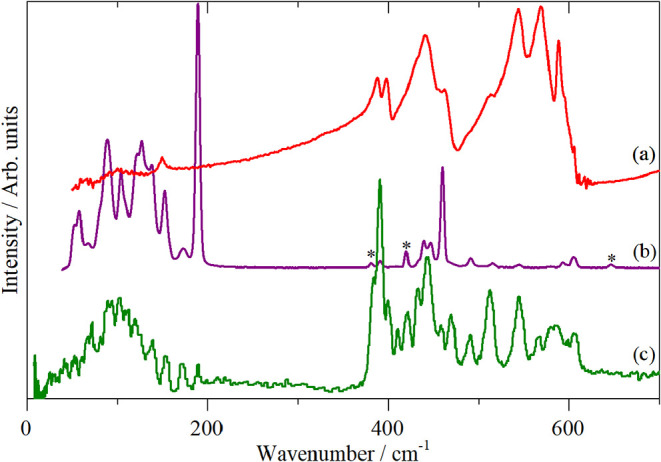 7
7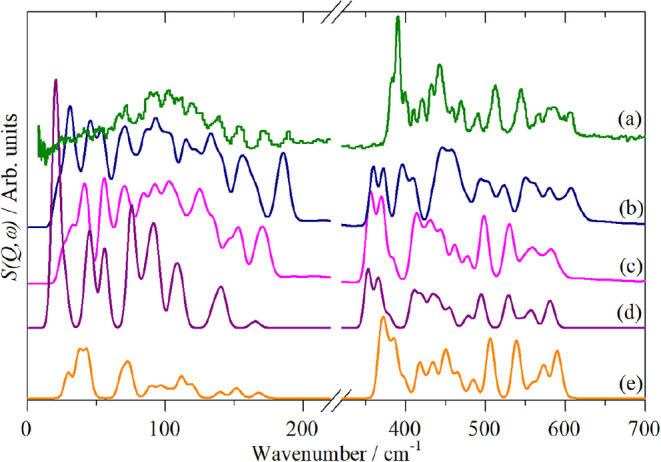 8
8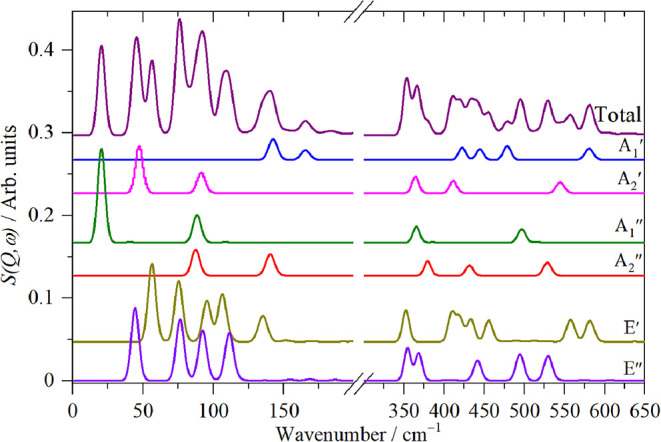 9
9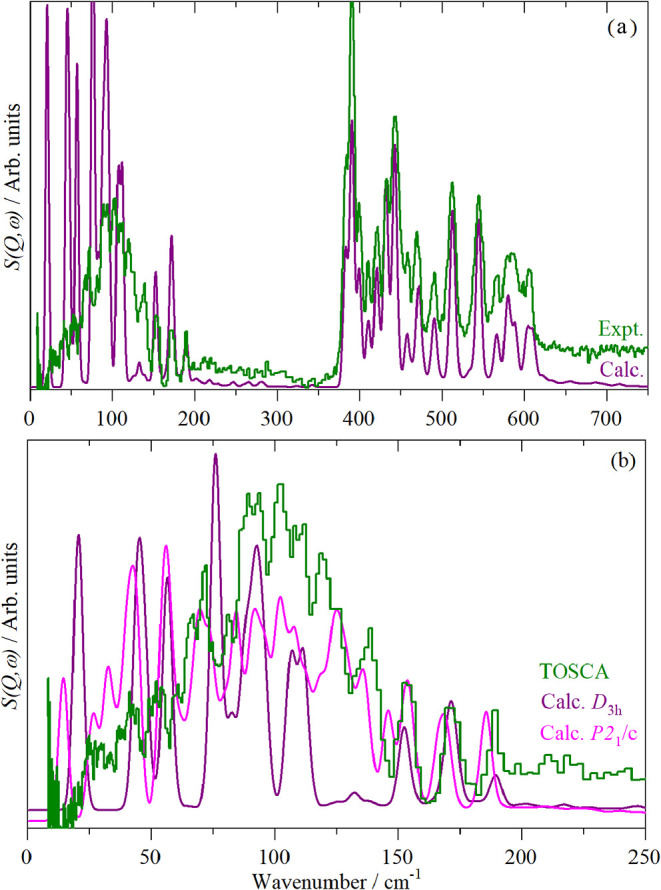 10
10| ( | ( | ( | ( | volume | |
|---|---|---|---|---|---|
| θD (K) | 135.7(4) | 146.2(7) | 132.9(6) | 138.1(5) | 137.8(5) |
|
| 75.7875(6) | 468.621(5) | 443.667(4) | 72.0617(6) | 246.524(2) |
|
| 3.223(4) × 106 | 4.085(9) × 106 | 3.537(6) × 106 | 3.271(5) × 106 | 3.617(6) × 106 |
|
| 3.02(2) | 6.35(3) | 3.92(3) | 2.88(2) | 4.29(2) |
| Debye cutoff (cm–1) | 94.3(3) | 101.6(5) | 92.4(4) | 96.0(3) | 95.8(3) |
|
| 503.392(9) | 3112.65(6) | 2946.90(6) | 478.645(9) | 1637.45(3) |
|
| 42.53(6) | 8.72(2) | 7.97(1) | 45.39(7) | 14.67(2) |
|
| 7.05(4) | 13.71(7) | 8.85(5) | 6.76(4) | 9.57(5) |
| RT5 | 100 K6 | 10 K | CASTEP | DMol3
| Gaussian | |
|---|---|---|---|---|---|---|
| distance (Å) | ||||||
| Ru–Ru | 2.851, 2.852, 2.860 | 2.844, 2.846, 2.859 | 2.842, 2.849, 2.855 | 2.929, 2.929, 2.927 | 2.882, 2.887, 2.897 | 2.921, 2.921, 2.921 |
| av. COax | 1.133 | 1.137 | 1.138 | 1.143 | 1.156 | 1.174 |
| av. COeq | 1.127 | 1.136 | 1.138 | 1.142 | 1.156 | 1.175 |
| av. Ru–Cax | 1.942 | 1.951 | 1.950 | 1.980 | 1.950 | 1.959 |
| av. Ru–Ceq | 1.921 | 1.925 | 1.930 | 1.951 | 1.917 | 1.933 |
| bond angle (deg) | ||||||
| Ru–Ru–Ru | 60.23, 60.03, 59.74 | 60.18, 59.92, 59.90 | 60.174, 59.998, 59.828 | 60.00, 60.00, 60.00 | ||
| av. Ru–COax | 173.3 | 173.45 | 171.28 | 172.81 | 171.64 | |
| av. Ru–COeq | 178.6 | 178.60 | 178.68 | 178.87 | 178.49 |
| sym | mode no. | description | activity | Quicksall | Kettle | Adams | this work |
|---|---|---|---|---|---|---|---|
|
| ν1 | ν(CO)ax | R | 2120 | 2120 | 2120 | |
|
| ν2 | ν(CO)eq | R | 2036 | 2028 | 2028 | |
|
| ν3 | ν(Ru–CO)ax | R | 459 | 457 | ||
|
| ν4 | ν(Ru–CO)eq | R | 383 | 432 | ||
|
| ν5 | δ(Ru–CO) | R | 449 | 588 | ||
|
| ν6 | δ(Ru–CO) | R | 489 | 490 | ||
|
| ν7 | ν(Ru–Ru) | R | 189 | 187 | 185 | 185 |
|
| ν8 | δ(OC–Ru–CO) | R | 85 | 124 | 142 | |
|
| ν9 | δ(OC–Ru–CO) | R | 47 | 86 | 82 | |
|
| ν10 | ν(CO)eq | inactive | 2000 | 1990 | ||
|
| ν11 | ν(Ru–CO)eq | inactive | 566 | |||
|
| ν12 | δ(Ru–CO) | inactive | 430 | |||
|
| ν13 | δ(Ru–CO) | inactive | 390 | |||
|
| ν14 | δ(OC–Ru–CO) | inactive | 91 | |||
|
| ν15 | δ(OC–Ru–CO) | inactive | 48 | |||
|
| ν16 | ν(CO)ax | IR and R | 2061 | 2060 | 2064 | |
|
| ν17 | ν(CO)eq | IR and R | 2019 | 2019 | 2021 | |
|
| ν18 | ν(CO)eq | IR and R | 2012 | 1996 | 2006 | |
|
| ν19 | ν(Ru–CO)ax | IR and R | 449 | 442 | ||
|
| ν20 | ν(Ru–CO)eq | IR and R | 403 | 420 | ||
|
| ν21 | ν(Ru–CO)eq | IR and R | 391 | 382 | ||
|
| ν22 | δ(Ru–CO) | IR and R | 604 | 603/610 | ||
|
| ν23 | δ(Ru–CO) | IR and R | 580 | 578/580 | ||
|
| ν24 | δ(Ru–CO) | IR and R | 548 | 471 | ||
|
| ν25 | δ(Ru–CO) | IR and R | 515 | 442 | ||
|
| ν26 | ν(Ru–Ru) | IR and R | 149 | 151 | 151 | 151 |
|
| ν27 | δ(OC–Ru–CO) | IR and R | 131 | 106 | ||
|
| ν28 | δ(OC–Ru–CO) | IR and R | 100 | 116 | 95 | |
|
| ν29 | δ(OC–Ru–CO) | IR and R | 106/101 | 75 | ||
|
| ν30 | δ(OC–Ru–CO) | IR and R | 90 | 57 | ||
|
| ν31 | δ(Ru–CO) | inactive | 513 | |||
|
| ν32 | δ(Ru–CO) | inactive | 390 | |||
|
| ν33 | δ(OC–Ru–CO) | inactive | 89 | |||
|
| ν34 | δ(OC–Ru–CO) | inactive | 20 | |||
|
| ν35 | ν(CO)ax | IR | 2031 | 2041 | 2044 | |
|
| ν36 | ν(Ru–CO)ax | IR | 435 | 543 | ||
|
| ν37 | δ(Ru–CO) | IR | 468 | 442 | ||
|
| ν38 | δ(Ru–CO) | IR | 449 | 410 | ||
|
| ν39 | δ(OC–Ru–CO) | IR | 140 | 141 | ||
|
| ν40 | δ(OC–Ru–CO) | IR | 68 | 88 | ||
|
| ν41 | ν(CO)ax | R | 1994 | 1986 | 1987 | |
|
| ν42 | ν(Ru–CO)ax | R | 420 | 544 | ||
|
| ν43 | δ(Ru–CO) | R | 512 | |||
|
| ν44 | δ(Ru–CO) | R | 431 | |||
|
| ν45 | δ(Ru–CO) | R | 399 | |||
|
| ν46 | δ(Ru–CO) | R | 390 | |||
|
| ν47 | δ(OC–Ru–CO) | R | 124 | 79 | 111 | |
|
| ν48 | δ(OC–Ru–CO) | R | 93 | |||
|
| ν49 | δ(OC–Ru–CO) | R | 76 | |||
|
| ν50 | δ(OC–Ru–CO) | R | 44 |
- —ISIS Neutron and Muon Source10.13039/501100021200
- —ISIS Neutron and Muon Source10.13039/501100021200
Peer Reviews
No public reviews on file for this paper yet. If you reviewed it on a platform where reviews are public (OpenReview, ICLR, NeurIPS, ICML), you can paste yours below so the community can read it here.
Videos
No videos yet. Explain this paper in a talk, walkthrough, or lecture? Add one.
Taxonomy
TopicsOrganometallic Complex Synthesis and Catalysis · Advanced Chemical Physics Studies · High-pressure geophysics and materials
Introduction
In 1910 Mond, Hirtz, and Cowap? reported that the reaction of ruthenium black with carbon monoxide at 350–450 bar and 300 °C resulted in the formation of a small amount of a yellow-orange solid that was believed to be a ruthenium carbonyl. Subsequent work by Manchot and Manchot? using even more forcing conditions (700 bar and 400 °C) produced a yellow liquid that decomposed to an orange solid. The yellow liquid was identified as Ru(CO)5 and the orange solid as ruthenium enneacarbonyl, Ru_2_(CO)9. It was only in 1961 that Corey and Dahl? correctly identified the orange compound as triruthenium dodecacarbonyl, Ru_3_(CO)12, by its isomorphism to Os_3_(CO)12, whose structure had been determined by single crystal X-ray diffraction. Subsequent more comprehensive studies ?−? ? ? confirmed the result.
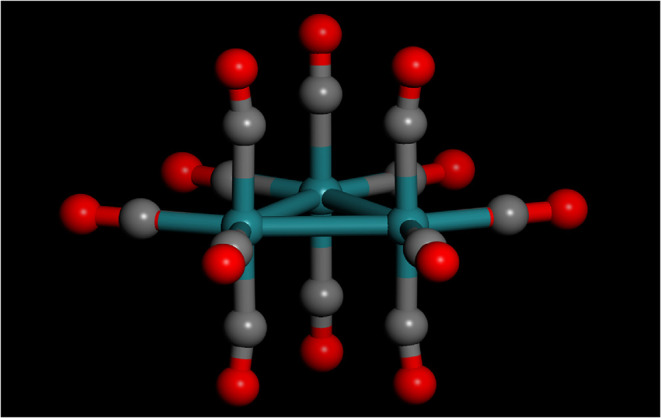
The structure of Ru_3_(CO)12 is shown in Figure, in solution the symmetry is D 3h, in the solid state it is formerly C 1, but is actually very close to D 3h. The development of methods that allowed large quantities of Ru_3_(CO)12 to be prepared? enabled the vibrational spectroscopy to be investigated ?,?−? ? ? ? ? ? ? and its chemistry to be explored. Ru_3_(CO)12 has an extensive photochemistry, ?−? ? it finds use as a homogeneous catalyst for a variety of reactions ?−? ? ? ? and also as a precursor for supported Ru catalysts. ?−? ?
Idealised D 3h structure of Ru3(CO)12. Key: green = Ru, gray = C, red = O.
Despite the extensive work on both the structure and the spectroscopy, there are still some ambiguities. The room temperature structure is maintained down to 100 K but whether there are any phase transitions below this is unknown. While the CO stretch region has been comprehensively assigned, the assignment of the 0–800 cm^–1^ region, where the Ru–C stretch, Ru–CO deformation, C–Ru–C bend and Ru–Ru stretch modes occur is much less certain because several of the modes exhibit negligible intensity.
Neutron scattering potentially provides answers to both of these uncertainties. Neutron diffraction? data is readily obtained down to limiting low temperatures. In addition to detecting phase transitions, it may also provide very accurate and precise bond distances and angles. Neutron vibrational spectroscopy? (inelastic neutron scattering, INS) has no selection rules and all the modes are, in principle, observable. The resolution in the CO stretch region is insufficient to resolve the modes but in the region below 800 cm^–1^, the resolution is comparable to routine infrared and Raman measurements. In previous work we have used the combination of neutron powder diffraction (NPD) and INS to observe a new low-temperature phase of Fe(CO)5 ? and to provide the first complete assignment of the low energy modes. INS has also been used to assign the low energy modes of the metal hexacarbonyls, M(CO)6, (M = Cr, Mo, W)? and of Fe_2_(CO)9.?
Vibrational spectroscopy assignments are usually supported by density functional theory (DFT) calculations. ?,?,? For the hexacarbonyls, periodic-DFT calculations of the solid state spectra were in good agreement with the experimental data. For Fe(CO)5 ? and Fe_2_(CO)9 ? this was not the case and both isolated molecule and fully periodic calculations gave poor agreement. It is of interest to see how well DFT performs for Ru_3_(CO)12.
In this work, we have determined the solid-state structure by neutron powder diffraction between 10 and 300 K. We have measured the INS spectrum at ∼10 K. To update the conventional infrared and Raman spectra, we have recorded Raman spectra in the range 7–300 K and infrared spectra between 173 and 300 K. We have also investigated the performance of DFT calculations for this system.
Results and Discussion
Neutron Powder Diffraction
The room temperature structure of Ru_3_(CO)12 is monoclinic, space group P2_1_/n (no. 14) ?−? ? ? and it is known that this is maintained down to at least 100 K.? In the present work we have measured the lattice parameters from 300 to 10 K. The temperature dependence of the unit-cell parameters and the unit-cell volume of Ru_3_(CO)12 are shown in Figure and the values reported in Table S1. The values obtained at 300, 150, and 100 K, are within errors, the same as measured by Churchill et al.? and Braga et al.? It is apparent that the P2_1_/n structure persists throughout the 10–300 K interval. Note that the unique monoclinic angle, β, varies by less than 0.2° on cooling close to absolute zero.
Temperature dependence of the unit-cell parameters of Ru3(CO)12 from neutron powder diffraction data collected on warming from 10 to 300 K. It is apparent that there are no phase transitions. (a) a-axis, (b) b-axis, (c) c-axis, (d) β angle and (e) unit-cell volume.
The unit-cell volume decreases on cooling from 300 to 10 K by 5.5%. A high pressure study? of Ru_3_(CO)12 found that it was highly compressible, decreasing in molar volume by 25% between atmospheric pressure and 8.14 GPa. The drop in volume was the result of a reduction in the intermolecular space, rather than structural changes. Comparison of the room temperature and 10 K structural parameters, Table S1, shows that this is also the case on cooling. The unit-cell volume of Ru_3_(CO)12 has been fitted with a second-order Grüneisen approximation to the zero-pressure equation of state.? In this approximation, the thermal expansion is considered equivalent to elastic strain such that
where V 0 is the unit cell volume at zero pressure, b = 1/2(K′0 – 1) and Q = (V 0 K 0/γ); K 0 is the zero-pressure isothermal bulk modulus, K′0 is its first derivative with respect to pressure, and γ is the thermal Grüneisen parameter. The internal energy due to lattice vibrations, E(T), is then determined via a simple Debye model approximation of the phonon density of states
where θ_D_ is the Debye temperature, n is the number of atoms per formula unit, and k B is the Boltzmann constant; the integral term is evaluated numerically.
A similar method was adopted to fit the unit-cell parameters. However, in order to be formally dimensionally correct, the parameters have each been cubed and the temperature dependence of the monoclinic angle has been derived from the fitting of both a ^3^ and (*a·*sin β)^3^.
Table reports the parameters obtained from fitting eq to the cubed unit-cell parameters and the unit-cell volume of Ru_3_(CO)12. The resulting fits to the Debye-type model are shown as the solid lines in Figure.
1: Parameters Obtained by the Fitting of a Debye-Type Model to the Unit-Cell Volume of Ru3(CO)12 as a Function of Temperature (Equations and )
In Table, lines 1 to 4 report parameters obtained by the fitting of a Debye-type model to the unit-cell volume of Ru_3_(CO)12 as a function of temperature (eqs and ?). The last four rows of the table report values derived from the parameters in the preceding rows. Note that the Debye temperatures obtained from fitting each direction in the crystal are very similar; however, the elastic stiffness of the a-axis is substantially higher than that of either the b- or c-axis. This likely reflects the packing of the trimers into layers, the direction perpendicular to the layers being less compressible.
Eulerian infinitesimal strain tensors were calculated from pairs of cell parameters determined at adjacent temperatures and then normalized by the temperature increment between them in order to obtain thermal expansion tensors, i.e., unit-strain tensors.? Standard matrix decomposition methods? were used to derive the eigenvalues and eigenvectors of the thermal expansion tensor, these being the magnitudes and orientations of the principal expansivities.
The temperature dependences of the three principal linear expansivities are shown in Figure, and the sum of these three components–the volume thermal expansion–is plotted in Figure. The same analysis was carried out on values derived from the Debye model fits, as represented by the solid lines on Figures and ?.
Principal thermal expansivities as a function of temperature: (a) α1; (b) α2; (c) α3.
Volume thermal expansion of Ru3(CO)12.
The thermal expansion tensor shown in Figure is depicted by a representation surface,? oriented in relation to the orthogonal basis (x,y,z) used in its derivation. These directions correspond with the crystallographic basis as, x||*a·*sin β, y||b, and z||c. Note that the thermal expansion shown (at 300 K) is comparatively isotropic, which remains true upon cooling to 10 K, there being only slight variations in the orientation of the principal axes.
Thermal expansion tensor of Ru3(CO)12 at 300 K. Drawn using WinTensor.
Being a monoclinic crystal, the principal direction α_2_ is constrained by symmetry to coincide with the 2-fold axis, while α_1_ and α_3_ need not be aligned with any particular crystallographic direction. The orientation of these vectors with respect to the crystallographic basis may be represented by one angle, for example the angle between α_1_ and x (or *a·*sin β). The temperature dependence of this quantity is shown in Figure.
Angle between the principal expansion direction α1 and the orthogonal basis vector x as a function of temperature. The symbols are derived from the data in Table and the solid line from the fitting of a Debye-type model.
The structure of Ru_3_(CO)12 at 10 K is shown in Figure S1. The site symmetry is C 1, so there are no requirements for equivalent bond distances and angles to be the same. Nonetheless, as can be seen from Figure S1, the structure is very close to D 3h. Table lists averaged bond lengths and angles from previous work and our results. These confirm the conclusions of Churchill et al.? namely that all of the CO bond distances are the same, that the axial Ru–C bonds are longer than the equatorial ones, axial Ru–CO bonds are bent by ∼7°, that the equatorial ones are essentially linear and that the Ru_3_ triangle is very close to being an equilateral triangle.
2: Comparison of Intramolecular Bond Lengths in Ru3(CO)12 between Our Work and Values Reported in the Literature
Vibrational Spectroscopy
Idealised Ru_3_(CO)12 has D 3h symmetry and the distribution of the modes and their activity has been given by Adams and Taylor,? their analysis is reproduced in Table. There are no symmetry operations that interchange the axial and equatorial carbonyls, so they are treated as distinct entities. Note that under D 3h symmetry, 10 of the 50 modes are forbidden in both the infrared and Raman spectra. In the solid state, the low site symmetry of C 1 means that all degeneracies are lifted and all modes are allowed. The presence of four molecules in the primitive cell results in every mode having two infrared allowed and two Raman allowed factor group components.? However, while the D 3h forbidden modes are now formally allowed, the selection rules do not give any indication of intensity (a mode can be allowed but have essentially zero intensity), they are likely to have very low infrared and Raman intensities. Note that all modes are allowed in the INS.
3: Ru3(CO)12 in D 3h Symmetry: Distribution of the Modes, Their Activity, Transition Energies (cm–1) and Assignments
Figure shows the vibrational spectra of Ru_3_(CO)12 in the solid state in the low energy region, which is the focus of the present study, the observed bands are given in Table. (The complete spectra 0–2200 cm^–1^ are shown in Figure S2). We defer a detailed assignment of the spectra to the next section, where we support these with DFT calculations. However, several points are worth noting.
Vibrational spectra of Ru3(CO)12. (a) Infrared at 296 K, (b) Raman (785 nm) at 7 K and (c) INS at 10 K. In (b) the asterisks denote bands due to the sapphire window of the sample holder.
In the 300–700 cm^–1^ region 24 modes are expected. In the INS spectrum, there are, at most, only 17 modes apparent. As all modes are allowed and must be present, it immediately follows that there must be at least seven accidental degeneracies. We note that while overtones and combinations are allowed transitions in INS spectroscopy and for hydrogenous systems can be almost as intense as some fundamentals. However, their intensity depends on the mass of the atom in the mode and for non-hydrogenous systems the intensity is negligible. This is advantageous as it means that any modes of reasonable intensity in the INS spectrum will be fundamentals.
As expected, there are no bands in the 200–360 cm^–1^ interval because there are no bridging carbonyls present.
In the region below 200 cm^–1^, in addition to the OC–Ru–CO bending modes and the Ru–Ru stretch modes, there are three acoustic translational modes, nine optic translational modes and 12 librational modes. This results in the very complex feature seen in the INS spectrum. As both the translations and the librations require the entire molecule to move, these are likely to form the low energy side of the feature below 100 cm^–1^ and the internal modes forming the 100–200 cm^–1^ bands. All of the INS features across the 100–800 cm^–1^ interval are surprisingly sharp which would suggest that there is no significant vibrational dispersion present (variation of transition energy with wavevector). INS is sensitive to all wavevectors, in contrast to infrared and Raman spectroscopy that are seen at zero wavevector, As the INS spectrum can be considered to be proportional to the projection of the vibrational dispersion curves onto the energy axis, any significant dispersion would results in broadened bands, perhaps with unusual lineshapes. It follows that as the bandwidths are not much larger than the instrument resolution, the dispersion must be small, 10 cm^–1^ or so.
Computational Studies and Assignment of the Spectra
The CO stretch region of Ru_3_(CO)12 has been investigated by several groups ?,?−? ? and there is general agreement on the assignments. Our infrared and Raman spectra are in good agreement with those in the literature and the INS does not provide any useful information in this region, so we have adopted the literature assignments.
The most comprehensive assignment of Ru_3_(CO)12 in the 0–750 cm^–1^ region is that of Adams and Taylor? and these are listed in Table. However, of the 42 modes in this region they only locate 26, unsurprisingly these are the infrared and Raman active modes, those that are forbidden under D 3h symmetry (A′2, A″1, E″) are largely unassigned.
A comparison of an experimental INS spectrum with that generated from a DFT calculation is commonly used as a means to assign the spectrum. ?,? We have previously employed this approach to assign the solid-state spectra of the metal hexacarbonyls, M(CO)6, M = Cr, Mo, W.? For these molecules the agreement between observed and calculated spectra was excellent, however, for Fe(CO)5 ? and Fe_2_(CO)9,? this was not the case. As Figure shows, the agreement between observed and calculated spectra is, at best, modest for Ru_3_(CO)12.
Comparison of observed and calculated (from DFT) spectra of Ru3(CO)12. (a) Experimental spectrum at 10 K, (b) DMol3 (GGA, PBE, DNP), (c) CASTEPv17 (GGA, PBE, TS, OTFG) (d) CASTEPv17 (GGA, PBE, OTFG) isolated molecule calculation with D 3h geometry imposed and (e) Gaussian09 (B3LYP, LanL2DZ). (b, c) are fully periodic calculations of the P21/c structure, (d) and (e) are isolated molecule calculations with D 3h geometry imposed. See the Computational Studies part of the Experimental Section for the definition of the acronyms.
Both fully periodic calculations, (DMol^3^, Figureb and CASTEP, Figurec) and isolated molecule (Gaussian09, Figured) were used. CASTEP is a periodic method that uses plane-waves, DMol^3^ and Gaussian09 use atom centered orbitals. The calculated geometry (Table) generally showed good agreement with the experimental data, so the discrepancies between theory and experiment are not the result of an inaccurate structure. We have previously shown? that, providing the geometry was reasonably accurate (as is the case here), the mode eigenvectors that describe the motion (i.e. the amplitude of vibration of each atom in the mode) are relatively insensitive to the eigenvalue (transition energy). This means that the calculated transition energies can be shifted (“scaled”) to test an assignment scheme.
To simplify the problem we will initially assume D 3h symmetry in the solid state and only one molecule in the unit cell. This leads to the calculated spectrum shown in Figured, the resemblance to the periodic calculation in Figurec is clear. Major differences occur in the 0–200 cm^–1^ region because the periodic calculation includes the 12 translational and 12 librational modes, whereas in the isolated molecule calculation only three librational modes (the intense peak at 20 cm^–1^) are present.
The calculated INS spectra do provide some useful information. By setting the transition energies for all the modes to zero, except for one irreducible representation, it is possible to display each irreducible representation in isolation. Figure shows the results. It is apparent that all A modes (* A ′_ 1 , * A *′ 2 , * A *″ 1 , * A *″ 2 _) have similar intensities as do E modes ( E *′, * E *″) and that E modes are approximately twice as intense as A modes. This means that distinguishing A from E modes is straightforward, but that the INS does not give any information on distinguishing between the irreducible representations in each type of mode (A or E). However, by making use of the infrared and Raman selection rules, the only ambiguity is between the * A *′_ 2 _ and * A *″_ 1 _ classes.
Decomposition of the DFT calculated (in D 3h symmetry) spectrum of Ru3(CO)12 into the modes of each irreducible representation.
The procedure adopted was to move each calculated mode to the nearest experimental peak. In most cases the shift required was in the range 0–20 cm^–1^. Figurea compares the experimental spectrum and the adjusted DFT calculation. It is apparent that the agreement in the 300–700 cm^–1^ region is excellent and very poor in the 0–200 cm^–1^ region. We will consider each region separately.
(a) Comparison of the experimental (“Expt.”) INS spectrum of Ru3(CO)12 with that calculated from an adjusted calculation of Ru3(CO)12 in D 3h symmetry (“Calc.”) and (b) as (a) but showing only the 0–250 cm–1 region and including the adjusted calculation of Ru3(CO)12 in the complete unit cell (“Calc. P21/c”).
The 300–700 cm–1 Region
It is apparent by comparison of the INS spectrum (Figurec) and the decomposition into the symmetry classes (Figure) that there must be several modes at, or near, 390 cm^–1^ in order to account for the intensity of the feature. We find five modes within 10 cm^–1^ of 390 cm^–1^ (A′2, E′, A″1, 2 × E″). Similarly for the second most intense mode at 443 cm^–1^, five modes are also required (A″1, A′2, E′, A″2, E ^″^). In both cases, with one exception, they are all δ(Ru–CO) modes.
Table lists the literature assignments together with our new ones. In most cases our assignments for the A′1, A″2 and E′ modes agree with those of Adams and Taylor.? Where the disagreements arise it is because they made the assumptions that the D 3h selection rules were obeyed and that ν(Ru–CO) modes were at lower energy than δ(Ru–CO) modes. Neither of these assumptions is correct. The C 1 site symmetry combined with the C 2h factor group symmetry means that all modes have components that are infrared and Raman active. This is particularly the case for the E″ modes that may have significant infrared activity, the 515 cm^–1^ mode being a case in point. The mode visualizations clearly show that both ν(Ru–CO) and δ(Ru–CO) modes are distributed across the entire range.
The 0–250 cm–1 Region
The only modes that are known with any certainty ?−? ? ? ? in this region are the Ru–Ru stretch modes at 151 and 185 cm^–1^ (E′ and A′1 respectively). Figureb shows an expanded view of this region with the experimental data, the fully periodic calculation of the P2_1_/c and the D 3h isolated molecule calculation. In both calculations only the transition energies of the Ru–Ru stretch modes have been adjusted. Below 50 cm^–1^ the agreement is very poor with the modes calculated to be much stronger than observed. Adams and Taylor concluded that these were likely to be translational optic modes, a proposal that is confirmed by the mode visualizations. These are likely to show vibrational dispersion (variation of transition energy with wavevector) which is observable by INS? and would have the effect of spreading the modes out. Unfortunately, given the number of atoms in the primitive cell (108), a full dispersion calculation is not feasible with our computational resources.
Above 50 cm^–1^ the P2_1_/c calculation shows surprisingly good agreement with the experimental spectrum, however, both the experimental data and the P2_1_/c calculation are in marked disagreement with the D 3h isolated molecule calculation. As both the experimental data and the P2_1_/c calculation include the librational modes, it was hoped that a comparison of the P2_1_/c and D 3h calculations would enable these to be easily pinpointed. This turns out not to be the case and the spectra are distinctly different. The most likely reason is because the librations and the δ(OC–Ru–CO) modes have similar transition energies and belong to the same irreducible representations, they are allowed to mix. In the solid state this is likely to be case for most of the modes in the 50–150 cm^–1^ range. It also means that it is not possible to map the symmetry assignments from the isolated molecule calculation to the solid state as was done for the 300–700 cm^–1^ region. In solution, where the D 3h selection rules are valid, it is potentially possible to observe the pure modes. Unfortunately, the poor solubility of Ru_3_(CO)12 in virtually all solvents has so far prevented this being accomplished.
The difference between the P2_1_/c and D 3h calculations means that it is not possible to assign the modes in this region with any confidence. In Table, the modes in this region are as reported by DFT, adjustment would not seem to serve any purpose. Table S2 lists the DFT calculated transition energies
Conclusions
In this work we have re-examined the structure and vibrational spectroscopy of Ru_3_(CO)12. The high-resolution neutron powder diffraction shows that the room temperature structure is maintained down to 10 K. The structure is highly compressible, as shown by both our variable temperature study and the ambient temperature pressure study.? Our diffraction study has confirmed that in the solid state, the axial Ru–C lengths are longer than the equatorial values, Table.
INS spectroscopy has enabled the observation of many of the internal modes for the first time. Only some of the infrared and Raman active modes were known with any certainty, the present work has extended this to include modes that are either forbidden in D 3h symmetry or were not observed because of overlap with other modes or having intrinsically low intensity. Unfortunately, a complete and unambiguous assignment has not been possible. This is because in the 0–250 cm^–1^ region where the δ(OC–Ru–CO) modes occur, the low crystal symmetry results in extensive mixing with the librational modes.
One of the aims of this work was to test how well DFT performed for this system. As shown in Figure, the answer is “poorly”. This is irrespective of whether it is a periodic calculation or an isolated molecule calculation, three different codes give similar results, all at variance with experiment. This was also found to be the case for Fe(CO)5 ? and Fe_2_(CO)9 ? but not for the metal hexacarbonyls M(CO)6, (M = Cr, Mo, W).? In all cases the calculated geometry is in good agreement with the experimental structure.
Experimental Section
Materials
Triruthenium dodecacarbonyl, Ru_3_(CO)12 (99%), was purchased from Aldrich and used as received.
Neutron Powder Diffraction
Ru_3_(CO)12 powder was transferred into an Al-alloy frame surrounding a cuboid cavity of dimensions 18 × 23 mm (w × h) perpendicular to the incident neutron beam and 15 mm depth parallel to the beam. The front and back faces of the sample were covered with 125 μm-thick vanadium-foil windows, sealed to the Al-frame with indium wire. The sample can was mounted in a closed-cycle refrigerator (CCR) mounted in the sample vacuum tank of the High-Resolution Powder Diffractometer (HRPD) ?,? at the ISIS Neutron and Muon Spallation Source.? Temperature control was achieved by balancing the cooling from the helium exchange gas (at ∼50 mb) with direct heating of the sample holder via a cartridge heater inserted into the Al-frame. Temperatures were measured and controlled by means of a RhFe thermometer inserted in the frame on the opposite side of the sample. To ensure thermal equilibrium between the heated frame and the powder samples during a variable-temperature study requires moderately slow ramping between temperature set-points, ∼3 K min^–1^, and a wait of at least 10 min after reaching the set-point prior to commencing data acquisition, a previously established protocol. ?,? After an initial check at 285 K the sample temperature was reduced to 10 K and high-quality data were collected using the instrument’s 30–130 ms and 100–200 ms time-of-flight (TOF) windows. In HRPD’s highest resolution backscattering detectors (2θ = 154–176°, Δd/d ≈ 1.0 × 10^–3^) these two windows cover d-spacing ranges of 0.65–2.60 Å and 2.2–4.0 Å, respectively. The two data sets were counted for 240 and 200 μA of integrated beam current, respectively. Data were then collected on warming from 25 K in 25 K increments using only the 100–200 ms TOF window, counting each for 20 μA (∼25 m of real time) for the purpose of precise lattice parameter refinement rather than structure refinement.
These data were time-focused to a common scattering angle (2θ = 168.3°), normalized to the incident spectrum and corrected for detector efficiency by reference to a V:Nb standard using the Mantid suite of neutron scattering utilities. ?,? Structural refinements were then carried out using the Rietveld method implemented in GSAS/Expgui ?,? starting from one of the previously reported structures of Ru_3_(CO)12.? The crystal structure of Ru_3_(CO)12 at 10 K is provided as a supplementary Crystallographic Information File (CIFs) and has been deposited with the Cambridge Crystallographic Data Centre (deposition number 2503303). Unit-cell parameters obtained from profile refinements done with the F(calc) weighted method in GSAS are reported in Table S1.
Vibrational Spectroscopy
For the INS measurements 9.6 g of Ru_3_(CO)12, was loaded into an In wire-sealed Al can. The sample was quenched in liquid nitrogen immediately before insertion into the indirect geometry, high resolution, broad band spectrometer TOSCA ?,? at ISIS? and measured for 1563 μA of integrated beam current (∼8.5 h). The data were converted from time-of-flight to energy transfer using standard routines included in the Mantid suite of programs. ?,? (A detailed description of TOSCA and its mode of operation are given in refs ?,? ). An empty Al can (measured at 10 K) was subtracted from the experimental spectrum.
Raman spectra were recorded with the sample in a quartz cell using a Bruker FT-Raman spectrometer (64 scans at 1 cm^–1^ resolution with 500 mW laser power at 1064 nm). Variable temperature (7–300 K) Raman spectra were recorded with a previously described,? Renishaw in-Via system using 785 nm excitation.
Infrared spectra (64 scans at 4 cm^–1^ resolution with eight times zero filling (to improve the peak shape)) were recorded with a Bruker Vertex 70 FTIR spectrometer. Room temperature spectra over the range 50–4000 cm^–1^ were obtained using the Bruker Diamond ATR accessory. Spectra (300–4000 cm^–1^) between 296 and 170 K were recorded using a SpecAc Golden Gate variable temperature accessory.
Computational Studies
DFT calculations were carried out using CASTEP? (v17 and v20), DMol^3^ (version 2021)? and Gaussian09.? For the CASTEP and DMol^3^ calculations the initial structure was that determined at 10 K in the present work. (We note that P2_1_/c and P2_1_/n are different settings (choice of axes) within space group number 14. The crystallographic standard is to adopt the setting with the less obtuse monoclinic angle, in this case P2_1_/n as β = 100.476° in this setting versus 148.748° in P2_1_/c. The structural refinements were carried out in P2_1_/n but it was more convenient computationally to use the alternative setting of P2_1_/c and this was used for the CASTEP calculations. As the symmetry elements present and the molecular structure are the same in both settings, this has no effect on the vibrational spectroscopy. For DMol^3^ the space group was set to P1 because the program cannot make use of the symmetry for the vibrational calculation of a periodic system.) For the plane-wave, pseudopotential code CASTEP, exchange and correlation were approximated using the Perdew–Burke–Ernzerhof (PBE) functional,? with the Tkatchenko-Scheffler (TS) dispersion correction scheme? within the generalized gradient approximation (GGA). On-the-fly generated (OTFG) norm-conserving pseudopotentials were used. The plane-wave cutoff was 830 eV and the Brillouin-zone sampling of electronic states used a 6 × 4 × 4 Monkhorst–Pack grid (24 k-points). The equilibrium structure, an essential prerequisite for lattice dynamics calculations was obtained by Broyden-Fletcher-Goldfarb-Shanno (BFGS) geometry optimization after which the residual forces were converged to zero within |0.0072| eV Å^–1^. Phonon frequencies were obtained by diagonalization of dynamical matrices computed using density-functional perturbation theory? (DFPT). An analysis of the resulting eigenvectors was used to map the computed modes to the corresponding irreducible representations of the point group and assign IUPAC symmetry labels. DFPT was also used to compute the dielectric response and the Born effective charges, and from these the mode oscillator strength tensor and infrared absorptivity were calculated. Only the Brillouin zone Γ-point (q = 0) modes were calculated because the low symmetry (P2_1_/c) and the large number of atoms (108) in the primitive cell made running the complete dispersion calculation impractical. For DMol^3^, the PBE functional in the GGA was used with the DNP basis set with DFT calculated semicore pseudopotentials. A 6 × 4 × 6 Monkhorst–Pack grid (72 k-points) was used. Vibrational transition energies were calculated by a finite displacement method. For Gaussian09 the B3LYP functional with the Los Alamos National Laboratory double-ζ basis set (LanL2DZ) basis set was used. The INS spectra were generated from the CASTEP, DMol^3^ and Gaussian09 output using the AbINS? module within Mantid. AbINS also includes a parametrization of TOSCA’s resolution function and optionally allows overtones and combinations to be calculated up to the 10th order, so the calculated spectra are as close a representation of what would be measured experimentally as possible. The geometry optimized structures are provided as cif files (CASTEP and DMol^3^) or Cartesian coordinates (Gaussian) in the SI (Tables S2–S5).
Supplementary Material
The reference list from the paper itself. Each links out to its DOI / PubMed record.
- 1Mond L.Hirtz H.Cowap M. D.Einige neue Metallkarbonyle Z. Anorg. Chem.19106820721910.1002/zaac.19100680119 · doi ↗
- 2Manchot W.Manchot W. J.Darstellung von Rutheniumcarbonylen und – nitrosylen Z. Anorg. Allg. Chem.193622638541510.1002/zaac.19362260410 · doi ↗
- 3Corey E. R.Dahl E. F.Trinuclear osmium and ruthenium carbonyls and their identities with previously reported Os 2(CO)9 and Ru 2(CO)9 J. Am. Chem. Soc.1961832203220410.1021/ja 01470 a 044 · doi ↗
- 4Mason R.Rae A. I. M.The crystal structure of ruthenium carbonyl, Ru 3(CO)12 J. Chem. Soc. A 196877877910.1039/j 19680000778 · doi ↗
- 5Churchill M. R.Hollander F. J.Hutchinson J. P.An accurate redetermination of the structure of triruthenium dodecacarbonyl, Ru 3(CO)12 Inorg. Chem.1977162655265910.1021/ic 50176 a 051 · doi ↗
- 6Braga D.Grepioni F.Tedesco E.Dyson P. J.Martin C. M.Johnson B. F. G.A variable temperature study of Ru 3(CO)12 in the solid state and the generation of alternative crystal structures Transition Met. Chem.19952061562410.1007/BF 00136429 · doi ↗
- 7Slebodnick C.Zhao J.Angel R.Hanson B. E.Song Y. Y.Liu Z.Hemley R. J.High pressure study of Ru 3(CO)12 by X-ray diffraction, Raman, and infrared spectroscopy Inorg. Chem.2004435245525210.1021/ic 049617 y 15310201 · doi ↗ · pubmed ↗
- 8Eady C. R.Jackson P. F.Johnson B. F. G.Lewis J.Malatesta J.Mcpartlin M. C.Nelson W. J. H.Improved syntheses of the hexanuclear clusters [Ru 6(CO)18]2–, [H Ru 6-(CO)18]−, and H 2Ru 6(CO)18. The X-ray analysis of [H Ru 6(CO)18]−, a polynuclear carbonyl containing an interstitial hydrogen ligand J. Chem. Soc., Dalton Trans.198038339210.1039/DT 9800000383 · doi ↗