Molecular Landscape of TP53/RB1 Co‐Altered Tumors Uncovers Emerging Therapeutic Vulnerabilities
Xuetao Li, Meifeng Ye, Xiaomei Huang, Zhong‐Yin Huang, Juan Zhu, Zipeng He, Zhuxiang Zhao, Jun Hou, Shuquan Wei

TL;DR
This study explores cancers with TP53 and RB1 gene changes, finding they are aggressive and less responsive to immunotherapy, but more sensitive to specific drug treatments.
Contribution
The study identifies new therapeutic vulnerabilities in TP53/RB1 co-altered tumors through pan-cancer analysis and drug screening.
Findings
TP53/RB1 co-altered tumors show poor survival and low response to immunotherapy.
These tumors are more sensitive to CDK, AURKA, and PI3K/mTOR inhibitors.
Mutational patterns vary by cancer type, with EGFR, KRAS, and APC being prominent in lung, pancreatic, and colorectal cancers, respectively.
Abstract
Although TP53 and RB1 co‐alterations play critical roles in promoting malignant development and progression, specific inhibitors targeting this co‐alteration are lacking. We performed a pan‐cancer analysis to characterize the biology of TP53/RB1 co‐alterations and identify therapeutic strategies. We analyzed mutation data and copy number variation (CNV) data from 42 371 pan‐cancer samples across 26 cancer types from the cBioPortal database. Among them, 2417 tumors with TP53/RB1 co‐alterations were used for further analysis. We characterized their epidemiology and molecular biology. Therapeutic vulnerabilities of co‐altered tumors were examined using Cancer Cell Line Encyclopedia drug screening datasets. TP53/RB1 co‐alterations occurred in 5.70% of pan‐cancer cases but exhibit striking heterogeneity across cancer types. Patients harboring co‐alterations had significantly shorter…
Genes, proteins, chemicals, diseases, species, mutations and cell lines named across the full text — each resolved to its canonical identifier and authoritative record.
Click any figure to enlarge with its caption.
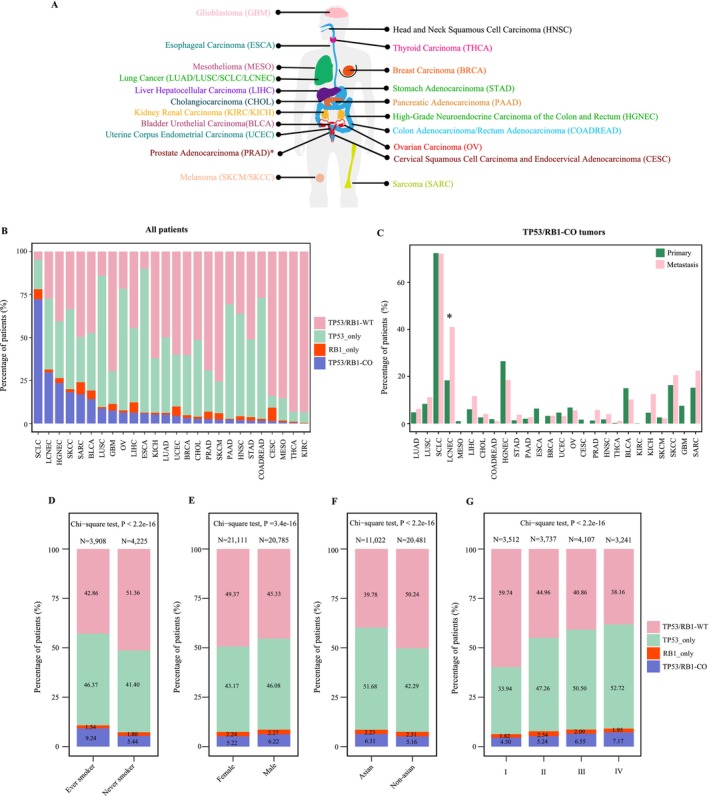 FIGURE 1
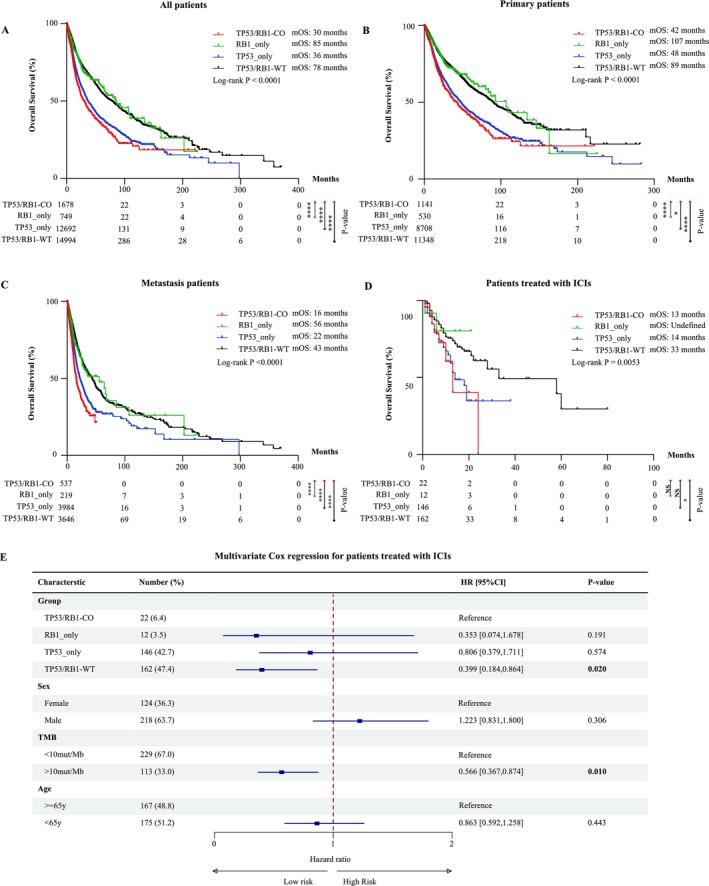 FIGURE 2
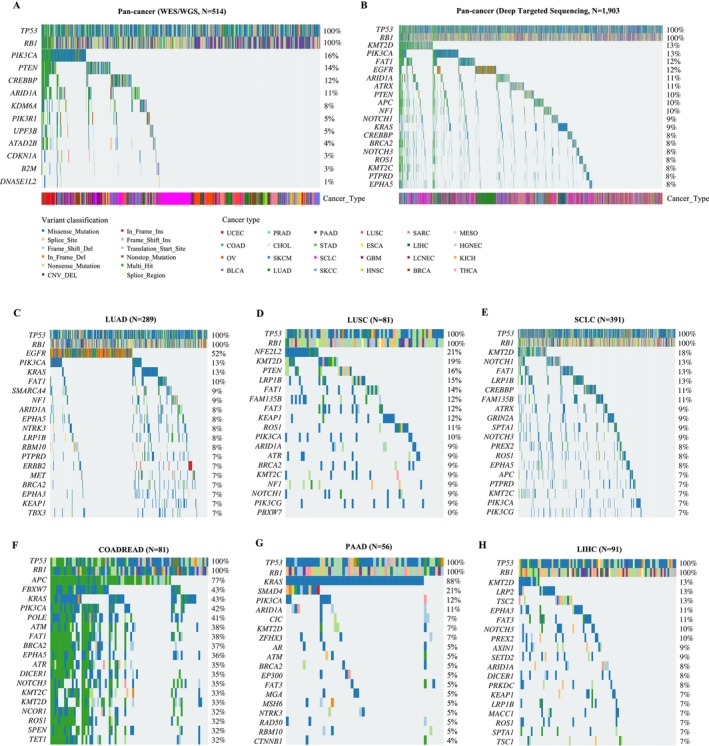 FIGURE 3
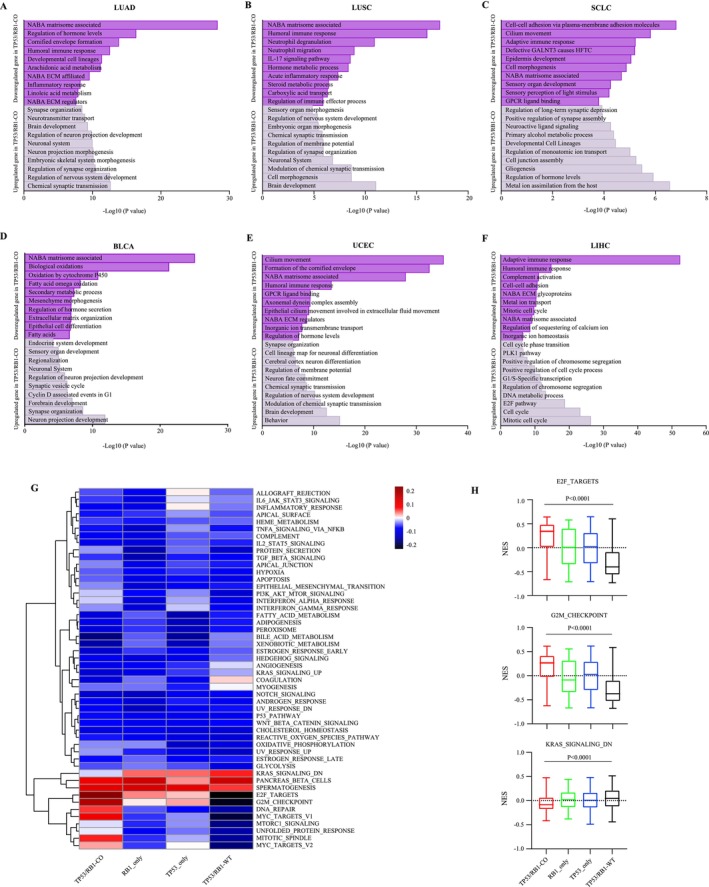 FIGURE 4
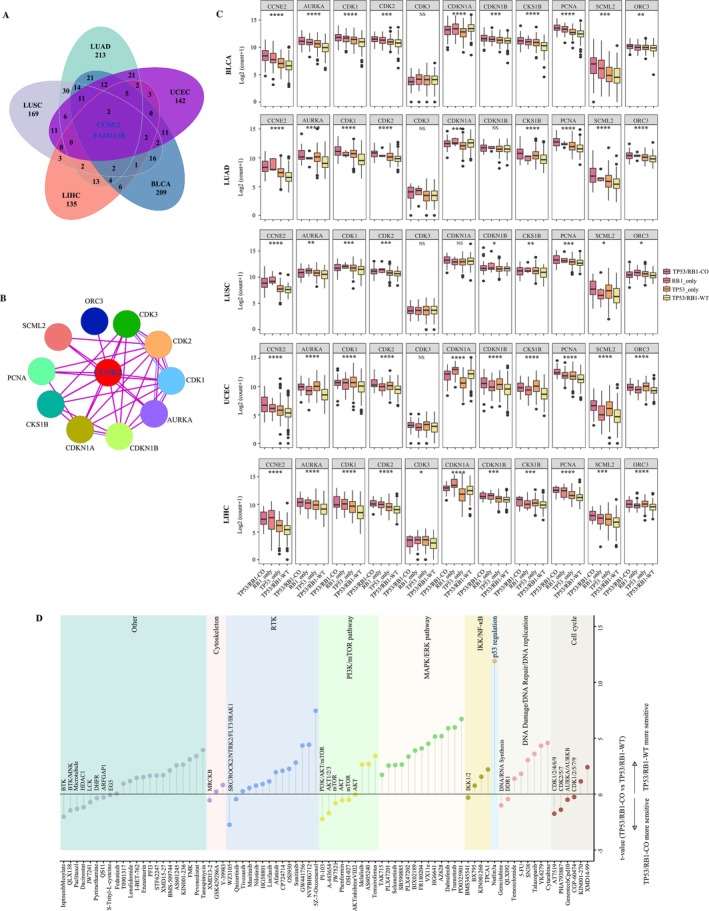 FIGURE 5
| System | Organ | Histological subtypes | Total samples |
| Co‐alteration percentage (%) |
|---|---|---|---|---|---|
| Respiratory | 8835 | 964 | 10.91 | ||
| Lung | LUAD | 6312 | 327 | 5.18 | |
| LUSC | 1411 | 123 | 8.72 | ||
| SCLC | 657 | 475 | 72.30 | ||
| LCNEC | 121 | 36 | 29.75 | ||
| Pleural | MESO | 334 | 3 | 0.90 | |
| Digestive | 13 987 | 404 | 2.89 | ||
| Liver | LIHC | 1667 | 105 | 6.30 | |
| CHOL | 979 | 27 | 2.76 | ||
| Colorectal | COADREAD | 5443 | 89 | 1.64 | |
| HGNEC | 106 | 25 | 23.58 | ||
| Stomach | STAD | 2029 | 34 | 1.68 | |
| Pancreas | PAAD | 2662 | 60 | 2.25 | |
| Esophagus | ESCA | 1101 | 64 | 5.81 | |
| Reproductive | 11 129 | 421 | 3.78 | ||
| Breast | BRCA | 4213 | 137 | 3.25 | |
| Uterus | UCEC | 1801 | 79 | 4.39 | |
| Ovary | OV | 2026 | 128 | 6.32 | |
| Cervical | CESC | 400 | 6 | 1.50 | |
| Prostate | PRAD | 2689 | 71 | 2.64 | |
| Head and neck | 1781 | 20 | 1.12 | ||
| Head and neck | HNSC | 759 | 15 | 1.98 | |
| Thyroid | THCA | 1022 | 5 | 0.49 | |
| Urinary | 3018 | 246 | 8.15 | ||
| Bladder | BLCA | 1688 | 240 | 14.22 | |
| Kidney | KIRC | 1235 | 1 | 0.08 | |
| KICH | 95 | 5 | 5.26 | ||
| Skin | Skin | 1337 | 58 | 4.34 | |
| SKCM | 1167 | 27 | 2.31 | ||
| SKCC | 170 | 31 | 18.24 | ||
| Nervous | Brain | GBM | 889 | 67 | 7.54 |
| Soft Tissue | Soft tissue | SARC | 1395 | 237 | 16.99 |
| Total | 42 371 | 2417 | 5.70 |
- —Science and Technology Program of Guangzhou
- —National Natural Science Foundation of China10.13039/501100001809
Peer Reviews
No public reviews on file for this paper yet. If you reviewed it on a platform where reviews are public (OpenReview, ICLR, NeurIPS, ICML), you can paste yours below so the community can read it here.
Videos
No videos yet. Explain this paper in a talk, walkthrough, or lecture? Add one.
Taxonomy
TopicsCancer-related Molecular Pathways · Microtubule and mitosis dynamics · Protein Degradation and Inhibitors
Introduction
1
The tumor suppressor functions of TP53 and RB1 in preserving genomic stability and regulating cell cycle progression are well‐established across a wide spectrum of human malignancies. Genetic alterations in these genes critically promote malignant initiation and progression. In particular, TP53 mutation (especially missense mutation) leads not only to loss of canonical tumor suppressive function, but may also confer gain‐of‐function properties that enhance tumor cell survival, invasiveness, and metastatic potential [1]. Similarly, RB1 regulates the G1/S cell cycle checkpoint by inhibiting E2F transcription factors; its inactivation disrupts this regulatory axis, leading to uncontrolled cell cycle progression [2]. Importantly, TP53/RB1 co‐alteration synergistically disrupts DNA damage response and cell cycle regulation, thereby fostering genomic instability, uncontrolled proliferation, and accelerating malignant transformation and tumor evolution [2, 3].
A comprehensive pan‐cancer study has revealed that TP53/RB1 co‐alteration is the most prevalent co‐occurring genetic alteration across diverse cancer types, with particularly high frequencies in small‐cell carcinomas, neuroendocrine carcinomas, and sarcomas (SARCs) [4]. This co‐alteration is especially prevalent in small cell lung cancer (SCLC), where it occurs in approximately 59%–90% of cases and is regarded as a defining molecular event essential for SCLC pathogenesis [5, 6, 7]. Mechanistically, dual‐inactivation of TP53 and RB1 drives neuroendocrine transdifferentiation, contributing to the distinct morphological characteristics of SCLC [8]. Beyond SCLC, a systematic review revealed significant prevalence in other neuroendocrine cancers. Notably, TP53/RB1 co‐alteration occurs in ~36% of pulmonary large cell neuroendocrine carcinoma (LCNEC) and ~35% of extra‐thoracic LCNEC patients [9]. Similarly, neuroendocrine prostate cancer exhibits a high incidence of this co‐alteration, with a reported prevalence of approximately 53.3% of cases [10].
Accumulating evidence indicates that tumors with concurrent loss of TP53 and RB1 exhibit a markedly increased propensity for transdifferentiating into small‐cell neuroendocrine tumor (SCNC). In EGFR‐mutant lung adenocarcinoma (LUAD), the combined inactivation of TP53 and RB1 significantly elevates the risk of small‐cell transformation following the development of resistance to EGFR tyrosine kinase inhibitors [3], while loss of RB1 alone is insufficient to induce neuroendocrine differentiation [11]. Importantly, this transdifferentiation potential is not confined to lung cancer. Both prostate and urothelial cancers exhibit similar small‐cell transformation upon the loss of TP53 and RB1. In prostate cancers, the dual loss of TP53 and RB1 promotes lineage plasticity in vitro and facilitates transdifferentiation to SCNC in vivo [12, 13], while in urothelial cancers, TP53 and RB1 loss occurring after the initial tumorigenesis is essential for the transdifferentiation into bladder small‐cell carcinoma [14]. Collectively, these findings across multiple cancer types strongly suggest that TP53/RB1 co‐alteration is a convergent molecular program driving lineage plasticity and transdifferentiation to small‐cell neuroendocrine carcinoma in epithelial tumors.
Clinical evidence consistently links TP53/RB1 co‐alterations to poor prognosis across key epithelial cancers, including EGFR‐mutant LUAD and prostate cancer [3, 15]. Given their adverse clinical implications, deciphering the molecular consequences of these co‐alterations is critical for developing targeted therapies aimed at improving outcomes in high‐risk patients. In this study, we conducted a comprehensive pan‐cancer analysis to delineate shared and cancer type‐specific molecular programs orchestrated by TP53/RB1 co‐alterations across diverse malignancies and to identify actionable therapeutic vulnerabilities associated with these alterations.
Materials and Methods
2
Data Acquisition
2.1
This study utilized publicly available data. The mutation data and copy number variation data from 42 371 pan‐cancer samples across 26 cancer types were obtained from the cBioPortal (https://www.cbioportal.org/), which integrates datasets from the European Genome‐phenome Archive (EGA) (whole‐genome sequencing, WGS), The Cancer Genome Atlas (TCGA) (WGS or whole‐exome sequence, WES), and Memorial Sloan Kettering Cancer Center (MSKCC) (deep targeted sequencing). The paired transcriptome data from TCGA datasets (RNA‐seq). Mutation data of 1739 cancer cell lines and paired drug screening data of 1067 cancer cell lines were taken from the CCLE (https://portals.broadinstitute.org/ccle).
Identification of TP53/RB1 Co‐Alterations
2.2
A somatic variant was removed if it met the following criteria: (1) synonymous or UTR variants; (2) the nonsilent mutations with < 2% mutation frequency. According to TP53 and RB1 alteration status (including point mutations, deletions, insertions, splice mutations, and copy number arm‐level losses), tumors were named as four genotypes: TP53/RB1 co‐alteration (TP53/RB1‐CO), RB1 alteration alone (RB1_only), TP53 alteration alone (TP53_only), and TP53/RB1 wildtype (TP53/RB1‐WT). The MutSigCV (v.1.41) [16] was applied to identify significantly mutated driver genes using a cutoff of false discovery rate < 0.1 for WGS/WES data. Finally, 2417 TP53/RB1 co‐altered tumors were used for further analysis.
Differential Expression Analysis, Functional Enrichment Analysis, and Protein–Protein Interaction Network Analysis
2.3
We used DESeq2 to identify differentially expressed genes (DEGs) between TP53/RB1‐CO and non‐TP53/RB1‐CO tumors. The genes with |log2 fold change| > 1 and an adjusted p < 0.05 (Benjamini–Hochberg correction) were considered DEGs. Functional enrichment analysis was performed using Metascape [17] (http://metascape.org), a free web‐based portal that supports efficient data‐driven gene prioritization for multiple gene lists. Differentially expressed genes were uploaded to Metascape. Single‐sample gene set enrichment analysis (ssGSEA) was performed to determine enrichment scores for the 50 hallmark gene sets from the Molecular Signatures Database (MSigDB) using R package GSVA [18, 19]. The protein–protein interaction (PPI) network analysis was performed using the STRING database (https://string‐db.org/).
Statistical Analysis
2.4
Chi‐square testing was used for p value calculations across categorical variables, while the two‐sided Mann–Whitney U test was used across continuous variables. One‐way ANOVA was used to compare the differences in gene expression across four genotypes. Log rank test was used for comparison of survival distributions in Kaplan–Meier plots. Statistical analyses were conducted using R (version 4.5.0, https://www.r‐project.org/), SPSS (version 27.0, IBM, Armonk, NY, USA), and GraphPad Prism (version 9, GraphPad Software, La Jolla, CA, USA).
Results
3
TP53/RB1 Co‐Alterations Across Various Tumors
3.1
To determine the frequency of TP53/RB1 co‐alterations across various tumors, we analyzed somatic mutation data and copy number variation data from 42 371 pan‐cancer samples spanning 26 distinct cancer types, covering malignancies of the respiratory, digestive, reproductive, and urinary systems, among others (Figure 1A; Table 1). TP53/RB1 co‐alterations were identified in 2417 out of the 42 371 pan‐cancer samples (5.70%). The prevalence of these co‐alterations varied significantly across different cancer types. A particularly high frequency of TP53/RB1 co‐alteration was observed in respiratory system tumors (964/8835 cases, 10.91%), with the highest frequency observed in SCLC (475/657 cases, 72.30%), followed by LCNEC (36/121 cases, 29.75%), lung squamous cell carcinoma (LUSC) (123/1411 cases, 8.72%), and LUAD (327/6312 cases, 5.18%). In urinary system tumors, the frequency of co‐alteration was 14.22% in bladder urothelial (BLCA), 5.26% in chromophobe renal cell carcinoma (KICH), and 0.08% in clear cell renal cell carcinoma (KIRC). Notably, elevated co‐alteration rates were also found in other neuroendocrine carcinomas besides LCNEC, such as high‐grade neuroendocrine carcinoma (HGNEC) (23.58%). Additional tumor types exhibiting relatively high TP53/RB1 co‐alteration frequencies included skin cutaneous carcinoma (SKCC) (18.24%), SARC (16.99%), glioblastoma multiforme (GBM) (7.54%), liver hepatocellular carcinoma (LIHC) (6.30%), and esophageal carcinoma (ESCA) (5.81%) (Table 1).
The distribution of different TP53/RB1 alteration status in pan‐cancer. (A) Schematic overview of the pan‐cancer in our cohort. (B) The proportional distribution of four TP53/RB1 alteration genotypes across 26 cancer types. (C) The proportional distribution of TP53/RB1 co‐alteration between primary and metastasis samples. (D–G) The proportional distribution of different TP53/RB1 alteration status (D) in ever‐smokers and never‐smokers, (E) in females and males, (F) in Asian and non‐Asian patients, and (G) across tumor stages. p values were calculated by chi‐square test.
We next investigated the proportional distribution of TP53/RB1 alteration status across 26 cancer types. In most cancer types, the number of samples harboring TP53/RB1 co‐alterations was substantially higher than those with RB1 alterations alone, whereas *TP53‐*only alterations were prevalent overall (Figure 1B). Across most cancer types, the frequency of TP53/RB1 co‐alterations was comparable between primary and metastatic tumors (Figure 1C). In contrast, a significantly elevated frequency was observed in metastatic versus primary LCNEC samples (p = 0.0004).
When assessing the relationship between TP53/RB1 alteration status and clinicopathological characteristics, a significantly higher frequency of co‐alterations was observed in smokers compared to nonsmokers (9.24% vs. 5.44%, Figure 1D). In contrast, sex and race showed only weak associations with TP53/RB1 co‐alteration status: males versus females (6.22% vs. 5.22%) and Asians versus non‐Asians (6.31% vs. 5.16%) (Figure 1E,F). Notably, the frequencies of TP53/RB1 co‐alterations and *TP53‐*only alterations were higher in tumors of advanced stages (Stages III and IV), whereas TP53/RB1‐WT frequencies were significantly higher in early‐stage tumors (Stage I) compared to Stages II, III, and IV (Figure 1G).
TP53/RB1 Co‐Alteration Is Associated With Poor Clinical Outcomes
3.2
To explore the prognostic significance of concurrent TP53/RB1 alterations, we investigated the correlation between four genotypic subgroups (based on TP53 and RB1 mutation status) and the prognosis of patients across a pan‐cancer cohort. Patients with co‐alterations had statistically significant shorter median OS (mOS) compared to all other groups in pan‐cancer patients (Figure 2A). This adverse prognostic effect persisted when stratifying patients by sample type (primary cohort vs. metastasis cohort), where co‐altered cases consistently demonstrated inferior mOS in both primary and metastatic samples (Figure 2B,C). Notably, patients with TP53/RB1‐WT or *RB1‐*only alterations exhibited markedly longer mOS compared to those with co‐alterations or TP53‐only alterations. These data suggest that TP53/RB1 co‐alteration may serve as a poor prognostic marker across diverse tumor types.
*The effect of different TP53/RB1 alteration status on OS. (A) Kaplan–Meier curves for OS in all patients, stratified by TP53/RB1 alteration status. The log rank test (B, C) Kaplan–Meier curves for OS in primary patients (B) and metastasis patients (C). (D) Kaplan–Meier curves for OS in patients treated with ICIs. (E) Table and forest plot showing the results of multivariate COX regression analysis of TP53/RB1 alteration status and clinicopathological variables in patients treated with ICIs. Hazard ratios are presented with their 95% confidence interval. p values of statistical significance are represented as *p < 0.05, **p < 0.01, ***p < 0.001, and ***p < 0.0001.
We further assessed the impact of TP53 and RB1 alteration status on clinical response to immune checkpoint inhibitors (ICIs). Surprisingly, it was found that patients with co‐alterations had the shortest mOS (13 months) (Figure 2D), despite the fact that patients with co‐alterations harbor an intermediate to high tumor mutation burden (TMB) (Figure S1). Conversely, patients with TP53/RB1‐WT demonstrated the longest mOS (33 months). Due to the limited number of patients with RB1‐only alterations (n = 10), mOS could not be estimated for this group. Multivariate Cox regression analysis demonstrated that the TP53 and RB1 alteration status may independently predict clinical response to ICIs, alongside previously established markers such as TMB (Figure 2E).
Tissue‐Specific Mutational Landscapes in TP53/RB1 Co‐Altered Tumors
3.3
To characterize the mutational landscapes of TP53/RB1 co‐altered tumors, we investigated somatic mutations and copy number variation using WES/WGS, targeted deep sequencing datasets, and copy number variation arrays. With pooling gene alterations across 514 patients with TP53/RB1 co‐alterations in the WES/WGS cohort, we identified 11 driver mutations besides TP53 and RB1. Of these, the most frequently co‐altered genes were PIK3CA (16%), PTEN (14%), CREBBP (12%), and ARID1A (11%) (Figure 3A). A similar mutational profile was observed in the targeted deep sequencing dataset of TP53/RB1 co‐altered tumors, with frequent co‐alterations in PIK3CA (13%), PTEN (10%), CREBBP (8%), and ARID1A (11%) (Figure 3B). It is important to note that these recurrent co‐occurring alterations predominantly involve genes implicated in chromatin remodeling (CREBBP, ARID1A) and the PI3K signaling pathway (PIK3CA, PTEN). In addition, frequently co‐altered genes in TP53/RB1 co‐altered tumors included KMT2D (13%), FAT1 (12%), EGFR (12%), ATRX (11%), and APC (10%).
Mutational landscape of TP53/RB1 co‐altered tumors. (A, B) Pan‐cancer landscape detected by (A) WES/WGS and (B) deep targeted sequencing, respectively. (C–G) Mutational landscape in specific tumor types: (C) LUADs, (D) LUSC, (E) SCLC, (F) COADREAD, (H) PAAD, and (G) LIHC.
Next, we investigated tissue‐specific mutational landscapes in TP53/RB1 co‐altered tumors of various cancer types. EGFR mutations were identified in nearly 52% of TP53/RB1 co‐altered LUAD (Figure 3C), suggesting that EGFR/TP53/RB1 triple‐mutant tumors may define a highly plastic subset with potential for SCLC transdifferentiate [20]. Other frequently mutated genes in TP53/RB1‐mutant LUADs included PIK3CA (13%) and KRAS (13%). It is important to note that TP53/RB1 co‐altered LUSC and SCLC exhibited similar frequencies of genomic alterations in KMT2D, FAT1, and LRP1B (Figure 3D,E). However, NFE2L2 (21%) and PTEN (16%) mutations were more frequent in LUSC, whereas NOTCH1 (13%) and CREBBP (11%) alterations were more common in SCLC.
Besides thoracic malignancies, distinct co‐alteration patterns were also observed in gastrointestinal tumors. In TP53/RB1 co‐mutant colon adenocarcinoma and rectum adenocarcinoma (COADREAD), highly recurrent genomic alterations were identified in a core set of genes, including APC (77%), FBXW7 (43%), KRAS (43%), PIK3CA (42%), and POLE (41%) (Figure 3F). In TP53/RB1 co‐altered pancreatic adenocarcinoma (PAAD), KRAS mutations were nearly ubiquitous (88%), and a notable rate of mutations was noticed in SMAD4 (21%) (Figure 3G). In hepatocellular carcinoma (LIHC), TP53/RB1 co‐altered tumors frequently harbored concurrent KMT2D (13%) and LRP2 (13%) alterations (Figure 3H). Tissue‐specific mutational landscapes were also observed in other cancer types (Figure S2).
TP53/RB1 Co‐Altered Tumors Exhibit Distinct Biological Pathways
3.4
To identify the biological differences between the TP53/RB1 co‐altered and non‐co‐altered tumors, we performed gene set enrichment analyses based on DEGs. Across the majority of tumor types, TP53/RB1 co‐altered tumors were significantly enriched for gene sets related to neuronal development and cell cycle progression, whereas those related to extracellular matrix (NABA matrisome associated) and to immune response and inflammation were consistently de‐enriched gene sets (Figure 4A–F and Figure S3).
Biological pathways in TP53/RB1 co‐altered tumors. (A–F) Pathway enrichment analysis for up‐ and downregulated genes in TP53/RB1 co‐altered tumors compared with non‐co‐altered tumors based on KEGG, Reactome, and GO gene sets. Significantly enriched pathways in (A) LUAD, (B) LUSC, (C) SCLC, (D) BLCA, (E) UCEC, and (F) LIHC. (G) Heatmap of GSEA normalized enrichment score (NES) for hallmark gene sets among four TP53/RB1 alteration genotypes. (H) Comparison of NES for selected gene sets (E2F_targets, G2M_checkpoint, and KRAS_signaling_dn) among four TP53/RB1 alteration genotypes. p values were calculated by one‐way ANOVA.
Next, we performed ssGSEA using the 50 hallmark gene sets based on total gene expression to investigate the underlying biological features of the four genotypes. Similarly, gene sets related to E2F_targets, G2M_checkpoint, DNA_repair, MYC_targets, and MITOTIC_spindle were significantly enriched in TP53/RB1 co‐altered tumors (Figure 4G,H). These results suggest that biological processes governing cancer cell behavior differ substantially across different TP53/RB1 genotypes and that TP53/RB1 co‐altered tumors tend to activate specific sets of oncogenic pathways across cancer types.
TP53/RB1 Co‐Altered Tumors Possess Potential Therapeutic Vulnerabilities
3.5
Given the poor prognosis associated with TP53/RB1 co‐altered tumors, identifying novel genotype‐specific therapeutic targets is of high clinical relevance. We first identified commonly upregulated genes in TP53/RB1 co‐altered tumors across LUAD, LUSC, BLCA, UCEC, and LIHC, revealing CCNE2 and FAM111B as consistently overexpressed candidates (Figure 5A). CCNE2, a critical regulator of the G1/S cell cycle transition and an oncogene implicated in multiple cancers [21], was prioritized for further analyses. To explore its druggable potential, we constructed a PPI network using the STRING database, identifying 10 direct interactors: AURKA, CDK1, CDK2, CDK3, CDKN1A, CDKN1B, CKS1B, PCNA, SCML2, and ORC3 (Figure 5B). Notably, most interactors exhibited significantly elevated expression in TP53/RB1 co‐altered tumors compared to other genotypes (Figure 5C), highlighting a coordinated activation of cell cycle‐related proteins.
*Potential therapeutic vulnerabilities of TP53/RB1 co‐altered tumors. (A) Venn diagram of overlapping genes across TP53/RB1 co‐altered tumors from LUAD, LUSC, BLCA, UCEC, and LIHC. (B) Protein–protein interaction network highlighting CCNE2 and its 10 interactors. (C) Expression levels of CCNE2 and its interactors across four TP53/RB1 alteration genotypes from LUAD, LUSC, BLCA, UCEC, and LIHC. (D) Differential drug sensitivity between TP53/RB1‐CO and TP53/RB1‐WT cancer cell lines. The t value from t‐test of IC50 values of TP53/RB1‐CO versus TP53/RB1‐WT cancer cell lines. p values of statistical significance are represented as *p < 0.05, **p < 0.01, ***p < 0.001, and ***p < 0.0001.
To investigate potential therapeutic vulnerabilities of TP53/RB1 co‐altered tumors, we leveraged CCLE drug screening datasets comprising 266 compounds. This analysis identified 80 compounds with differential efficacy between co‐altered and TP53/RB1‐WT tumors (Figure 5D; Table S1). Co‐altered tumors showed increased sensitivity to cell cycle inhibitors, including CDK inhibitors (AT7519, PHA793887, CGP60474), AURKA/AURKB inhibitor (GenentechCpd10), as well as agents targeting the PI3K/mTOR pathway (Figure 5D). In contrast, co‐altered tumors exhibited resistance to receptor tyrosine kinase (RTK) inhibitors and MAPK/ERK pathway inhibitors, such as Trametinib and Dabrafenib (Figure 5D). Collectively, these findings highlight the unique therapeutic vulnerabilities of TP53/RB1 co‐altered tumors and suggest that targeting cell cycle and PI3K/mTOR signaling pathways may represent effective treatment strategies in this high‐risk cancer subgroup.
Discussion
4
TP53/RB1 co‐alterations are recurrently detected across a wide spectrum of cancer types and act synergistically to promote unrestricted proliferation, loss of G1/S checkpoint controls, and replication stress. Although direct therapeutic targeting of TP53 and RB1 remains challenging due to the nature of their loss‐of‐function mutations, interventions aimed at mitigating their downstream effects hold considerable therapeutic promise. In this study, we performed a comprehensive pan‐cancer analysis to elucidate the molecular and clinical impact of TP53/RB1 co‐aberrations, paving the foundation for developing novel therapeutic strategies.
This large‐scale pan‐cancer analysis reveals that TP53/RB1 co‐alterations occur in approximately 5.70% of pan‐cancer, though exhibiting striking heterogeneity across histology. The prevalence of these co‐alterations is exceptionally high in SCLC and other neuroendocrine carcinomas (e.g., LCNEC and HGNEC). Beyond neuroendocrine tumors, significantly elevated frequencies were also observed in SKCC, SARC, BLCA, and GBM, suggesting these co‐alterations as a potential oncogenic driver in diverse contexts. Interestingly, elevated co‐alteration rates in metastatic LCNEC imply that these alterations may promote metastatic fitness.
Of particular relevance is the impact of TP53/RB1 co‐alteration on clinical outcomes. Consistent with prior reports, TP53/RB1 co‐alterations are consistently associated with poor clinical outcomes across solid tumors [2, 4, 22]. Importantly, our results confirm that this adverse prognostic association persists in both primary and metastatic disease, underscoring their driving role to confer aggressive biological behavior independent of stage. Notably, the adverse association of these co‐alterations with OS is recalled in patients receiving immunotherapy, despite exhibiting intermediate‐to‐high TMB. We hypothesize that this impaired immunotherapy response may stem from an immunosuppressive tumor microenvironment, as previous research has linked loss of TP53 and RB1 with diminished immune infiltration [23]. Nevertheless, further mechanistic studies are required to elucidate how TP53/RB1 co‐alterations drive immune evasion and resistance to immunotherapy.
Our comprehensive genomic profiling reveals a convergent mutational landscape in TP53/RB1 co‐altered tumors, characterized by frequent alterations in chromatin remodeling and PI3K signaling pathways, suggesting TP53/RB1 loss drives tumor progression through broader oncogenic programs beyond core cell cycle dysregulation [24]. The dual‐inactivation of TP53 and RB1 initiates epigenetic reprogramming events through upregulation of key regulators such as EZH2 and SOX2, fostering a stem cell‐like epigenetic state that ultimately drives tumor development and progression [12]. Notably, tissue‐specific mutational patterns were observed in TP53/RB1 co‐altered tumors, demonstrating their biological diversity. For instance, most TP53/RB1 co‐altered LUADs harbor EGFR mutations as well. Consistent with previous studies, LUAD tumors harboring EGFR/TP53/RB1 co‐alterations are more likely to undergo SCLC transdifferentiation into SCLC [22], a phenotypic switch contributing to acquired resistance to EGFR inhibitors [25]. Further studies are needed to better elucidate the molecular mechanisms underlying EGFR/TP53/RB1 co‐alterations in modulating neuroendocrine differentiation and lineage plasticity.
TP53/RB1 co‐altered SCLCs are enriched with co‐occurring alterations in NOTCH1 (neuroendocrine suppressor) and CREBBP (epigenetic regulator), in line with their neuroendocrine identity [26, 27]. TP53/RB1 co‐altered COADREADs display high mutation rates in components of the Wnt (APC) and Ras (KRAS and FBXW7) signaling pathways. Similarly, TP53/RB1 co‐altered PAADs are nearly ubiquitously driven by KRAS mutation, with a notable subset also harboring SMAD4 mutations, implicating TGF‐β pathway disruption. Across multiple tumor types, TP53 and RB1 co‐alteration upregulates pathways involved in the cell cycle, DNA damage repair, and neuron development and function. The enrichment of neuronal development and function pathways may directly reflect the activation of the transcriptional program driving neuroendocrine transdifferentiation. However, significant upregulation of neuronal development and function pathways was not observed in TP53/RB1 co‐altered neuroendocrine tumors (such as SCLC). A possible explanation is that the intrinsic neuroendocrine properties in these tumors are not solely dictated by TP53 and RB1 inactivation. Although these mutations are characteristic of neuroendocrine tumors, particularly those with small cell or large cell histology, they do not fully account for the neuroendocrine phenotype. Functional validation studies are needed to establish causality between TP53/RB1 co‐alterations and neuronal pathway activation.
While no current therapies directly target TP53 and RB1 co‐alterations, targeting their downstream effectors is a promising therapeutic strategy—particularly DNA repair and cell cycle regulators [28]. Preclinical evidence suggests that combined inhibition of PARP and ATR significantly suppresses the growth of TP53/RB1 co‐altered prostate cancer cells [2]. In addition, CHK1 inhibitors may be effective, as TP53/RB1 loss leads to compensatory upregulation of the ATR/CHK1 pathway in preclinical studies, which tumor cells depend on to enforce the G2/M checkpoint for DNA damage repair [29].
In this study, we identified CCNE2 as a gene consistently upregulated across multiple TP53/RB1 co‐altered tumors, including LUAD, LUSC, BLCA, LIHC, and UCEC. CCNE2 plays a crucial role in regulating the cell cycle, specifically at the G1/S transition [30], and its dysregulation can drive uncontrolled proliferation and oncogenesis [31]. Overexpression of CCNE2 directly induces hyperactivation of CDK2, and their interactions promote the formation of the CCNE2/CDK2 complex, which promotes the G1/S transition of the cell cycle [21]. Although no specific inhibitors of CCNE2 currently exist, CDK2 inhibitors have shown efficacy in suppressing the proliferation of CCNE2‐overexpressing breast cancer cells. The upregulation of both CCNE2 and CDK2 in TP53/RB1 co‐mutant tumors suggests that the CCNE2–CDK2 axis is a therapeutically targetable vulnerability, as corroborated by drug screening from the CCLE (Figure 5D). In addition, TP53/RB1 co‐altered tumors showed increased sensitivity to AURKA inhibitors, potentially attributable to high AURKA expression. It is important to note that TP53/RB1 co‐altered tumors also showed heightened sensitivity to PI3K/mTOR inhibition, consistent with a genomic landscape enriched for alterations in the PI3K signaling pathway.
Our study has several limitations. First, the analyzed data were retrieved from multiple publicly available datasets. Due to variations in sequencing platforms (WES/WGS, targeted panels), depth of coverage, and bioinformatic pipelines for mutation calling may introduce bias in mutation detection of TP53 and RB1. Second, although TP53/RB1 co‐inactivation is a hallmark of neuroendocrine tumorigenesis, it is also frequently detected in non‐neuroendocrine tumors. Due to the limited number of neuroendocrine tumor samples in our cohort, we were unable to conduct a comparative analysis of the effects of TP53/RB1 co‐alteration in neuroendocrine versus non‐neuroendocrine tumors. Third, due to incomplete clinical information, the multivariate Cox model for evaluating ICI response only included a limited set of variables, including TMB, TP53/RB1 alteration status, sex, and age. Additional factors such as PD‐L1 expression, prior therapies, and immune cell infiltration, which may influence ICI response, were not accounted for. Future clinical studies in larger, well‐annotated patient cohorts will be essential to validate and expand upon these findings.
Author Contributions
Study concept and design: Xuetao Li, Jun Hou, and Shuquan Wei. Analysis and interpretation of data: Xuetao Li. Statistical analysis: Xuetao Li and Meifeng Ye. Drafting of the manuscript: Xuetao Li, Jun Hou, and Shuquan Wei. Critical revision of the manuscript for important intellectual content: Zhuxiang Zhao and Zhong‐Yin Huang. Obtained funding: Shuquan Wei. Study supervision: Jun Hou and Shuquan Wei. All authors had full access to the data in the study and take responsibility for the integrity of the data and the accuracy of the data analysis. All authors read and approved the final manuscript.
Funding
This work was supported by Science and Technology Program in Guangzhou (Grant number 2024A03J0960) and National Natural Science Foundation of China (Grant Number 82400118).
Ethics Statement
The authors have nothing to report.
Conflicts of Interest
The authors declare no conflicts of interest.
Supporting information
Figure S1: Comparison of TMB across four TP53/RB1 mutation genotypes. Figure S2: Mutational landscape in specific tumor types: (A) Respiratory system tumor (LCNEC); (B) Digestive system tumors (ESCA, CHOL, HGNEC); (C) Reproductive system tumors (BRCA, UCEC, OV, PRAD); (D) Urinary system tumors (BLCA); (E) GBM; (F) SARC. Figure S3: Pathway enrichment analysis for up‐ and downregulated genes in TP53/RB1 co‐mutated tumors compared with non‐non‐co‐mutated tumors based on KEGG, Reactome, and GO gene sets. Significantly enriched pathways in (A) GBM, (B) SARC.
Table S1: Eighty compounds were found to exhibit differential efficacy between TP53/RB1‐CO and TP53/RB1‐WT tumors.
The reference list from the paper itself. Each links out to its DOI / PubMed record.
- 1K. Sabapathy and D. P. Lane , “Therapeutic Targeting of p 53: All Mutants Are Equal, but Some Mutants Are More Equal Than Others,” Nature Reviews Clinical Oncology 15, no. 1 (2018): 13–30, 10.1038/nrclinonc.2017.151.28948977 · doi ↗ · pubmed ↗
- 2M. D. Nyquist , A. Corella , I. Coleman , et al., “Combined TP 53 and RB 1 Loss Promotes Prostate Cancer Resistance to a Spectrum of Therapeutics and Confers Vulnerability to Replication Stress,” Cell Reports 31, no. 8 (2020): 107669, 10.1016/j.celrep.2020.107669.32460015 PMC 7453577 · doi ↗ · pubmed ↗
- 3M. Offin , J. M. Chan , M. Tenet , et al., “Concurrent RB 1 and TP 53 Alterations Define a Subset of EGFR‐Mutant Lung Cancers at Risk for Histologic Transformation and Inferior Clinical Outcomes,” Journal of Thoracic Oncology 14, no. 10 (2019): 1784–1793, 10.1016/j.jtho.2019.06.002.31228622 PMC 6764905 · doi ↗ · pubmed ↗
- 4L. Cai , R. J. De Berardinis , G. Xiao , J. D. Minna , and Y. Xie , “A Pan‐Cancer Assessment of RB 1/TP 53 Co‐Mutations,” Cancers 14 (2022): 4199.36077736 10.3390/cancers 14174199 PMC 9454436 · doi ↗ · pubmed ↗
- 5J. George , J. S. Lim , S. J. Jang , et al., “Comprehensive Genomic Profiles of Small Cell Lung Cancer,” Nature 524, no. 7563 (2015): 47–53, 10.1038/nature 14664.26168399 PMC 4861069 · doi ↗ · pubmed ↗
- 6A. Lin , N. Zhou , W. Zhu , et al., “Genomic and Immunological Profiles of Small‐Cell Lung Cancer Between East Asians and Caucasian,” Cancer Cell International 22, no. 1 (2022): 173, 10.1186/s 12935-022-02588-w.35488336 PMC 9052616 · doi ↗ · pubmed ↗
- 7J. Hu , Y. Wang , Y. Zhang , et al., “Comprehensive Genomic Profiling of Small Cell Lung Cancer in Chinese Patients and the Implications for Therapeutic Potential,” Cancer Medicine 8, no. 9 (2019): 4338–4347, 10.1002/cam 4.2199.31199602 PMC 6675718 · doi ↗ · pubmed ↗
- 8A. F. Gazdar , P. A. Bunn , and J. D. Minna , “Small‐Cell Lung Cancer: What We Know, What We Need to Know and the Path Forward,” Nature Reviews. Cancer 17, no. 12 (2017): 725–737, 10.1038/nrc.2017.87.29077690 · doi ↗ · pubmed ↗