Fabrication and optimization of magnetic amino-functionalized polyacrylonitrile nanocomposites for enhanced copper removal from aqueous media
Marwa A. Moharram, Mohamed A. Salem, Murat Yılmaz, Mohamed A. Hassaan, Mohamed A. El-Nemr, Ahmed El Nemr

TL;DR
A new magnetic nanocomposite was developed to efficiently remove copper ions from water, showing strong potential for water purification.
Contribution
Development of a magnetic amino-functionalized polyacrylonitrile nanocomposite with optimized copper removal efficiency.
Findings
The nanocomposite achieved a maximum copper removal efficiency of 78.29% at pH 5.5.
The Langmuir isotherm model best described the adsorption behavior with a maximum adsorption capacity of 5.65 mg/g.
Optimization using RSM and an ANN model improved copper removal to 51.51 mg/L with high correlation (R² = 0.996).
Abstract
A magnetic amino polyacrylonitrile nanocomposite (MAPA) was prepared and applied as an adsorbent to eliminate Cu2+ ions from aqueous media through batch experiments. Its physicochemical properties were examined using most known characterization methods. The optimal removal efficiency was obtained at pH 5.5. Adsorption studies were performed under different experimental conditions, considering initial copper concentration, solution pH, and temperature. The maximum removal efficiency attained was 78.29%, while the corresponding maximum adsorption capacity (\documentclass[12pt]{minimal} \usepackage{amsmath} \usepackage{wasysym} \usepackage{amsfonts} \usepackage{amssymb} \usepackage{amsbsy} \usepackage{mathrsfs} \usepackage{upgreek} \setlength{\oddsidemargin}{-69pt} \begin{document}\end{document}) was calculated to be 5.65 mg/g. The…
Genes, proteins, chemicals, diseases, species, mutations and cell lines named across the full text — each resolved to its canonical identifier and authoritative record.
Click any figure to enlarge with its caption.
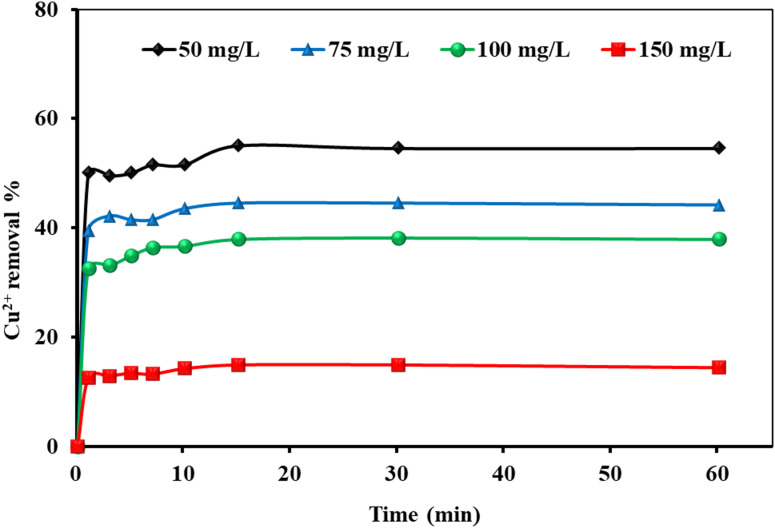 Figure 10
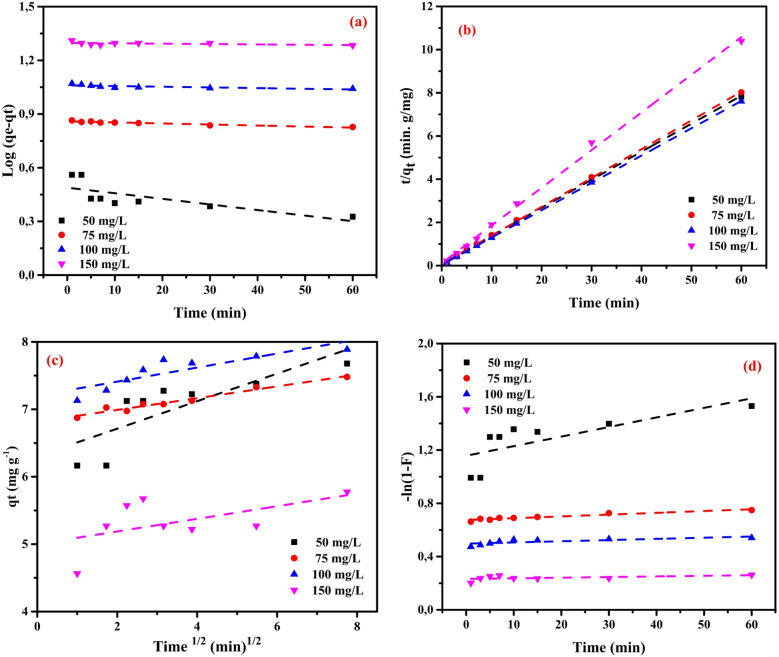 Figure 11
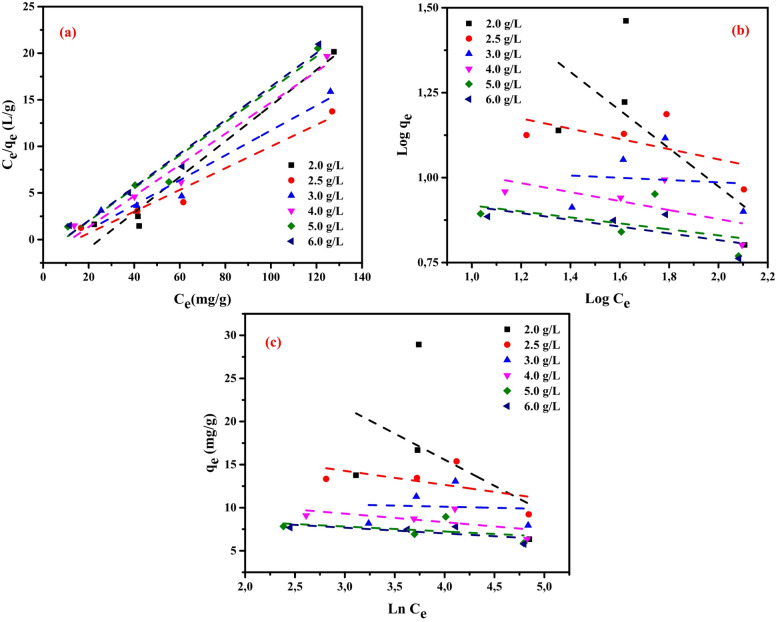 Figure 12
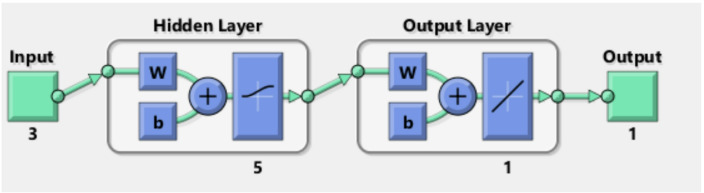 Figure 13
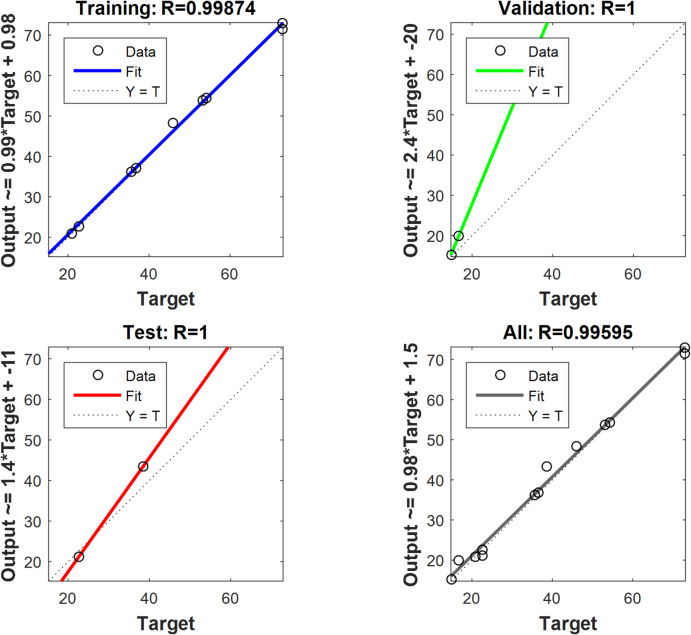 Figure 14
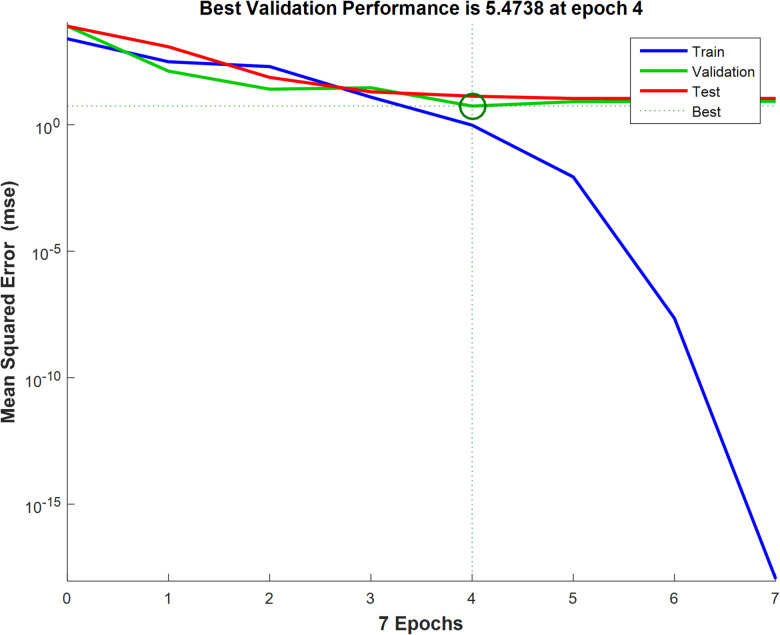 Figure 15
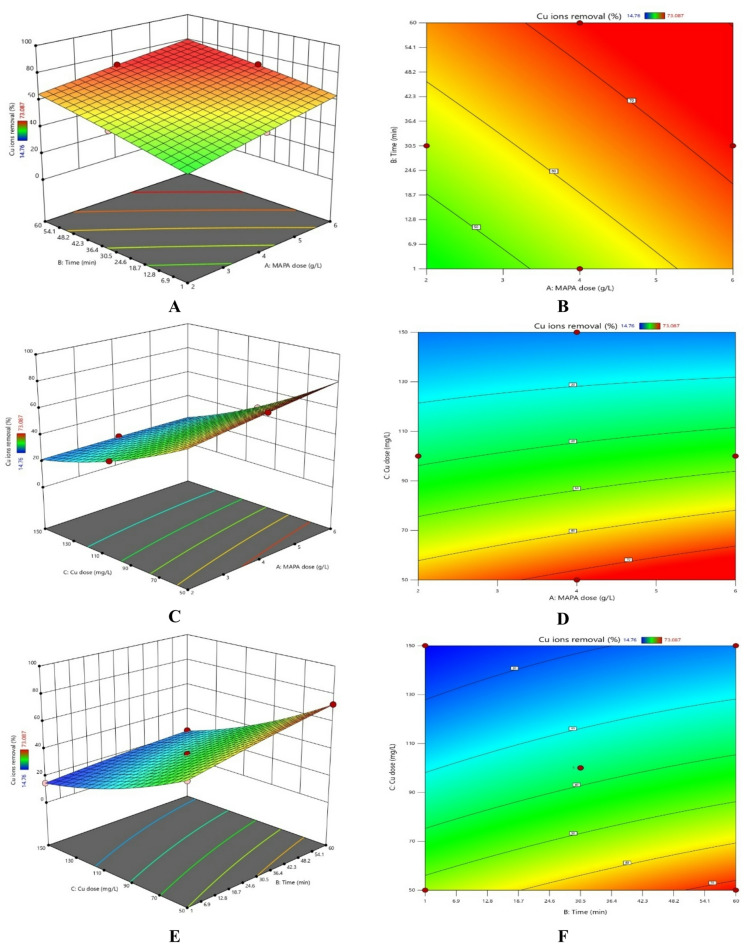 Figure 16
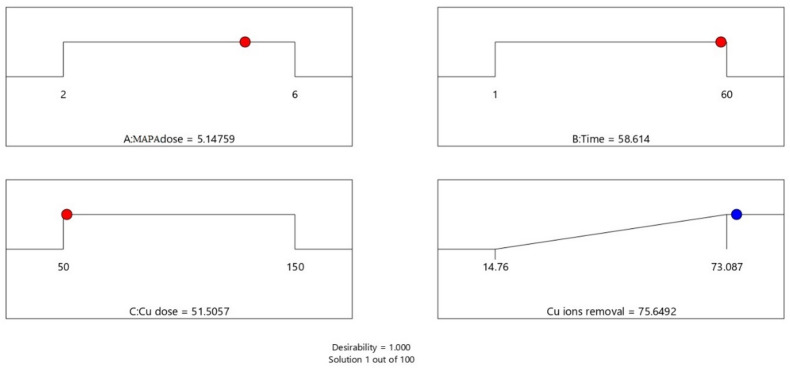 Figure 17
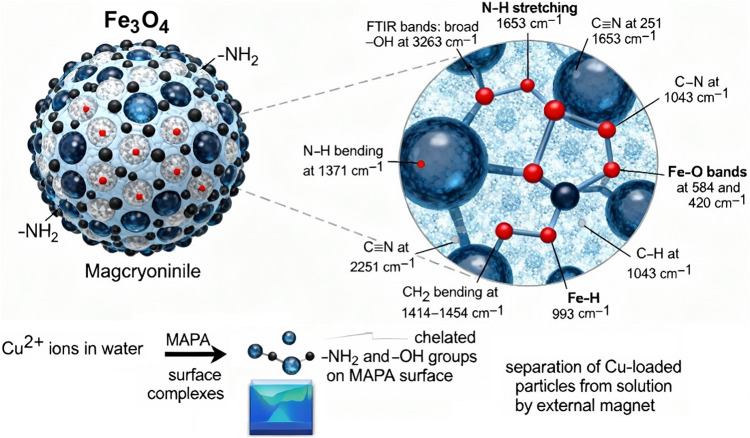 Figure 18
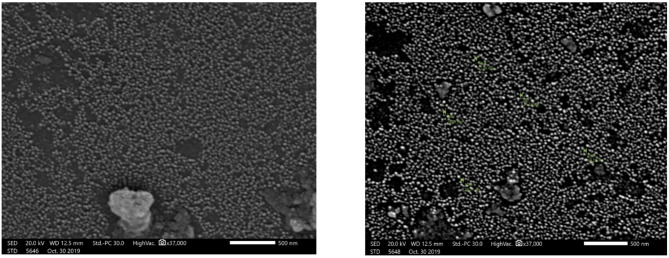 Figure 1
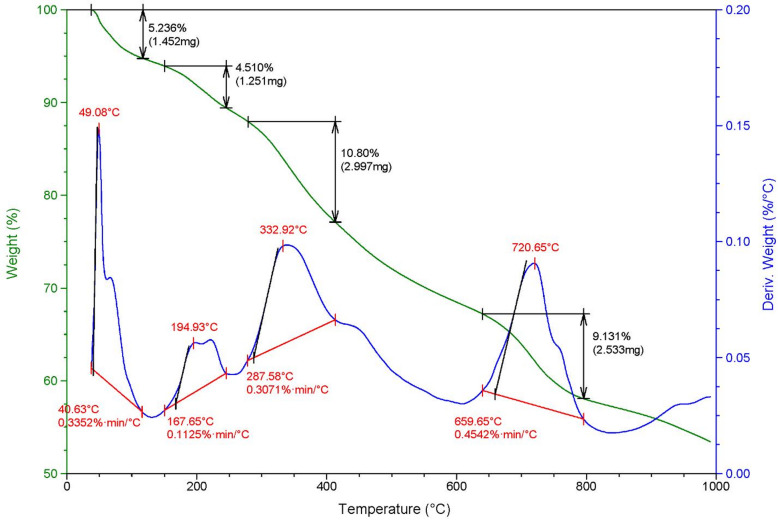 Figure 2
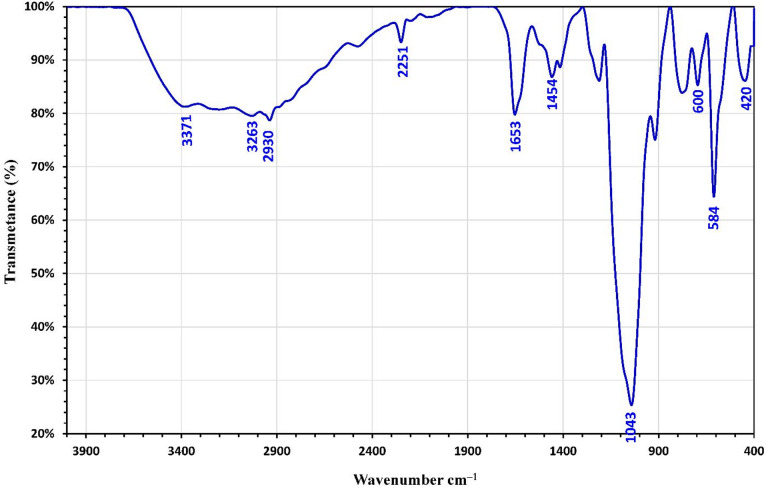 Figure 3
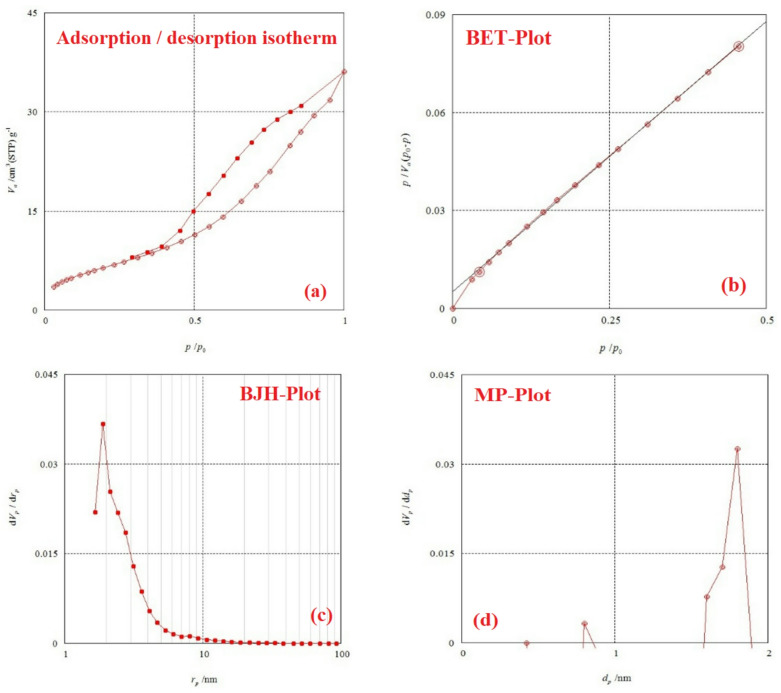 Figure 4
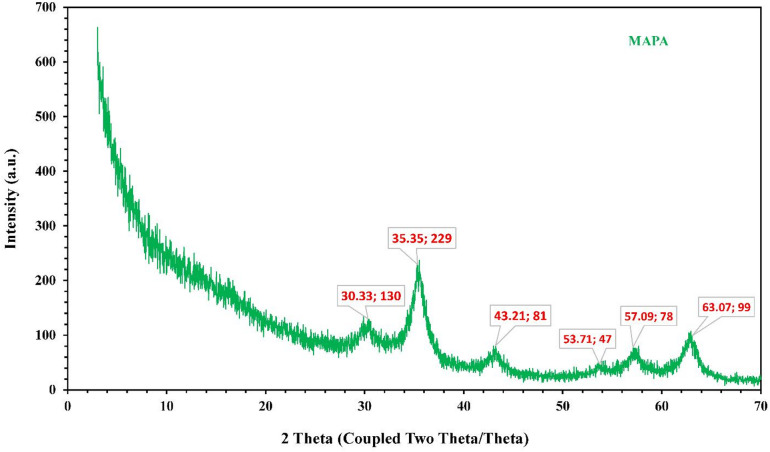 Figure 5
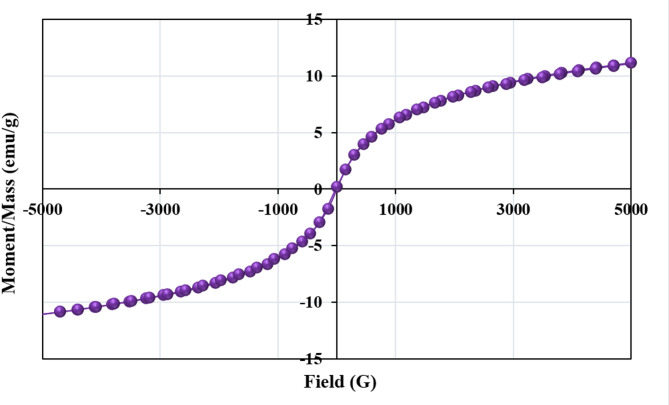 Figure 6
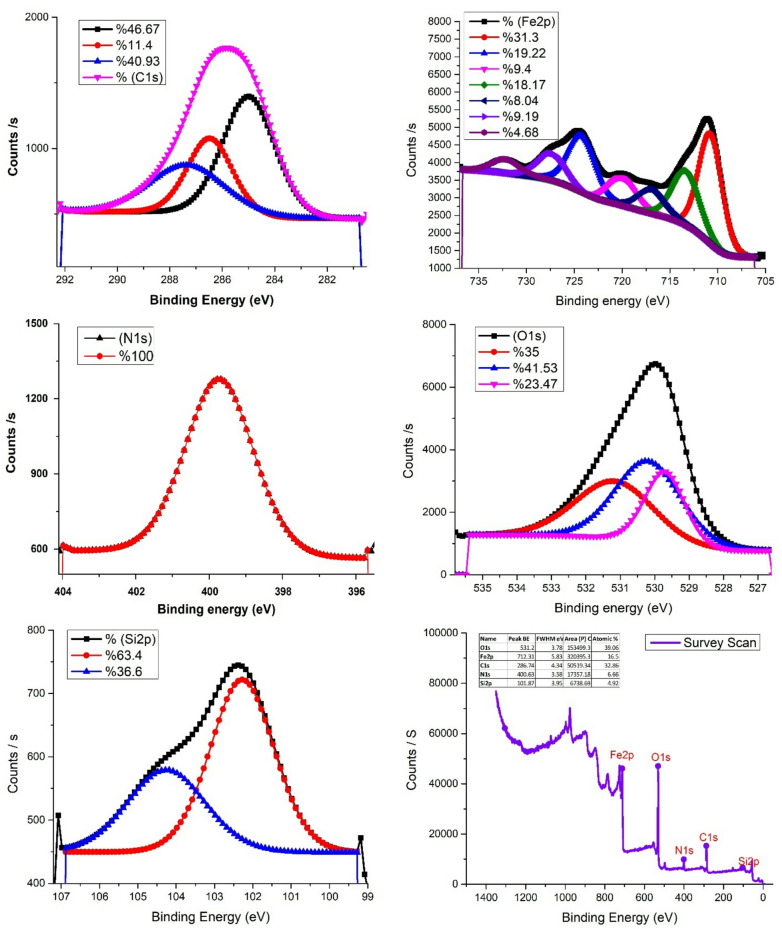 Figure 7
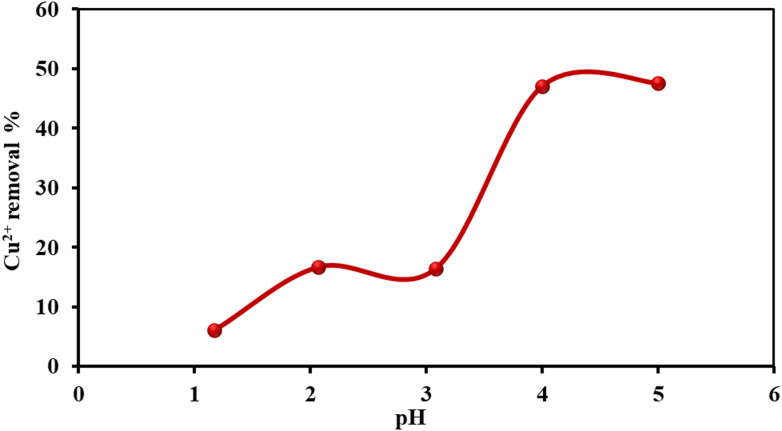 Figure 8
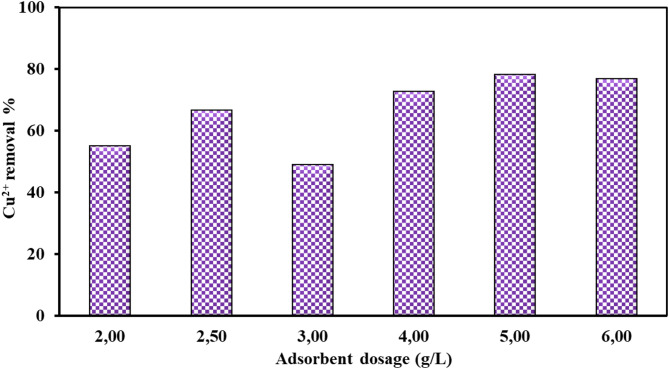 Figure 9
- —National Institute of Oceanography & Fisheries (NIOF)
Peer Reviews
No public reviews on file for this paper yet. If you reviewed it on a platform where reviews are public (OpenReview, ICLR, NeurIPS, ICML), you can paste yours below so the community can read it here.
Videos
No videos yet. Explain this paper in a talk, walkthrough, or lecture? Add one.
Taxonomy
TopicsAdsorption and biosorption for pollutant removal · Nanomaterials for catalytic reactions · Extraction and Separation Processes
Introduction
Water pollution is a critical worldwide concern due to its adverse health impacts^1^. Heavy metals are among the major contributors to this problem, originating from diverse anthropogenic sources^2,3^. Such sources include industrial operations (e.g., metallurgy and manufacturing), agricultural runoff, improper waste management, and natural geochemical activities. Copper ions (Cu^2+^) are particularly prevalent among these metals, commonly detected in street dust and industrial wastewater discharges^4^. Elevated concentrations of Cu^2+^ ions are of particular concern due to their harmful impacts on the nervous system. Owing to its extensive use in diverse fields - such as electrical wiring, heat transfer systems, catalysts, and pulp processing - copper is frequently released into the environment. Various approaches have been employed to address heavy metal pollution, including precipitation, ion exchange, and reverse osmosis^5–8^. Among these, adsorption is acknowledged as a straightforward yet highly efficient method, especially for removing of contaminants at trace concentrations^9–11^.
Consequently, considerable research has been directed toward developing advanced adsorbent materials. Among them, polymer-based nanocomposites show great potential because their high surface area, suitable pore structure, and strong mechanical stability enhance adsorption efficiency. In addition, they are relatively inexpensive, easy to handle, and can be regenerated under mild conditions^12,13^.
Polyacrylonitrile (PAN), a potential synthetic polymer, is primarily studied to develop novel nanocomposites across diverse sectors, including biomedicine, textiles, automotive industries, and electronics. PAN and its composites have garnered significant attention due to their distinctive characteristics, including rigidity, low weight, and high strength^14–16^.
A multifunctional dysprosium oxide–biochar–montmorillonite composite with exceptional adsorption and recyclability toward cationic contaminants was synthesized by Yang et al. in 2025^17^. Their research emphasizes how crucial it is for inorganic oxides and bio-based supports to act in concert to achieve high adsorption efficiency and regeneration capacity. Developing magnetic polymer-based adsorbents with improved recovery and reuse performance is strongly justified by using this information. Xue et al. (2025) described a bio-based benzoxazine–phthalonitrile polymer demonstrating better stability and structural integrity, emphasizing the relevance of polymer design in developing durable and efficient materials for environmental applications^18^. This is consistent with the current study’s strategy of adding amino groups to polyacrylonitrile to enhance surface reactivity and thermal stability for copper ion adsorption. A 3D PVA/GO/ZIF-67 cryogel with remarkable porosity and adsorption capacity for Cd^2+^ and Pb^2+^ ions was created by Motaghi et al. (2022), demonstrating how polymer–oxide hybrids can improve adsorption through synergistic porosity and surface functionality^19^. The study’s approach to combine polymer matrices with magnetic nanoparticles for better heavy metal removal is supported by the incorporation of comparable composite principles. Surface functionalization dramatically increases metal binding affinity, according to Esfandian et al. (2013), who investigated copper adsorption using modified brown algae and compared batch versus column performance^20^. Their findings emphasize the relevance of incorporating amino functionalities in adsorbent to boost Cu^2+^ ion adsorption efficiency.
Verma et al. (2022) reported the adsorption of metal ions and MO dye were performed with the newly synthesized magnetite-doped CS-EDTA composite^21^. The adsorption of Pb(II), Cd(II), and Cu(II) onto the developed composite CS-EDTA was investigated by performing batch experiments^22^. Graphene oxide was successfully functionalized on the multifunctional β-cyclodextrin chitosan polymer through EDTA crosslinking for the adsorption of toxic pollutant^23,24^. A trifunctional β-cyclodextrin-ethylenediaminetetraacetic acid-chitosan polymer was synthesized using an easy and simple chemical route by the reaction of activated β- cyclodextrin with chitosan through EDTA as a cross-linker (amidation reaction) for the removal of inorganic and organic pollutants from aqueous solution under different parameters^25^.
A significant limitation of conventional adsorbents is their challenging recovery from treated water, often necessitating rapid centrifugation or fine filtration techniques. Magnetic adsorbents overcome this drawback, as they can be conveniently retrieved from solution by applying an external magnetic field^26,27^.
The present study is devoted to designing a new adsorbent from 3-aminopropyl trimethoxysilane and testing the formatted magnetic amino polyacrylonitrile nanocomposite to remove Cu^2+^ ions from contaminated water. Attention is given to evaluating the influence of operational parameters, including adsorbent dosage, contact duration, and solution pH, on the adsorption performance. Furthermore, adsorption mechanisms and kinetics are examined using different theoretical models to better understand the process. RSM and ANN models were used to optimize the adsorption of Cu^2+^ ions from wastewater. The overarching objective is to introduce a sustainable and innovative approach for industrial wastewater treatment, thereby reducing the adverse impacts of copper pollution.
Materials and methods
Materials and equipment
Ethanol (C_2_H_5_OH, 99.99%) and ammonia solution (25%) were obtained from the International Company for Sup. & Med. Industries, Egypt. Acrylonitrile stabilized (99%) was procured from Loba Chemie. Ferrous sulfate heptahydrate (98.5%) was purchased from Alpha Chemical, India, while ferric chloride (98.5%) and copper sulfate (CuSO_4_, 99%) were supplied by Fisher Scientific, UK. In addition, 3-aminopropyl trimethoxysilane (95%) was sourced from Acros Organics, N,N-dimethylformamide (DMF, 99.8%) from ADVENT Chembion Pvt. Ltd., India, and ammonium persulfate (98%) from Oxford Lab Chem, India.
The pollutant concentrations were quantified using a UV–visible spectrophotometer (Analytic Jena, SPEKOL 1300) fitted with 1.0 cm optical path length glass cuvettes. The experimental work was carried out with a SANYO microwave oven (EM-D975W, 1400 W maximum input), a JENCO pH meter (6173), a VELP magnetic stirrer with heating function (Code F20500010), and a JS orbital shaker (JSOS-500). The surface functional groups of the adsorbent were characterized using Fourier Transform Infrared (FTIR) spectroscopy using a platinum attenuated total reflection (ATR) unit (VERTEX 70, Model V-100) over the spectral range of 400–4000 cm^–1^. Surface morphology and elemental distribution were further examined through Scanning Electron Microscopy (SEM, LEO 1450 VP) combined with Energy Dispersive X-ray Spectroscopy (EDAX).
Preparation of magnetic amino polyacrylonitrile nanocomposite (MAPA)
Preparation of polymer
A solution was prepared by dissolving 9 mL of acrylonitrile in N,N-dimethylformamide to a final volume of 25 mL. Ammonium persulfate served as the polymerization initiator. Within the initial few minutes of the reaction, 5 mL of 3-aminopropyl trimethoxysilane was gradually introduced. The polymerization was then maintained at 70 °C under continuous stirring for three hours. The resultant precipitate was collected, thoroughly washed with distilled water, and dried at 50 °C (95% yield).
Preparation of magnetic nanopolymer
Magnetite was incorporated into the polymer through the co-precipitation method, a widely used approach for synthesizing magnetic nanoparticles^28^. In this procedure, the preformed polymer was adjusted to pH 11 and combined in a conical flask with two separate solutions: FeSO_4_·7H_2_O (6.75 g in 100 mL distilled water) and FeCl_3_ (8.0 g in 100 mL distilled water). The reaction mixture underwent sonication for 1.5 h, followed by the separation of the magnetic polymer, repeatedly washed with distilled water, and subsequently dried at 50 °C (92% yield). The final product was then stored in a sealed container until further use.
Adsorption study
The removal performance of copper ions from aqueous solutions was assessed through batch adsorption experiments. All investigations were conducted at ambient temperature (25 °C) with constant agitation on a shaking apparatus. Solution pH was regulated by adding 0.1 M HCl or NaOH. A predetermined amount of the synthesized magnetic amino polyacrylonitrile nanocomposite (MAPA) adsorbent was placed in flasks, followed by the addition of solutions with different initial Cu^2+^ ion concentrations. To examine the effect of operating conditions on adsorption performance, adsorbent dosage (2.0, 2.5, 3.0, 4.0, 5.0, and 6.0 g/L), contact time (0–30 min), solution pH (1–5), and initial Cu^2+^ ion concentrations (50, 75, 100, and 150 mg/L) were systematically examined.
The concentrations of Cu^2+^ ion at both the initial and equilibrium stages were determined using a UV–Vis spectrophotometer at the maximum absorption wavelength (λmax = 460 nm)^29,30^. Samples were subjected to shaking at 200 rpm, and at specified time intervals, 1.0 mL aliquots of the supernatant were collected for analysis. All adsorption experiments were conducted in triplicate, with the reported data representing the mean values. The percentage removal of Cu^2+^ ion (%R) was calculated according to Eq. (1)^26^.
\documentclass[12pt]{minimal} \usepackage{amsmath} \usepackage{wasysym} \usepackage{amsfonts} \usepackage{amssymb} \usepackage{amsbsy} \usepackage{mathrsfs} \usepackage{upgreek} \setlength{\oddsidemargin}{-69pt} \begin{document}$$\:\%R=\frac{{C}_{i}-{C}_{e}}{{C}_{i}}\times\:100$$\end{document}where, Ci and Ce denote the Cu^2+^ ion concentrations (mg/L) at the initial and equilibrium adsorption states, respectively. The amount of Cu^2+^ adsorbed at a given time t (min) on the magnetic amino polyacrylonitrile nanocomposite (Qt) was calculated using Eq. (2):
\documentclass[12pt]{minimal} \usepackage{amsmath} \usepackage{wasysym} \usepackage{amsfonts} \usepackage{amssymb} \usepackage{amsbsy} \usepackage{mathrsfs} \usepackage{upgreek} \setlength{\oddsidemargin}{-69pt} \begin{document}$$\:{Q}_{t}=\frac{\left({C}_{i}-{C}_{t}\right)}{W}\times\:V$$\end{document}where, Ct (mg/L) signifies the concentration of Cu^2+^ ions at time t, V(L) indicates the volume of the original feed solution, and W (g) refers to the mass of the magnetic amino polyacrylonitrile nanocomposite (MAPA) employed as an adsorbent. The equilibrium adsorption capacity Qe (mg/g) for the produced MAPA nanocomposite was ascertained utilizing Eq. (3):
\documentclass[12pt]{minimal} \usepackage{amsmath} \usepackage{wasysym} \usepackage{amsfonts} \usepackage{amssymb} \usepackage{amsbsy} \usepackage{mathrsfs} \usepackage{upgreek} \setlength{\oddsidemargin}{-69pt} \begin{document}$$\:{Q}_{e}=\frac{({C}_{0}-{C}_{e})\times\:V}{W}$$\end{document}Where, C0 (mg/L) and Ce (mg/L) denote the initial and the equilibrium concentrations of Cu^2+^ ions, respectively. W (g) signifies the weight of the adsorbent, whereas V (L) indicates the volume of the Cu^2+^ solution. The experiments were repeated three times and the standard deviation was ≤ 2.45.
ANN modelling
The prediction of relationships between input and output data is achieved through biological human brain networks, a process known as ANN modelling. Feed-forward back-propagation neural networks (BPNN) are the most common type. They consist of three main components: an input layer (IL) (independent variable), hidden layers (HNs), and an output layer (OL) (dependent variable). MATLAB R2015b utilizes the Levenberg-Marquardt (LM) training algorithm to model Cu (II) removal by MAPA. The LM training algorithm uses training data (70%), validation data (15%), and testing data (15%). The optimal BPNN includes a hidden layer (HL) with 5 neurons. The inputs are the adsorbent dosage of MAPA (g/L), time (min), and the initial concentration of Cu^2+^ (mg/L), while the removal of Cu^2+^ is the output variable (Table 1)^31,32^.
Table 1. Data for the removal of Cu^2+^ ions using MAPA adsorbent.RunFactor 1Factor 2Factor 3Response 1ANNRSMA: MAPA doseB: TimeC: Cu doseCu ions removalPredictionPredictiong/Lminmg/L%%%1260.010038.4538.4538.332460.015022.6422.2322.31361.010035.6535.2635.774430.510036.6636.9736.665630.55073.08772.8972.636230.55054.2354.4254.427430.510036.6636.9736.668430.510036.6636.9736.669230.515016.7716.0517.2310430.510036.6636.9736.661141.015014.7614.2014.821241.05053.1153.7653.441321.010022.6622.6222.1414660.010045.8945.3646.4115460.05072.8471.5672.7816430.510036.6636.9736.6617630.515020.9220.9520.73
RSM
Response surface methodology (RSM) was used to study the optimization of factors affecting Cu^2+^ ion removal in the presence of magnetic amino polyacrylonitrile nanocomposite (MAPA). The Box-Behnken design (BBD) was used, and Design-Expert version 13.0.5.0 was the software used. The starting Cu^2+^ ion concentration, adsorbent dose, and reaction duration were chosen. Table 2 lists the parameters under study along with their corresponding levels. Cu^2+^ ion removal percentage (%) was the answer under investigation. Seventeen tests were carried out using various combinations of factors.
Table 2A range of experimental parameters considered in the optimization study.FactorNameUnitsMinimumMaximumMeanStd. Dev.ADoseg/L2.006.004.001.41BTimeMin1.0060.0030.5020.86CCu^2+^ Conc.mg/L50.00150.00100.0035.36
Results and discussion
Characterization of magnetic amino poly-acrylonitrile nanocomposite (MAPA)
Scanning electron microscopy (SEM)
Figure 1 illustrates the Scanning Electron Microscopy (SEM) images of the magnetic amino polyacrylonitrile nanocomposite. The micrographs reveal well-defined, spherical nanoparticles with an average size ranging from 21.49 to 28.27 nm.
Fig. 1SEM images of magnetic amino polyacrylonitrile nanocomposite (MAPA) adsorbents.
Thermal gravimetric analysis (TGA) of MAPA
Thermogravimetric analysis (TGA) was conducted to assess the thermal stability of the magnetic amino polyacrylonitrile nanocomposite. This technique, which records the mass change of a sample upon heating, indicated multiple stages of decomposition. The initial weight loss of 5.24% occurred below 167 °C, corresponding to releasing physically and chemically bound water molecules. A subsequent decrease of 4.51% was detected between 195 and 250 °C, associated with depolymerization and degradation of polymer chains. The third stage, showing a 10.80% loss, was observed in the 300–400 °C range, while the fourth stage exhibited a 9.13% reduction between 660 and 800 °C. At 1000 °C, the overall mass loss reached 30%. These findings provide insight into the material’s decomposition profile and confirm its thermal stability across different temperature intervals (Fig. 2).
Fig. 2TGA and DTA graph of magnetic amino polyacrylonitrile nanocomposite (MAPA) adsorbents.
FTIR of magnetic amino poly-acrylonitrile nanocomposite (MAPA)
Fourier Transform Infrared (FTIR) spectroscopy was used to characterize the magnetic amino polyacrylonitrile nanocomposite, as it is a reliable method for identifying specific functional groups^33^. The FTIR spectrum of the nanocomposite is shown in Fig. 3. A broad absorption band around 3263 cm^–1^ is ascribed to the –OH stretching vibrations of hydroxyl groups on the surface of the magnetic nanoparticles. Peaks corresponding to Fe–O stretching in magnetite are evident within the 400–600 cm^–1^ range^34,35^, with prominent signals at 584 and 420 cm^–1^ confirming the presence of magnetite in the composite^36,37^. The C = C stretching vibration is indicated by a band at 1448 cm^–1^^38^, while the C–H stretching vibration of the CH_2_ groups in the polymer chain appears at 2930 cm^–1^. Bending vibrations of CH_2_ groups are detected in the fingerprint region at 1414 and 1454 cm^–1^. The N–H stretching and bending vibrations are observed at 3371 and 1653 cm^–1^, respectively^39^. The C–N stretching, representing the linkage of the amine group to the polymer backbone, appears at 1043 cm^–1^, and a band at 2251 cm^–1^ is assigned to C ≡ N stretching vibrations^33,40^.
Fig. 3FTIR analysis of magnetic amino polyacrylonitrile (MAPA) nanocomposite adsorbent.
BET surface area of magnetic amino poly-acrylonitrile (MAPA) nanocomposite
The efficiency of materials such as sorbents, catalysts, and membranes strongly depends on their physicochemical properties, particularly surface area and porosity. These structural attributes in nanomaterials are commonly analyzed using gas adsorption techniques, with the Brunauer–Emmett–Teller (BET) model being one of the most established approaches^41^. In this work, the specific surface area of the amino polyacrylonitrile nanocomposite was determined by the BET method, employing nitrogen adsorption–desorption isotherms^42^. As shown in Fig. 4(a), the obtained isotherm exhibits a hysteresis loop characteristic of type IV behavior, which reflects the presence of mesopores. The mean pore diameter of the magnetic amino polyacrylonitrile nanocomposite was calculated as 8.5341 nm^43,44^. Typically, these isotherms are depicted by plotting the adsorbed gas volume as a function of the relative pressure (p/p°)^45^.
Fig. 4(a) Graph of N_2_ adsorption-desorption, (b) BET, (c) BJH, and (d) MP analysis of the MAPA.
XRD study of MAPA
X-ray diffraction (XRD) serves as a key method for elucidating materials’ crystalline structures. The resulting XRD patterns act as distinctive “fingerprints,” providing insights into crystal phases, lattice parameters, and crystallite dimensions. In this study, the crystalline structure of the MAPA was examined by XRD, as depicted in Fig. 5. Measurements were performed over a 2θ range of 5°–70°. Prominent diffraction peaks observed at 2θ values of 30.33°, 35.35°, and 63.07° indicate the presence of magnetite nanoparticles exhibiting a spinel structure, consistent with JCPDS card No. 98-3969^46,47^. The incorporation of the MAPA polymer appears to have a negligible influence on the structural integrity of the magnetite nanoparticles.
Fig. 5XRD graph of fabricated MAPA nanocomposite.
Magnetic properties of MAPA nanocomposite
Analyzing data obtained from a Vibrating Sample Magnetometer (VSM) requires careful examination of several fundamental magnetic parameters. The VSM measures the magnetization (M) of a sample as a function of the applied magnetic field (H), generating a hysteresis loop that characterizes the material’s magnetic behavior^48,49^. This loop demonstrates the extent to which the sample retains magnetization after removing external field. One important parameter is coercivity, which defines the intensity of the magnetic field necessary to bring the magnetization to zero following saturation^48,49^. Coercivity is useful for differentiating between hard and soft magnetic materials: hard magnets display high coercivity and retain their magnetization effectively, whereas soft magnets exhibit low coercivity and are easily demagnetized. Saturation magnetization (Ms) represents the maximum magnetization achievable under a strong applied field. In contrast, remanent magnetization (Mr), or retentivity, quantifies the residual magnetization retained once the field is removed, reflecting the material’s ability to preserve magnetic properties. Additionally, the hysteresis loop’s shape provides further information on magnetic hardness, with narrow loops corresponding to soft materials and wide loops indicative of hard materials^48,49^.
Vibrating Sample Magnetometer (VSM) measurements of the MAPA nanocomposite were performed under an applied magnetic field ranging from − 5000 to 5000 Oe. As shown in Fig. 6, the nanocomposite exhibited a saturation magnetization (Ms) of 11.098 emu/g, a coercivity of 9.9567 G, and a remanent magnetization (Mr) of 0.10541 emu/g. The observed S-shaped hysteresis loop, characterized by its considerable width and relatively high coercivity, confirms the nanocomposite’s classification as a hard magnetic material, indicating its suitability for magnetic separation after adsorption processes^48,49^.
Fig. 6. Magnetization curve for MAPA nanocomposite.
X-ray photoelectron spectroscopy (XPS) of MAPA nanocomposite
X-ray Photoelectron Spectroscopy (XPS) is a surface-sensitive and quantitative method widely employed to investigate materials’ elemental composition, oxidation states, and electronic environments^48,49^. In an XPS spectrum, the binding energy (eV) is plotted on the X-axis, reflecting the strength of electron binding to atoms, while the Y-axis denotes intensity, expressed as counts or arbitrary units, which corresponds to the number of electrons detected at each binding energy^48,49^. Figure 7 presents the XPS spectrum of the MAPA nanocomposite, confirming the presence of major constituent elements. Distinct peaks were identified at 286.74 eV (C 1s), 531.2 eV (O 1s), and 712.31 eV (Fe 2p). The C 1s peak at 286.74 eV arises from carbon atoms in the (C ≡ N) functional group, while the O 1s peak at 531.2 eV is associated with lattice oxygen in Fe₃O₄, verifying the presence of magnetite. The Fe 2p spectrum displayed characteristic signals at 704 eV, 721 eV, and 727.08 eV, corresponding to Fe 2p₃/₂, Fe 2p₁/₂, and an additional Fe 2p₃/₂ peak, further supporting the identification of magnetite. Moreover, a peak at 400.63 eV in the N 1s region indicates nitrogen incorporation within the nanocomposite structure.
Fig. 7XPS spectrum of the MAPA nanocomposite adsorbent recorded at a resolution of 1 eV.
Adsorption investigation
This study employed the batch equilibrium technique to examine the adsorption behavior of copper ions (Cu^2+^) onto a novel material, Magnetic Amino Polyacrylonitrile (MAPA) Nanocomposite. The effect of key operational parameters, including contact time, solution pH, adsorbent dose, and initial Cu^2+^ concentration, was systematically evaluated to assess the adsorption process.
Effect of pH
The initial solution pH is a critical factor in the adsorption process, as it governs both the speciation of copper ions and the surface charge characteristics of the adsorbent^50^. This study investigated pH values between 1 and 6, since at pH levels higher than 6, Cu^2+^ ions tend to precipitate as Cu(OH)2, which could interfere with adsorption measurements^51^. As shown in Fig. 8, the adsorption of Cu^2+^ ions onto the MAPA nanocomposite was strongly dependent on pH. Adsorption efficiency gradually rose from pH 1 to 3.1, followed by a pronounced increase in copper uptake. Excess H^+^ ions reduced adsorption at lower pH conditions by competing with Cu^2+^ ions for available binding sites. Increasing pH diminished the H^+^ ion concentration, lowering competition and facilitating more effective copper adsorption.
Fig. 8. Effect of solution pH on the removal efficiency of Cu^2+^ ions by the MAPA adsorbent [Cu^2+^ (100 mg/L), MAPA (5.0 g/L), temp. (25 °C)].
Effect of MAPA nanocomposite adsorbent dosage
This experimental section focused on evaluating the influence of adsorbent dosage, specifically the amount of MAPA nanocomposite, on the removal efficiency of Cu^2+^ ions. The adsorption experiments were conducted under the following experimental conditions: initial Cu^2+^ ion concentrations ranging from 50 to 150 mg/L, adsorbent doses between 2.0 and 6.0 g/L, solution temperature maintained at 25 °C, contact time fixed at 60 min, and solution pH was adjusted to 5.5.
As illustrated in Fig. 9, an increase in adsorbent dosage improved the removal efficiency of Cu^2+^ ions. Specifically, when the concentration of MAPA nanocomposite was raised from 2.0 to 6.0 g/L, the Cu^2+^ ions removal rate increased from 55.1% to 76.8%. This improvement can be attributed to the greater availability of active binding sites on the adsorbent, while the total amount of Cu^2+^ ions in solution remained constant.
Fig. 9. Effect of MAPA nanocomposite doses (2.0–6.0 g/L) on 50 mg/L Cu^2+^ ion concentration.
Effect of contact time
An experiment was performed to evaluate the influence of contact time on the adsorption of Cu^2+^ ions onto MAPA nanocomposite. In this study, an adsorbent dosage of 2.00 g/L was applied with initial Cu^2+^ concentrations ranging from 50 to 150 mg/L. As presented in Fig. 10, the adsorption occurred rapidly, with more than 50% of Cu^2+^ ions removed within the first few minutes. Equilibrium was reached in approximately 10 min, and the removal efficiency decreased as the initial ion concentration increased. The rapid uptake at the beginning is attributed to the abundance of available active sites on the adsorbent surface, while the subsequent slowdown reflects site saturation over time.
Fig. 10. The Cu^2+^ ions removal % using MAPA as an adsorbent (Cu^2+^ ions = (50–150 mg/L), MAPA dose = 2.0 g/L, Temp. = 25 °C).
Adsorption kinetics
Various kinetic models were applied to gain deeper insights into the adsorption mechanism and interpret the experimental data. Commonly employed in adsorption research, these models include the pseudo-first-order (PFO), pseudo-second-order (PSO), intraparticle diffusion (IPDM), and film diffusion (FDM) models^52,53^. In the present work, the adsorption of Cu^2+^ ions onto the magnetic amino polyacrylonitrile nanocomposite was assessed by fitting the obtained experimental data to each of these four models. The PFO can be expressed by Eq. (4):
\documentclass[12pt]{minimal} \usepackage{amsmath} \usepackage{wasysym} \usepackage{amsfonts} \usepackage{amssymb} \usepackage{amsbsy} \usepackage{mathrsfs} \usepackage{upgreek} \setlength{\oddsidemargin}{-69pt} \begin{document}$$\:\mathrm{log}\left({q}_{\mathrm{e}}-{q}_{\mathrm{e}}\right)=\mathrm{log}\left({q}_{\mathrm{e}}\right)-\frac{{k}_{1}}{2.303}t$$\end{document}where, qt (mg/g) represents the amount of copper adsorbed onto the prepared nanocomposite at time t (min), qe (mg/g) denotes the amount of copper adsorbed at equilibrium, and k1 (L/min) is the equilibrium rate constant for the PFO adsorption process.
As illustrated in Fig. 11(a), the plot of log(qe – qt) versus time (t) exhibits a linear trend, where the slope corresponds to the rate constant k_1 and the intercept represents the equilibrium adsorption capacity (qe). Nevertheless, the experimental findings indicate that the PFO does not adequately describe the adsorption of Cu²⁺ ions onto the magnetic adsorbent. This inadequacy arises from the relatively low correlation coefficient and the considerable deviation between the calculated and experimental qe_ values. Consequently, the pseudo-second-order model (PSO), defined by Eq. (5), was evaluated as an alternative.
\documentclass[12pt]{minimal} \usepackage{amsmath} \usepackage{wasysym} \usepackage{amsfonts} \usepackage{amssymb} \usepackage{amsbsy} \usepackage{mathrsfs} \usepackage{upgreek} \setlength{\oddsidemargin}{-69pt} \begin{document}$$\:\left(\frac{t}{{q}_{t}}\right)=\frac{1}{{k}_{2}{{q}_{e}}^{2}}+\frac{1}{{q}_{e}}\left(t\right)$$\end{document}where, qt (mg/g) represents the amount of copper adsorbed onto the prepared nanocomposite at a given time t (min), qe (mg/g) denotes the adsorption capacity at adsorption equilibrium, and k2 (g/mg min) represents the kinetic rate constant for the PSO. The initial adsorption rate (h) was determined using Eq. (6):
\documentclass[12pt]{minimal} \usepackage{amsmath} \usepackage{wasysym} \usepackage{amsfonts} \usepackage{amssymb} \usepackage{amsbsy} \usepackage{mathrsfs} \usepackage{upgreek} \setlength{\oddsidemargin}{-69pt} \begin{document}$$\:h={k}_{2\:}{{q}_{\mathrm{e}}}^{2}$$\end{document}Table 3 demonstrates that the PSO provides a significantly better representation of Cu^2+^ ion adsorption onto the MAPA nanocomposite compared with the PFO. The PSO consistently yields higher correlation coefficients (R^2^) and calculated adsorption capacities that closely align with the experimental values. These results indicate that the PSO provides the most reliable description of the adsorption behavior in this system.
Kargi and Cikla^54^ investigated the mass transfer mechanisms between the liquid phase and the adsorption of target pollutants onto the MAPA adsorbent^54^. Isothermal plug flow diffusion (IPDM) could act as the rate-limiting mechanism in a batch experimental setup under conditions of vigorous agitation^55^. The IPDM analysis was further conducted using Eq. 7, following the approach proposed by Annadurai et al.^56^.
\documentclass[12pt]{minimal} \usepackage{amsmath} \usepackage{wasysym} \usepackage{amsfonts} \usepackage{amssymb} \usepackage{amsbsy} \usepackage{mathrsfs} \usepackage{upgreek} \setlength{\oddsidemargin}{-69pt} \begin{document}$$\:{q}_{t}={K}_{diff}{t}^{0.5}+C$$\end{document}where Kdiff represents the rate constant of IPDM (mg g^− 1^ min^1/2^) (Fig. 11c).
Weber and Morris^57^ propose that the adsorption process is dictated by the intraparticle diffusion step, as seen by the intersection of the lines indicating qt and the square root of time (t) at the vector origin in Fig. 11c. In instances when the lines do not intersect the origin, it is generally acknowledged that the elimination process is predominantly influenced by the Film Diffusion Model (FDM), particularly when the C value is significantly high. The study investigated the efficiency of Cu²⁺ ion removal from aqueous solutions by varying the adsorbent dosage and the initial Cu²⁺ ion concentration. Figure 11c depicts the Webber-Morris^57^ adsorption plots for Cu^2+^ ions. The Kdif and C values presented in Table 4 were derived from the analysis of the slope and intercept of the plot illustrating the relationship between qt and t^0.5^. The linear trends shown in Fig. 11c, representing different concentrations of the adsorbent, do not meet at the origin of Cu^2+^ ions. This can be ascribed to the noted elevated C intersection. This claim is supported by the observation that FDM markedly affects the absorption rate of Cu^2+^ ions into the MAPA adsorbent. The measured absorption rate shows a gradual increase over time, as illustrated in Fig. 11c. The intra-particle diffusion rate constant, Kdif, ranged from 0.03 to 1.66 mg g^–1^min^–1/2^ for the loading of Cu^2+^ ions onto MAPA. The rate constant exhibited an increasing trend when the starting concentration of Cu^2+^ ions rose, concurrently with a reduction in the dosage of MAPA. The observed phenomena can be ascribed to the progressive decrease in the pore volume and surface area of the MAPA adsorbent throughout the separation process.
The film diffusion model (FDM) denotes the mechanism by which adsorbate molecules traverse a liquid film around the adsorbent particle. The equation for FDM is designated as Eq. 8.
\documentclass[12pt]{minimal} \usepackage{amsmath} \usepackage{wasysym} \usepackage{amsfonts} \usepackage{amssymb} \usepackage{amsbsy} \usepackage{mathrsfs} \usepackage{upgreek} \setlength{\oddsidemargin}{-69pt} \begin{document}$$\:\mathrm{ln}\left(1-F\right)={K}_{FD}\left(t\right)$$\end{document}where KFD denotes the external film mass transfer coefficient and F represents defined as the ratio of qt to qe.
The KFD constant can be calculated from the slope and intercept of the plot of the logarithm of (1 − F) in relation to the plots (Fig. 11d)^58^. The PSO was identified as the most appropriate kinetic model for the electrochemical elimination of Cu^2+^ ions on MAPA. The aforementioned result was drawn from the observation that the straight lines did not overlap at the sources. The results suggest that film diffusion does not constitute the rate-limiting step in the overall adsorption kinetics. PSO rate data had the highest coefficient of determination (R^2^ = 1). The initial phase of the process is proposed to involve electrostatic interactions between the negatively charged active sites on the self-doped biochar carbon and the hydrogen ions in solution. This hypothesis is supported by the adsorption isotherm models PSO, LIM, and TIM. The specified compound comprised many nitrogen atoms that displayed unshared electron pairs. The surface of the MAPA, after positive self-doping, demonstrated effective absorption of Cu^2+^ ions, creating a unique adsorption layer. The presence of –NH_2_ group in the prepared MAPA is the essential group for the removal of Cu^2+^ ions via electrostatic attraction.
Fig. 11(a) PFO, (b) PSO, (c) IPDM, and (d) FDM kinetic models of adsorption of Cu^2+^ ions by MAPA nanocomposite (C_0_ = (50–150 mg/L), MAPA dose = (6.0 g/L), Temp. = 25 °C).
Table 3PFO and PSO kinetic model results of adsorption of Cu^2+^ ions by MAPA nanocomposite adsorbent [Initial concentration (50–150 mg/L), MAPA nanocomposite doses (2.0–6.0 g/L), Temp. (25 °C)].ParameterPFOPSOMAPA conc.(g/L)Cu^2+^ conc. (mg/L)q_e_ (exp.)q_e_ (calc.)k_1_ × 10^3^ R ^2^ q_e_ (calc.)k_2_ × 10^3^h R ^2^ 2.05013.770.5812.670.29913.74225.5342.551.0007516.6810.502.070.42716.64298.5182.651.00010028.9314.4738.690.85928.497.626.180.94315011.1622.110.920.37716.642.690.7441.0002.55013.3413.1313.45450.84813.4671.2312.900.9997513.4516.6041.15150.45913.42344.7462.111.00010015.3710.3972.76360.43715.29262.4061.351.0001509.2326.1940.46060.3308.821368.04106.380.9993.0508.178.8331.150.7668.13179.2511.850.9987511.2911.2381.610.80311.34189.7424.391.00010013.068.6362.760.65913.02124.9621.190.9991507.9418.7500.460.1857.37928.6550.510.9984.0509.094.5017.600.7799.20124.6410.551.000758.729.4321.840.4898.72282.3221.461.0001009.869.8921.610.7089.82170.1716.420.9991506.3417.2620.020.0005.98476.2517.040.9995.0507.833.0999.440.6817.90150.639.401.000756.937.2680.230.2446.932665.85128.211.0001008.9510.3822.990.9298.9070.495.590.9931505.8817.2820.460.1235.35742.4321.280.9976.0507.683.0797.140.5677.71199.5511.861.000757.487.2281.380.9167.50316.7417.831.0001007.7911.4870.920.5787.91442.5827.701.0001505.7819.8240.460.2465.73262.658.640.998
Table 4IPDM and FDM kinetic model results of Cu^2+^ ions adsorption by MAPA nanocomposite adsorbent [Initial concentration (50–150 mg/L), adsorbent doses (2.0–6.0 g/L), Temp. (25 °C)].ParameterIPDMFDMMAPA conc. (g/L)Cu^2+^ conc. (mg/L)q_e_ (exp.)K_dif_C R ^2^ K_FD_C R ^2^ 2.05013.770.2212.270.6950.00390.750.5467516.680.2415.150.6100.00220.910.42710028.931.6613.450.8130.00900.920.7041506.340.249.510.5790.00100.380.3772.55013.340.4110.390.9410.00350.610.8487513.450.2012.170.6510.00110.560.45910015.370.3013.430.6420.00270.890.4371509.230.108.230.4890.00040.280.3303.0508.170.097.290.6360.00130.610.7667511.290.1610.120.8830.00160.660.80310013.060.2111.370.7170.00270.860.6591507.940.126.850.3680.00050.320.1854.0509.090.287.160.8890.00751.000.779758.720.167.620.6100.00100.610.4891009.860.148.680.7550.00160.640.7081506.340.036.000.0380.00000.300.0005.0507.830.246.180.7450.00941.150.681756.930.026.780.3450.00030.660.2441008.950.246.730.8580.00300.520.9291505.880.114.880.2890.00050.260.1236.0507.680.206.300.6570.00721.160.567757.480.096.820.9670.00130.670.9161007.790.107.200.7610.00090.500.5781505.780.095.000.3020.00050.230.246
Adsorption isotherms
Adsorption isotherms play a crucial role in elucidating the mechanisms governing adsorbent performance. They provide a framework for interpreting the equilibrium relationship between an adsorbate (the substance retained) and an adsorbent (the material responsible for retention). Examining these models allows determination of the maximum adsorption capacity, an important factor in optimizing the applicability of the adsorbent. Moreover, the data reveal valuable information about molecular interactions and binding affinities^59,60^.
In this study, three widely applied isotherm models—Langmuir (LIM) (Eq. 9), Freundlich (FIM) (Eq. 8), and Temkin (TIM) (Eq. 9)—were employed to evaluate the adsorption of Cu²⁺ ions onto a magnetic amino polyacrylonitrile (MAPA) nanocomposite, aiming to gain deeper insight into the adsorption mechanism and the ion–surface interactions involved. Based on these assumptions these assumptions, the model yields a characteristic linear equation that quantitatively represents adsorption behavior^59,60^.
\documentclass[12pt]{minimal} \usepackage{amsmath} \usepackage{wasysym} \usepackage{amsfonts} \usepackage{amssymb} \usepackage{amsbsy} \usepackage{mathrsfs} \usepackage{upgreek} \setlength{\oddsidemargin}{-69pt} \begin{document}$$\:\frac{{\mathrm{C}}_{e}}{{\mathrm{q}}_{e}}=\frac{1}{{\mathrm{K}}_{L}{\mathrm{q}}_{m}}+\frac{1}{{\mathrm{q}}_{m}}\times\:{\mathrm{C}}_{e}$$\end{document}where, Ce is the concentration of adsorbate in solution at equilibrium, qm (mg/g) represents the theoretical maximum adsorption capacity, qe (mg/g) indicates the equilibrium adsorption capacity, and KL represents the Langmuir constant (L/mg) associated with adsorption energy^59,60^.
The Freundlich isotherm model characterizes adsorption behavior at equilibrium by expressing the relationship between the quantity of adsorbate retained per unit mass of adsorbent and the equilibrium concentration of the adsorbate remaining in solution^59,60^.
\documentclass[12pt]{minimal} \usepackage{amsmath} \usepackage{wasysym} \usepackage{amsfonts} \usepackage{amssymb} \usepackage{amsbsy} \usepackage{mathrsfs} \usepackage{upgreek} \setlength{\oddsidemargin}{-69pt} \begin{document}$$\:\mathrm{log}q\mathrm{e}=\mathrm{log}K\mathrm{F}\:+\:\frac{1}{n}\:\mathrm{log}C\mathrm{e}$$\end{document}where, n represents a constant related to the relation between the adsorbate and adsorbent, KF (mg/g) denotes the Freundlich constant reflecting adsorption capacity, qe (mg/g) denotes the amount of Cu^2+^ ions removed per gram adsorbent at equilibrium, and Ce (mg/L) signifies the equilibrium concentration of Cu^2+^ ions in the solution.
The Temkin isotherm model (TIM) describes adsorption based on the assumption of indirect interactions between adsorbate and adsorbent molecules^59^. According to this theory, the heat of adsorption decreases linearly with increasing surface coverage due to adsorbate–adsorbent interactions. The model assumes a uniform distribution of binding energies up to a maximum value. The Temkin isotherm can be mathematically represented by Eq. (11), which is often expressed in a simplified linear form as shown in Eq. (12)^59^.
\documentclass[12pt]{minimal} \usepackage{amsmath} \usepackage{wasysym} \usepackage{amsfonts} \usepackage{amssymb} \usepackage{amsbsy} \usepackage{mathrsfs} \usepackage{upgreek} \setlength{\oddsidemargin}{-69pt} \begin{document}$$\:{q}_{e}=\frac{RT}{{B}_{T}}\mathrm{l}\mathrm{n}\left({A}_{T}{C}_{e}\right)$$\end{document} \documentclass[12pt]{minimal} \usepackage{amsmath} \usepackage{wasysym} \usepackage{amsfonts} \usepackage{amssymb} \usepackage{amsbsy} \usepackage{mathrsfs} \usepackage{upgreek} \setlength{\oddsidemargin}{-69pt} \begin{document}$$\:{q}_{e}=\frac{RT}{{B}_{T}}\mathrm{ln}\left({A}_{T}\right)+\frac{RT}{{B}_{T}}\mathrm{l}\mathrm{n}\left({C}_{e}\right)$$\end{document}where AT (L/mg) is the Tempkin isotherm constant, BT (J g/mol mg) represents the adsorption energy (heat of adsorption) variation factor, R (8.314 J/mol K) represents the universal gas constant, and T (K) represents the absolute temperature.
A newly developed MAPA nanocomposite was evaluated for its efficiency in removing Cu^2+^ ions from aqueous solution. The adsorption data, summarized in Table 5, were interpreted using these three isotherm models. The Langmuir model provided an excellent fit, exhibiting a correlation coefficient greater than 0.962, whereas the Freundlich model yielded a relatively poor correlation of 0.418 at an adsorbent dosage of 2 g/L.
The superior agreement with the Langmuir model indicates that the nanocomposite possesses a homogeneous surface, implying that all adsorption sites are structurally uniform and exhibit equal affinity toward Cu²⁺ ions (Fig. 12).
Fig. 12. Isotherm profiles for Cu^2+^ ions on MAPA nanocomposite at initial concentrations of 50–150 mg/L and adsorbent dosages of 2.0–6.0 g/L at 25 °C: (a) LIM, (b) FIM, and (c) TIM.
Table 5. Adsorption isotherm data for Cu^2+^ ions onto the MAPA nanocomposite adsorbent [Cu^2+^ (50–150 mg/L), adsorbent doses (2.0–6.0 g/L), temperature (25 °C)].Isotherm modelParametersMAPA nanocomposite doses (g/L)2.02.53.04.05.06.0LIMqm (mg/g)5.238.597.495.995.655.56KL x10^3^40.2270.5181.2283.72113.29114.67 R ^2^ 0.9660.9620.9490.9680.9720.981FIM 1/n 0.560.150.030.130.090.10KF (mg^1 − 1/n^ L^1/n^ g^–1^)124.8022.6211.2913.8710.1410.34 R ^2^ 0.4180.3380.0090.3960.2430.482TIM A T 6.5711.7743.3012.4216.5114.61 B T 6.0611.6270.2570.9880.5780.661 R ^2^ 0.2180.2840.0050.3610.1970.477
Comparison with results reported in the literature
The literature review in Table 6 compares the efficacy of other adsorbents in removing Cu^2+^ ions with that of the MAPA nanocomposite adsorbent, demonstrating that the MAPA adsorbent is effective.
Table 6. Comparative analysis of the maximum adsorption capacities of Cu^2+^ ions for various adsorbents.AdsorbentMax. capacity (mg/g)Ref.Sawdust1.79^61^Saccharomyces cerevisiae1.90^62^Orange peel3.65^63^Tea fungal biomass4.64^64^Datura innoxia7.20^65^Banana peel8.24^66^Tree fern11.7^67^Synthetichematite (α-Fe_2_O_3_)iron oxide-coated sand3.93^68^NaOH-treated rice husk3.75^69^Magnetite Nano‑Adsorbent from Mill Scale Waste4.42^70^Halloysite clay3.42^71^ MAPA 5.65 This work
ANN modelling
The backpropagation algorithm with sample data divided into training (70%), testing (15%), and Validation (15%) trained the optimal ANN model for removing Cu (II) by the MAPA which is formed of 3 neurons in the input layer, 5 neurons in the hidden layer, and 1 neuron in the output layer, as shown in Fig. 13. The regression plot illustrated that R² training was 0.99874. R^2^ validation and testing were 1, while the overall R² was 0.996 between the experimental results and the ANN predicted data. The regression plots are illustrated in Fig. 14. The MSE was determined to be 1.11e-28. The hidden layer employed the log-sigmoid (log-sig) activation function, while the output layer utilized the pure linear (purelin) activation function. The optimal ANN input variables are the adsorbent dosage of MAPA (g/L), time (min), and initial concentrations of Cu (II), while the output variable was the removal % of Cu (II). Figure 15 displayed the MSE error vs. the epoch number for the optimized ANN model that stopped after 4 epochs with the best validation of 5.4738^72,73^.
Fig. 13ANN architecture for the elimination of Cu^2+^ heavy metal.
Fig. 14. Training, validation, testing, and overall datasets for the LM algorithm.
Fig. 15LM algorithm performance.
RSM study
The chosen model was subjected to an ANOVA analysis to assess its relevance and identify the variables influencing the elimination percentage^74–81^. The experimental and anticipated elimination percentages and the ANOVA analysis outcomes are shown in Tables 1 and 7. The F-values show the significance of the variables and how they interact with the answer. A substantial impact of the factor or interaction on the answer is indicated by an F-value larger than 1. The Cu^2+^ removal % was most significantly impacted by the starting Cu^2+^ ion concentration, as Table 7 demonstrates. The model’s Adeq Precision-value of 176.21 (Table 7) emphasises its relevance.
Furthermore, factors are deemed significant if their p-values are less than 0.05. The relevance of the model is further supported by its p-value, which is less than 0.0001. The minor discrepancy between the adjusted R^2^ (0.9994) and predicted R^2^ (0.9957), which is less than 0.2, further demonstrates the robustness of the model. The following Eqs. (13, 14) for Cu^2+^ ion removal percentage were derived from the findings obtained:
\documentclass[12pt]{minimal} \usepackage{amsmath} \usepackage{wasysym} \usepackage{amsfonts} \usepackage{amssymb} \usepackage{amsbsy} \usepackage{mathrsfs} \usepackage{upgreek} \setlength{\oddsidemargin}{-69pt} \begin{document}$$\begin{aligned} {\text{Removal }}\% {\text{ for coded factors }} = & {\mathrm{36}}.{\text{66 }} + {\text{ 5}}.{\text{43A }} + {\text{ 6}}.{\text{71B }}{-}{\text{ 22}}.{\text{27C }}{-}{\text{ 1}}.{\text{39AB }}{-}{\text{ 3}}.{\text{68AC }} \\ & {-}{\text{ 2}}.{\text{96BC }}{-}{\text{ }}0.{\mathrm{29A}}^{2} {\text{ }}{-}{\text{ }}0.{\mathrm{71B}}^{2} {\text{ }} + {\text{ 4}}.{\mathrm{88C}}^{2} \\ \end{aligned}$$\end{document} \documentclass[12pt]{minimal} \usepackage{amsmath} \usepackage{wasysym} \usepackage{amsfonts} \usepackage{amssymb} \usepackage{amsbsy} \usepackage{mathrsfs} \usepackage{upgreek} \setlength{\oddsidemargin}{-69pt} \begin{document}$$\begin{aligned} {\text{Removal }}\% {\text{ for actual factors }} = & {\text{ 7}}.{\text{32 }} + {\text{ 7}}.{\text{69 Dose }} + {\text{ }}0.{\text{57 Time }}{-}{\text{ }}0.{\text{63 Cu dose }}{-}{\text{ }}0.0{\text{24 }}\left( {{\mathrm{Dose}}*{\mathrm{Time}}} \right){\text{ }} \\ & {-}{\text{ }}0.0{\text{368 }}\left( {{\mathrm{Dose}}*{\text{ Cu Conc}}.} \right){\text{ }}{-}{\text{ }}0.00{\mathrm{2}}0{\text{ }}\left( {{\mathrm{Time}}*{\text{Cu Conc}}} \right){\text{ }} \\ & {-}{\text{ }}0.0{\text{729 Dose}}^{2} {\text{ }}{-}{\text{ }}0.000{\text{81 Time}}^{2} {\text{ }} + {\text{ }}0.00{\text{195 Cu Conc}}^{2} \\ \end{aligned}$$\end{document}Table 7ANOVA results for the key variables affecting Cu^2+^ ion removal, as determined by the Box–Behnken design.SourceSum of squaresdfMean squareF-valuep-valueModel4762.049529.122877.51< 0.0001Significant A-MAPA dose235.851235.851282.61< 0.0001 B-Time359.661359.661955.93< 0.0001 C-Cu dose3968.3813968.3821581.41< 0.0001 AB7.7017.7041.880.0003 AC54.07154.07294.07< 0.0001 BC35.11135.11190.92< 0.0001 A²0.358110.35811.950.2055 B²2.1012.1011.410.0118 C²100.411100.41546.06< 0.0001Residual1.2970.1839 Lack of fit1.2930.4291 Pure error0.000040.0000Cor total4763.3316Std. dev.0.4288R²0.9997Mean38.49Adjusted R²0.9994C.V. %1.11Predicted R²0.9957Adeq precision176.2150
Figure 16 illustrates the combined influence of reaction time, adsorbent dosage, and initial Cu^2+^ concentration on the removal efficiency of Cu^2+^ ions. Low Cu^2+^ concentrations, large MAPA adsorbent doses, and prolonged reaction durations all contribute to the best removal percentages^79–81^.
Fig. 16. Combined effects of independent variables: (A,B) Adsorbent dose and time, (C,D) MAPA Adsorbent dose and Cu^2+^ initial concentration, and (E,F) Cu^2+^ initial concentration and time.
The best operating settings to attain the maximum Cu^2+^ removal % were found statistically, as shown in Fig. 17.
Fig. 17. Optimization conditions through BBD settings.
Mechanism of Cu2+ ions adsorption by MPAP
The probable method by which MPAP absorbed the Cu^2+^ ions at 5.0 pH value is described in Fig. 18. The FTIR analysis shows the presence of various functional groups on the MPAP surface, including -NH_2_, -NH, -OH, -C ≡ N, -C-H, Fe-H and -CH_2_ groups. The XPS analyses proved the presence of Fe, Si and N doped in the prepared composite (MAPA) besides the presence of C and O. The adsorption mechanism of the dye ions in an acidic solution (pH 5.0) can be achieved by physical contact due to the electrostatic interaction between the Cu^2+^ ions and the nitrogen and oxygen lone pair on the MAPA surface^82,83^. The adsorption of ionizable organic molecules to the positively charged surface of the MPAP is the most significant process, and it is mediated by electrostatic interactions. How successfully an aqueous solution attracts or repels impurities depends on its pH and ionic strength^84–89^.
Fig. 18. The most likely method for adsorbing the AO7 dye onto the prepared SNDB adsorbent.
Conclusion
Using batch experiments, a magnetic amino polyacrylonitrile nanocomposite (MAPA) was created and used as an adsorbent to remove Cu^2+^ ions from aqueous solutions. Cu^2+^ ion removal from aqueous solutions was assessed using a magnetic amino polyacrylonitrile (MAPA) nanocomposite. The material, exhibiting a magnetization value of 11.098 emu/g, was fully investigated utilizing XRD, FTIR, XPS, BET, TGA, SEM, and VSM studies. Its effectiveness as an adsorbent was validated by the results, which showed that it performed best at pH 5.5, reaching a removal efficiency of 32.4%. Under the most advantageous experimental conditions, an initial Cu^2+^ ion concentration of 50 mg/L and an adsorbent dosage of 5.0 g/L, the nanocomposite reached a removal effectiveness of 78.3%. The maximal adsorption capacity (qm) was determined to be 5.65 mg/g. Kinetic modeling demonstrated that the adsorption process conformed to the Pseudo-second-order model (PSO), while equilibrium data were best represented by the Langmuir isotherm model (LIM), suggesting monolayer adsorption on a homogeneous surface. Furthermore, the nanocomposite exhibited reusability, as adsorbed Cu^2+^ ions could be effectively desorbed using sodium hydroxide, highlighting its cost-effectiveness for practical water treatment applications. RSM was used to optimize the parameters, and the results showed that utilizing 5.12 g of the MAPA adsorbent and 51.51 mg/L of Cu^2+^ solution in 58.6 min could get the highest degradation percentage (75.65%). The MAPA nanocomposite demonstrates strong Cu^2+^ adsorption capacity, magnetic recoverability, and process optimization proven by ANN and RSM modeling. Future studies can test the feasibility of using this innovative material in expansion, its application to other metals, and the environmental sustainability of this material.
The reference list from the paper itself. Each links out to its DOI / PubMed record.
- 1Hussain, A., Madan, S. & Madan, R. Removal of heavy metals from wastewater by adsorption. Heavy Metals—Their Environ. Impacts Mitigation. 10.5772/intechopen.95841 (2021).
- 2Maftouh, A., El Fatni, O., Hajjaji, E., Jawish, S. & Sillanpää, M. M.W. Comparative review of different adsorption techniques used in heavy metals removal in water. Biointerface Res. Appl. Chem.13 (4) (2023).
- 3Ullah, R. et al. Sustainable clay-polymer adsorbents for emerging contaminants removal: a review. Int. J. Environ. Anal. Chem. 1–23 (2025).
- 4Nosratabad, N. A., Yan, Q., Cai, Z. & Wan, C. Exploring nanomaterial-modified Biochar for environmental remediation applications. Heliyon 10, e 37123 (2024).10.1016/j.heliyon.2024.e 37123 PMC 1141719839315228 · doi ↗ · pubmed ↗
- 5Sing, K. S. Reporting physisorption data for gas/solid systems with special reference to the determination of surface area and porosity (Recommendations 1984). Pure Appl. Chem.57 (4), 603–619 (1985).
- 6Lujan, J. R., Darnall, D. W., Stark, P. C., Rayson, G. D. & Gardea-Torresdey, J. L. Metal ion binding by algae and higher plant tissues. Solvent Extr. Ion Exch.12 (4) (1994).
- 7Bishop, C. M. Neural Networks for Pattern Recognition (Oxford University Press, 1995).
- 8Meky, A. I., Hassaan, M. A., Fetouh, H. A., Ismail, A. M. & Nemr, E. A. Hydrothermal fabrication, characterization and RSM optimization of cobalt-doped zinc oxide nanoparticles for antibiotic photodegradation under visible light. Sci. Rep.14 (1), (2016). 10.1038/s 41598-024-52430-8 (2024).10.1038/s 41598-024-52430-8PMC 1123134438263230 · doi ↗ · pubmed ↗