The Time of the Hypertonic Saline Infusion Test for the Diagnosis of AVP Deficiency Can Be Shortened With LC-MS/MS
Tomoko Handa, Daisuke Hagiwara, Ryutaro Maeda, Takashi Miyata, Tomoko Kobayashi, Mariko Sugiyama, Takeshi Onoue, Shintaro Iwama, Hidetaka Suga, Ryoichi Banno, Yachiyo Kuwatsuka, Hiroshi Arima

TL;DR
This study shows that using LC-MS/MS to measure AVP during a hypertonic saline test can diagnose AVP deficiency more quickly and accurately than traditional methods.
Contribution
The study demonstrates that LC-MS/MS can shorten the hypertonic saline infusion test duration for AVP deficiency diagnosis.
Findings
LC-MS/MS showed 100% sensitivity and 96% specificity in diagnosing AVP-D at 90 minutes.
The diagnostic accuracy of LC-MS/MS at 90 minutes was higher than RIA.
Shortening the HST to 90 minutes is feasible with LC-MS/MS without compromising diagnostic performance.
Abstract
In clinical practice, plasma arginine vasopressin (AVP) concentrations have been measured with a radioimmunoassay (RIA). However, RIAs have limitations, such as long turnaround time, use of radioisotopes, and restricted antibody availability. Liquid chromatography-tandem mass spectrometry (LC-MS/MS) offers a promising alternative, eliminating the need for radioisotopes and antibodies while providing faster results. This study aimed to assess the usefulness of LC-MS/MS for measuring plasma AVP concentrations in diagnosing AVP deficiency (AVP-D). We included 16 patients with AVP-D and 28 controls. All participants underwent a hypertonic saline infusion test (HST), during which plasma AVP concentrations were measured using RIA and LC-MS/MS. Regression coefficients (gradients) for serum sodium vs plasma AVP concentrations were evaluated at 90 and 120 minutes, and receiver-operating…
Genes, proteins, chemicals, diseases, species, mutations and cell lines named across the full text — each resolved to its canonical identifier and authoritative record.
Click any figure to enlarge with its caption.
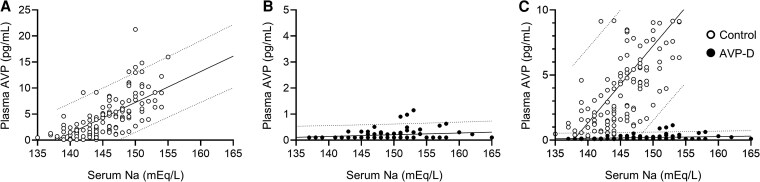 Figure 1
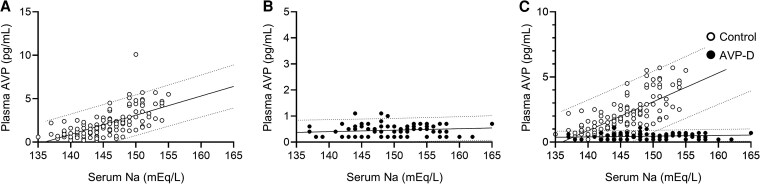 Figure 2
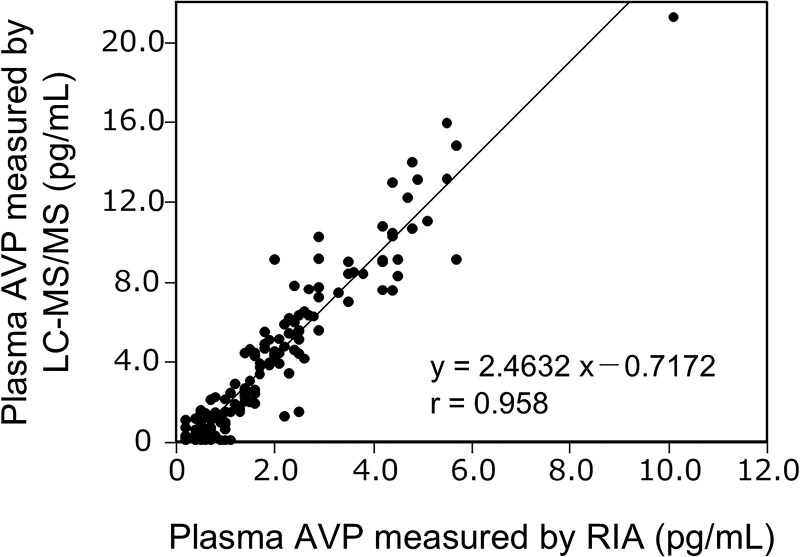 Figure 3
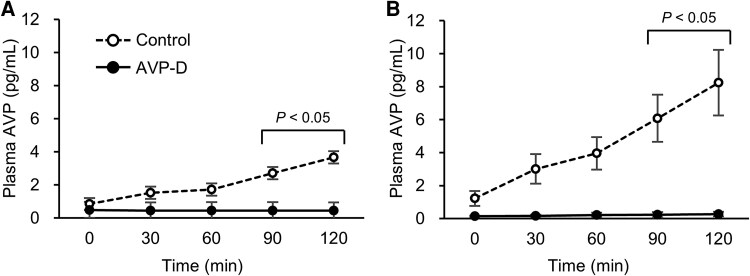 Figure 4
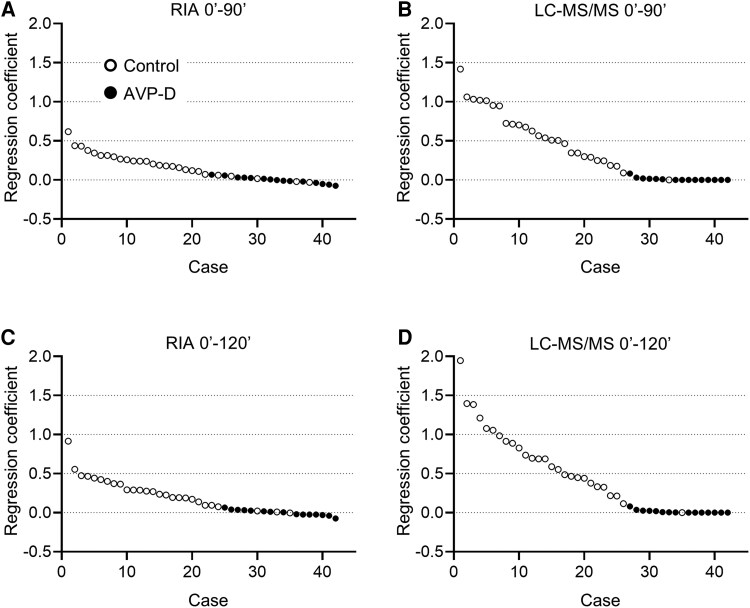 Figure 5
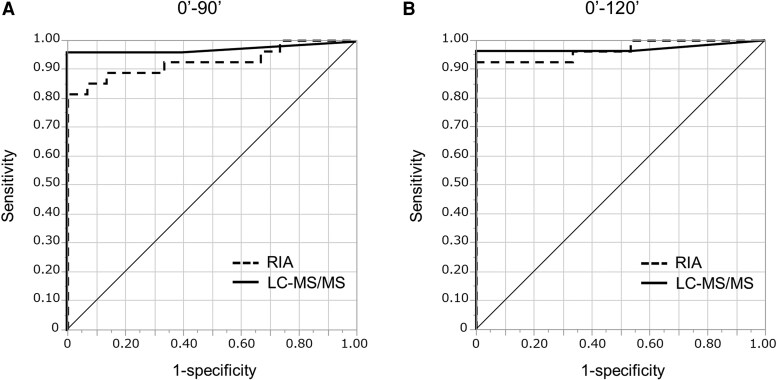 Figure 6
| Case no. | Gender | Age (y) | Diagnosis | Daily urine volume | Urine osmolality (mOsm/kg) | Timing of evaluation | Tumor size (mm) | |
|---|---|---|---|---|---|---|---|---|
| (mL) | (mL/kg) | |||||||
| C1 | M | 68 | Nonfunctioning pituitary tumor (apoplexy) | 1700 | 25.6 | 849 | — | 21 |
| C2 | M | 57 | Acromegaly | 1500 | 13.9 | 676 | Before medical therapy | N/A |
| C3 | M | 60 | N/A | 1100 | 10.4 | 1151 | — | N/A |
| C4 | M | 54 | N/A | 1150 | 14.9 | 486 | — | N/A |
| C5 | F | 58 | Nonfunctioning pituitary tumor | 2800 | 38.5 | 372 | — | 18 |
| C6 | F | 61 | Cushing disease | 1000 | 14.6 | n.d. | Before TSS | 12 |
| C7 | F | 46 | Cushing disease | 1700 | 23.0 | 338 | Before TSS | N/A |
| C8 | M | 59 | Acromegaly | 2400 | 35.9 | 577 | Before TSS | 9 |
| C9 | F | 50 | Acromegaly | ND | ND | 594 | Before TSS | 10 |
| C10 | F | 27 | N/A | 1500 | 34.9 | ND | — | N/A |
| C11 | F | 51 | Acromegaly | 900 | 13.2 | ND | Before TSS | 23 |
| C12 | M | 49 | Empty sella | 2800 | 32.0 | 186 | — | N/A |
| C13 | F | 61 | Acromegaly | 840 | 18.3 | 807 | Before TSS | 41 |
| C14 | F | 53 | Acromegaly | 2000 | 23.8 | 558 | Before TSS | 25 |
| C15 | F | 78 | N/A | 1490 | 43.8 | 606 | — | N/A |
| C16 | F | 79 | ACTH deficiency | 1000 | 21.1 | 453 | — | N/A |
| C17 | M | 53 | Nonfunctioning pituitary tumor | 1170 | 18.5 | 825 | Before TSS | 29 |
| C18 | M | 28 | Hypogonadism | 960 | 31.0 | 805 | — | N/A |
| C19 | M | 33 | TSH-producing pituitary tumor | 700 | 13.6 | 817 | Before TSS | 42 |
| C20 | M | 68 | ACTH deficiency | 2130 | 34.7 | 387 | — | N/A |
| C21 | F | 55 | Nonfunctioning pituitary tumor (recurrence) | 2150 | 32.5 | 433 | After TSS | 25 |
| C22 | M | 57 | ACTH deficiency (irAE) | 1120 | 17.1 | 851 | — | N/A |
| C23 | F | 52 | Nonfunctioning pituitary tumor | 1960 | 31.9 | 592 | Before TSS | 25 |
| C24 | M | 70 | Nonfunctioning pituitary tumor | 900 | 10.4 | 581 | Before TSS | 30 |
| C25 | F | 18 | N/A | 800 | 14.6 | ND | — | N/A |
| C26 | F | 48 | Psychogenic polydipsia | 4100 | 62.7 | 91 | — | — |
| C27 | F | 64 | Acromegaly | 1260 | 23.4 | 525 | Before TSS | 15 |
| C28 | M | 56 | TSH-producing pituitary tumor (postoperative) | 1860 | 30.2 | 534 | After TSS | N/A |
| Case no. | Gender | Age (y) | Time after diagnosis (y) | Daily urine volume | Urine osmolality (mOsm/kg) | Etiology | DDAVP (μg) | Coexisting diseases | |
|---|---|---|---|---|---|---|---|---|---|
| (mL) | (mL/kg) | ||||||||
| AVP-D1 | M | 47 | 0 | ND | ND | 75 | Nonfunctioning pituitary tumor (postoperative) | ODT (120) | — |
| AVP-D2 | F | 72 | 0 | 5500 | 100.2 | 96 | Rathke's cleft cyst | ODT (60) | — |
| AVP-D3 | M | 73 | 0 | 4680 | 69.2 | ND | Nonfunctioning pituitary tumor | ODT (60) | Panhypopituitarism |
| AVP-D4 | M | 40 | 0 | ND | ND | ND | Nonfunctioning pituitary tumor (postoperative) | ODT (60) | Acromegaly, hypopituitarism (ACTH, TSH, LH, FSH, PRL) |
| AVP-D5 | F | 62 | 5 | 4500 | 72.5 | 19 | Nonfunctioning pituitary tumor (postoperative) | ODT (60) | Cushing disease, hypopituitarism (TSH, LH, FSH, GH, PRL) |
| AVP-D6 | M | 54 | 0 | 4300 | 62.0 | 277 | Rathke's cleft cyst | ODT (120) | Hypopituitarism (GH) |
| AVP-D7 | F | 18 | 5 | 7800 | 188.4 | 76 | Germ cell tumor (after chemoradiation therapy) | ODT (360) | Panhypopituitarism |
| AVP-D8 | F | 81 | 0 | 3500 | 87.6 | 204 | Idiopathic | ODT (60) | Pituitary microadenoma |
| AVP-D9 | F | 66 | 0 | 3350 | 74.9 | 203 | Idiopathic | ODT (60) | — |
| AVP-D10 | F | 30 | 0 | 5270 | 66.0 | 106 | Rathke's cleft cyst, Modest enlargement of the pituitary gland | ODT (120) | Hypopituitarism (GH) |
| AVP-D11 | M | 76 | 0 | 2770 | 65.8 | 246 | Pituitary metastasis of salivary gland carcinoma | ODT (60) | Hypopituitarism (ACTH, TSH, LH, FSH, GH) |
| AVP-D12 | M | 76 | 0 | ND | ND | ND | Nonfunctioning pituitary tumor (postoperative) | — | Panhypopituitarism |
| AVP-D13 | F | 57 | 0 | 6550 | 104.6 | 312 | Rathke's cleft cyst | ODT (120) | Hypopituitarism (LH) |
| AVP-D14 | F | 33 | 0 | 8000 | 106.7 | 148 | Rathke's cleft cyst (postoperative) | ODT (120) | Hypopituitarism (LH, FSH, GH) |
| AVP-D15 | F | 47 | 17 | ND | ND | ND | Craniopharyngioma (postoperative) | ODT (120) | Hypopituitarism (ACTH, TSH, LH, FSH, GH) |
| AVP-D16 | F | 35 | 0 | 3300 | 26.9 | 165 | Idiopathic | ODT (60) | Pituitary microadenoma |
| Control | AVP-D | |
|---|---|---|
| Na (mEq/L) (0 minutes) | 140 ± 3.0 | 144 ± 5.1 |
| Na (mEq/L) (30 minutes) | 144 ± 3.6 | 147 ± 5.1 |
| Na (mEq/L) (60 minutes) | 146 ± 3.5 | 150 ± 6.4 |
| Na (mEq/L) (90 minutes) | 148 ± 3.7 | 152 ± 5.9 |
| Na (mEq/L) (120 minutes) | 149 ± 3.4 | 153 ± 6.5 |
| AVP (pg/mL) (0 minutes) | 1.2 ± 0.2 | 0.1 ± 0.02 |
| AVP (pg/mL) (30 minutes) | 3.0 ± 0.4 | 0.2 ± 0.03 |
| AVP (pg/mL) (60 minutes) | 4.0 ± 0.5 | 0.2 ± 0.1 |
| AVP (pg/mL) (90 minutes) | 6.1 ± 0.7 | 0.2 ± 0.1 |
| AVP (pg/mL) (120 minutes) | 8.2 ± 1.0 | 0.3 ± 0.1 |
| Control | AVP-D | |
|---|---|---|
| Na (mEq/L) (0 minutes) | 140 ± 3.0 | 144 ± 5.1 |
| Na (mEq/L) (30 minutes) | 144 ± 3.6 | 147 ± 5.1 |
| Na (mEq/L) (60 minutes) | 146 ± 3.5 | 150 ± 6.4 |
| Na (mEq/L) (90 minutes) | 148 ± 3.7 | 152 ± 5.9 |
| Na (mEq/L) (120 minutes) | 149 ± 3.4 | 153 ± 6.5 |
| AVP (pg/mL) (0 minutes) | 0.8 ± 0.1 | 0.5 ± 0.1 |
| AVP (pg/mL) (30 minutes) | 1.5 ± 0.1 | 0.4 ± 0.1 |
| AVP (pg/mL) (60 minutes) | 1.7 ± 0.2 | 0.5 ± 0.1 |
| AVP (pg/mL) (90 minutes) | 2.7 ± 0.3 | 0.5 ± 0.1 |
| AVP (pg/mL) (120 minutes) | 3.6 ± 0.4 | 0.4 ± 0.05 |
| AUC of ROC | 95% CI | Sensitivity | Specificity | Optimal cutoff | |
|---|---|---|---|---|---|
| RIA method (up to 90 minutes) | 0.9284 | 0.7991-0.9769 | 1.0000 | 0.8148 | 0.0673 |
| LC-MS/MS method (up to 90 minutes) | 0.9741 | 0.8328-0.9965 | 1.0000 | 0.9630 | 0.0820 |
| RIA method (up to 120 minutes) | 0.9679 | 0.8653-0.9930 | 1.0000 | 0.9259 | 0.0656 |
| LC-MS/MS method (up to 120 minutes) | 0.9716 | 0.8187-0.9962 | 1.0000 | 0.9630 | 0.0806 |
| Control group (n = 28) | AVP-D group (n = 16) | |
|---|---|---|
| Thirst | 13 (46.4%) | 6 (37.5%) |
| Nausea | 2 (7.1%) | 2 (12.5%) |
| Vomiting | 0 (0%) | 1 (6.3%) |
| Headache | 2 (7.1%) | 1 (6.3%) |
| Dizziness | 1 (3.6%) | 2 (12.5%) |
| Other | 8 (28.6%) | 4 (25.0%) |
| Fatigue | 0 (0%) | 1 (6.3%) |
| Vascular pain | 2 (7.1%) | 1 (6.3%) |
| Injection site pain | 2 (7.1%) | 0 (0%) |
| Upper extremity pain | 2 (7.1%) | 1 (6.3%) |
| Arm heaviness | 1 (3.6%) | 0 (0%) |
| Hand numbness | 1 (3.6%) | 1 (6.3%) |
| Undiluted (pg/mL) | 3-fold diluted (pg/mL) | |
|---|---|---|
| No. 1 | 10.12 | 3.05 |
| No. 2 | 6.25 | 2.36 |
| No. 3 | 10.86 | 4.26 |
| No. 4 | 10.25 | 3.73 |
- —YAMASA Shoyu Corporation
- —JEOL Ltd
Peer Reviews
No public reviews on file for this paper yet. If you reviewed it on a platform where reviews are public (OpenReview, ICLR, NeurIPS, ICML), you can paste yours below so the community can read it here.
Videos
No videos yet. Explain this paper in a talk, walkthrough, or lecture? Add one.
Taxonomy
TopicsElectrolyte and hormonal disorders · Neonatal Respiratory Health Research · Neuroendocrine regulation and behavior
The magnocellular neurons of the supraoptic and paraventricular nuclei of the hypothalamus synthesize arginine vasopressin (AVP), which is delivered through axonal transport to the posterior pituitary and then released into the systemic circulation to promote water reabsorption in the renal collecting ducts. AVP production and secretion are tightly regulated by plasma osmolality, maintaining water balance homeostasis, whereas AVP system impairment results in AVP deficiency (AVP-D), characterized by polydipsia and polyuria.
Copeptin has been used as a surrogate biomarker of AVP in Europe, where sensitive AVP measurement systems are not widely available (1). The half-life of copeptin, derived from the AVP precursor preprovasopressin, is approximately twice as long as that of AVP (26 vs 12 minutes) and is more stable than AVP, making it easier to measure (2). Thus, the hypertonic saline infusion test (HST) with copeptin measurements has been recommended for AVP-D diagnosis (3-5). The difference in half-life are not a problem when serum sodium concentrations are stable, and previous studies demonstrated >95% accuracy for AVP-D diagnosis using copeptin measurements (3). However, this difference in half-life could still theoretically lead to a dissociation between copeptin and AVP concentrations under hyperosmolar or hypoosmolar conditions, when plasma AVP concentrations change dynamically. In Japan, high-sensitivity AVP measurements using a radioimmunoassay (RIA) and HST have been used to diagnose AVP-D. During the HST, 5% sodium chloride is infused intravenously at a rate of 0.05 mL/kg/min for 2 hours, and serum sodium and plasma AVP concentrations are measured before and every 30 minutes after the injection (6, 7). Plasma AVP increases in response to increasing serum sodium concentrations in the control, whereas a blunted or absent AVP response indicates AVP-D (8). In our previous study, RIA-based plasma AVP measurement during HST achieved 100% sensitivity and 77% specificity for AVP-D diagnosis when the regression gradient of plasma AVP against serum sodium concentration is <0.1 (9). However, the RIA for AVP is labor-intensive and time-consuming, and RIAs are limited by antibody availability.
Generally, liquid chromatography-tandem mass spectrometry (LC-MS/MS) offers advantages in specificity, selectivity, quantification accuracy, and safety compared with RIA (10-12). Moreover, it directly measures peptide masses and fragments, eliminating cross-reactivity issues inherent to antibody-based assays. Additionally, isotope-labeled internal standards in LC-MS/MS enhance quantification accuracy and reproducibility, whereas RIA may be affected by batch-to-batch variability in antibody production. LC-MS/MS does not require radioactive materials, unlike RIA, simplifying handling and disposal. Recently, plasma AVP concentrations have been measured using LC-MS/MS (13-15), with a detection limit of 0.2 pg/mL compared with RIA's 0.4 pg/mL (13). Thus, AVP can be reliably measured using LC-MS/MS; however, no studies have directly compared AVP concentrations using RIA and LC-MS/MS in clinically collected samples.
In this study, we performed the HST in patients with AVP-D and controls. RIA and LC-MS/MS were used to measure AVP concentrations to assess the usefulness of LC-MS/MS for AVP-D diagnosis.
Material and Methods
Patients
We enrolled 28 patients without AVP-D (control group; 13 males, 15 females) and 16 patients with AVP-D (AVP-D group; 6 males, 10 females). The mean age was 54.0 ± 2.7 and 54.2 ± 4.8 years in the control and AVP-D groups, respectively. The patients were classified as not having AVP-D if they met all the following criteria: (1) urine volume <3000 mL/day, (2) urine osmolality >300 mOsm/kg under euhydrated conditions or >600 mOsm/kg after a water deprivation test, and (3) presence of a hyperintense signal in the posterior pituitary on T1-weighted pituitary magnetic resonance imaging (MRI). AVP-D was diagnosed based on comprehensive clinical data, including urine volume, urine osmolality, absence of a hyperintense signal on T1-weighted pituitary MRI, response to 1-deamino-8-D-arginine vasopressin (DDAVP), and established diagnostic cutoff values for serum sodium and plasma AVP concentrations measured with the RIA during the HST (9). All participants were examined at Nagoya University Hospital between April 2021 and March 2024. The institutional review board of Nagoya University approved the study, and all participants provided written informed consent. The study was registered with the University Hospital Medical Information Network registry (UMIN000043023).
HST
Before the HST, which commenced at 0900 hours, the participants remained in a supine position for 30 minutes. A 5% saline solution was administered at a rate of 0.05 mL/kg/min for 120 minutes. Blood samples were collected before and at 30, 60, 90, and 120 minutes after infusion. Samples were immediately placed on ice after collection and stored at 4 °C. Centrifugation was performed at 4 °C within 1 hour after completion of the HST to separate the serum and plasma, which were stored at −80 °C until analysis.
Plasma AVP Measurement
RIA kit (Yamasa Cat# 80114, RRID:AB_2801274; YAMASA CORPORATION, Choshi, Japan) and LC-MS/MS with the JeoQuant Kit for AVP (JEOL Ltd., Tokyo, Japan) were used to measure plasma AVP concentrations during the HST. In the RIA method, AVP was extracted from the plasma using the cold ethanol method, with a 0.4 pg/mL detection limit (16). The LC-MS/MS assay used isotope dilution mass spectrometry with 300 µL plasma, achieving a lower limit of quantification of 0.2 pg/mL (13).
Statistical Analysis
A simple regression line was calculated for each subject to assess the correlation between serum sodium and plasma AVP concentrations during the HST. The regression coefficients (gradients) were compared between the control and AVP-D groups. To assess the diagnostic accuracy, we performed receiver-operator characteristic (ROC) curve analyses and area under the curve calculations, with 95% CI using the DeLong method. Statistical analyses were conducted using GraphPad Prism 9 (GraphPad Software, Boston, MA, USA), Stata 18.0 (StataCorp LLC, College Station, TX, USA), and JMP Pro 17.2.0 (SAS Institute, Cary, NC, USA). All continuous variables are expressed as mean ± SE.
Results
Patients
In the control group, 22 of 28 patients (78.6%) had hypothalamic pituitary disorders, including nonfunctioning pituitary tumors (n = 6), acromegaly (n = 7), Cushing disease (n = 2), TSH-producing pituitary tumors (n = 2), empty sella (n = 1), adrenocorticotropic hormone deficiency (n = 3), and hypogonadism (n = 1) (Table 1). All cases had hyperintense signals on T1-weighted pituitary MRI.
Three patients in the AVP-D group were previously diagnosed with AVP-D (Table 2). The remaining 13 patients were newly diagnosed during the study (yr = 0). The mean daily urine volume in the AVP-D group before DDAVP administration was 4960 ± 502 mL (85.4 ± 11.3 mL/kg) (n = 12), with a urine osmolality of 160.6 ± 26.0 mOsm/kg (n = 12). In the AVP-D group, 7 patients showed mild to moderate polyuria (<5000 mL/day) suggesting partial AVP-D, and 5 showed prominent polyuria (>5000 mL/day). All patients with AVP-D had diminished or no hyperintense signals on T1-weighted pituitary MRI. Seven patients had concurrent endocrine disorders, including secondary adrenal insufficiency and hypothyroidism, and they were started with hydrocortisone and thyroid hormone replacement before HST.
Plasma AVP Concentrations During HST Measured by RIA and LC-MS/MS
We presented serum sodium and plasma AVP concentrations measured by LC-MS/MS (Fig. 1; Table 3) and RIA (Fig. 2; Table 4) during HST. Plasma AVP concentrations measured by LC-MS/MS showed a strong correlation with those measured by RIA (r = 0.958, Fig. 3). Notably, LC-MS/MS yielded higher AVP values than the RIA, particularly at higher AVP concentrations (Figs. 3 and 4). Significant differences were observed in the plasma AVP concentrations at 90 and 120 minutes for each measurement method between the AVP-D and control groups during HST (Fig. 4).
Serum sodium and plasma AVP concentrations during HST, with AVP measured using LC-MS/MS in the control (A, open circles, n = 28) and AVP-D groups (B, closed circles, n = 16) along with a comparison of both groups (C). The dashed lines indicate the 95% prediction intervals for the plasma AVP concentrations in each group.
Serum sodium and plasma AVP concentrations during HST, with AVP measured using RIA. (A) Control group (open circles, n = 28). (B) AVP-D group (closed circles, n = 16). (C) Comparison of both groups. Dashed lines indicate the 95% prediction intervals for the plasma AVP concentrations in each group.
Correlation between AVP concentrations measured using RIA and LC-MS/MS during HST.
Changes in plasma AVP concentrations during HST in the control (open circles, dashed line) and AVP-D groups (closed circles, solid line), with AVP measured using RIA (A) and LC-MS/MS (B). The results are expressed as mean ± SE. P < .05 compared with the control group at each corresponding time point.
Comparison of Regression Line Gradients During HST Using RIA and LC-MS/MS
Regression coefficients (gradients) for serum sodium vs plasma AVP concentrations measured using the RIA and LC-MS/MS were calculated at 90 (4 time points, Fig. 5A and B) and 120 minutes (5 time points, Fig. 5C and D) during HST. ROC analysis was performed to assess the diagnostic accuracy of AVP-D based on these regression coefficients (Fig. 6). The area under the curve of the ROC curve for HST at 90 and 120 minutes was 0.93 (95% CI, 0.80-0.98) and 0.97 (95% CI, 0.87-0.99) for the RIA method and 0.97 (95% CI, 0.83-1.00) and 0.97 (95% CI, 0.82-1.00) for the LC-MS/MS method, respectively (Table 5). A regression gradient cutoff value of 0.0673 at 90 minutes and 0.0656 at 120 minutes distinguished AVP-D from controls with a sensitivity of 100% and 100% and a specificity of 81% and 93% at 90 and 120 minutes using RIA, respectively (Table 5). Using a cutoff value of 0.0820 at 90 minutes and 0.0806 at 120 minutes, LC-MS/MS achieved 100% sensitivity and 96% specificity at 90 and 120 minutes (Table 5).
Regression coefficients (gradients) for serum sodium vs plasma AVP concentrations, measured using RIA and LC-MS/MS at 90 minutes (A, B) and 120 minutes (C, D) during HST in the control (open circles) and AVP-D groups (closed circles). The regression coefficients are arranged in descending order from left to right.
ROC curves of the regression coefficients (gradients) for AVP-D diagnosis using RIA (dashed line) and LC-MS/MS (solid line) based on HST data for 90 minutes (A) and 120 minutes (B).
Adverse Events During and After the HST
Table 6 lists the adverse events during HST. A total of 25 adverse events occurred within 90 minutes of HST initiation, whereas 4 additional events (thirst, nausea, headache, and dizziness) were observed between 90 and 120 minutes. All events were tolerable.
Discussion
We evaluated the plasma AVP concentrations in HST, a widely recognized method for assessing AVP secretion, using RIA and LC-MS/MS. Regression coefficients between serum sodium and plasma AVP concentrations were calculated at 90 and 120 minutes, and ROC analysis was used to assess the diagnostic accuracy for AVP-D. Our data showed that both measurements could be used to diagnose AVP-D. Notably, sensitivity or specificity did not differ between 90 and 120 minutes in LC-MS/MS. However, the specificity was lower at 90 minutes than at 120 minutes in RIA, indicating that 90 minutes is enough for HST when LC-MS/MS was used for AVP measurements.
The detection limit of AVP is 0.2 and 0.4 pg/mL with LC-MS/MS (13) and RIA, respectively (16). The time needed for the measurement with LC-MS/MS is a few hours (13), whereas it is several days for RIA. A rabbit polyclonal antibody is used in the YAMASA AVP RIA kit, and the reported cross-reactivity with structurally related peptides such as 8-arginine vasotocin, 8-lysine vasopressin, oxytocin, and DDAVP is 0.09%, 0.001%, <0.001%, and <0.001%, respectively (16). However, it is unclear if there is any cross-reactivity with AVP metabolites such as desglycinamide 9-AVP in the RIA. In contrast, AVP measurement using LC-MS/MS can distinguish compounds with different molecular masses from AVP (13), eliminating interference from structurally similar peptides such as DDAVP, 8-arginine vasotocin, 8-lysine vasopressin, oxytocin, and AVP metabolites. This analytical specificity represents a notable advantage of the LC-MS/MS method over RIA for measuring AVP.
A comparative analysis of AVP concentrations measured by RIA and LC-MS/MS demonstrated a strong correlation between both methods (Fig. 3). However, LC-MS/MS yielded higher AVP values than RIA at higher AVP concentrations (Fig. 3). The exact mechanisms underlying the discrepancy between LC-MS/MS and RIA remain unclear. Nonetheless, the AVP concentrations measured by LC-MS/MS were also approximately one-third of the undiluted values when the samples were diluted to one-third (Table 7), indicating the reliability of AVP measurement at a high concentration with LC-MS/MS. Our findings that LC-MS/MS can distinguish AVP-D from the control at 90 minutes in HST may be, at least in part, due to higher values of plasma AVP concentrations in LC-MS/MS than in RIA. Reducing HST time could lower the peak of sodium concentrations, thereby minimizing hypernatremia-related adverse events, such as thirst, which commonly occur during HST (3, 17). We observed four additional adverse events between 90 and 120 minutes. Thus, AVP measurements with LC-MS/MS would reduce the burden of patients with AVP-D during HST.
The water deprivation test has traditionally been used for the differential diagnosis of polyuria-polydipsia syndromes (18). However, the water deprivation test requires a longer duration than the HST, and patients with AVP-D have been reported to prefer the HST (3). Moreover, copeptin measurements did not improve the diagnostic accuracy of the water deprivation test for AVP-D (3).
In previous studies (2, 3, 19), 3% saline was used for the HST, with an initial bolus of 250 mL followed by continuous infusion at 0.15 mL/kg/min; blood samples were collected every 30 minutes until the serum sodium concentrations exceeded 150 mEq/L. In contrast, the 2023 Japanese guidelines for the diagnosis and treatment of hypothalamic pituitary dysfunction recommends the use of 5% saline at 0.05 mL/kg/min for 2 hours without an initial bolus (8). This protocol gradually increases in serum sodium concentrations to approximately 150 mEq/L. Here, using 5% saline, the serum sodium concentration in the AVP-D group reached 152 ± 5.9 and 153 ± 6.5 mEq/L at 90 and 120 minutes, respectively (Tables 3 and 4). These values are comparable to those reported in studies that used 3% saline, in which serum sodium concentrations in patients with complete AVP-D reached approximately 153 mEq/L at approximately 80 minutes and those in patients with partial AVP-D reached approximately 152 mEq/L at approximately 100 minutes (3). Adverse events, such as nausea and vomiting, were observed with both protocols. Local vascular pain at the infusion site, potentially because of the high osmolarity of 5% saline, was reported in 1 patient in this study. It is of note that neither 3% nor 5% HST is suitable for pediatric subjects or for patients with impaired thirst sensation where serum sodium concentrations could be high even under basal conditions.
LC-MS/MS is a quantitative analytical technique highly sensitive and selective; it has been widely used to measure compounds, such as vitamin D, steroid hormones, immunosuppressants, and peptides (12, 20-23). However, the LC-MS/MS system is expensive and requires highly skilled personnel for its setup, operation, and maintenance. Thus, infrastructure and human resources limit the broad implementation of LC-MS/MS in clinical laboratories, particularly in developing countries. Moreover, the AVP in the serum is susceptible to enzymatic degradation, requiring careful sample handling before extraction, even if the measurement time is shorter in LC-MS/MS than in RIA. In contrast, the analyzers of copeptin are not available in some countries and the measurement is not covered by the Japanese national health insurance system. Thus, the choice of assays, AVP or copeptin, depends on their availability in each country.
This study has several limitations. First, although differentiating partial AVP-D from primary polydipsia is most challenging in clinical practice, only 1 patient with primary polydipsia was included in the control group. In addition, none of the participants had a water deprivation test in this study, whereas 7 patients showed mild to moderate polyuria (<5000 mL/day), so we are uncertain about how many patients with partial AVP-D were included in the AVP-D group. Second, this is the first pilot study involving a small sample size; larger studies with primary polyuria and partial AVP-D patients are warranted to confirm the findings. Third, we have not compared AVP measured by LC-MS/MS with copeptin, which is an important future direction.
In conclusion, AVP measurement using LC-MS/MS demonstrated high diagnostic accuracy for AVP-D at 90 minutes in HST, indicating that the HST time could be shortened by measuring the plasma AVP concentrations with LC-MS/MS.
The reference list from the paper itself. Each links out to its DOI / PubMed record.
- 1Refardt J, Christ-Crain M. Copeptin-based diagnosis of diabetes insipidus. Swiss Med Wkly. 2020;150(1920):w 20237.32374887 10.4414/smw.2020.20237 · doi ↗ · pubmed ↗
- 2Fenske WK, Schnyder I, Koch G, et al Release and decay kinetics of copeptin vs AVP in response to osmotic alterations in healthy volunteers. J Clin Endocrinol Metab. 2018;103(2):505‐513.29267966 10.1210/jc.2017-01891 · doi ↗ · pubmed ↗
- 3Fenske W, Refardt J, Chifu I, et al A copeptin-based approach in the diagnosis of diabetes insipidus. N Engl J Med. 2018;379(5):428‐439.30067922 10.1056/NEJ Moa 1803760 · doi ↗ · pubmed ↗
- 4Atila C, Refardt J, Christ-Crain M. Arginine vasopressin deficiency: diagnosis, management and the relevance of oxytocin deficiency. Nat Rev Endocrinol. 2024;20(8):487‐500.38693275 10.1038/s 41574-024-00985-x · doi ↗ · pubmed ↗
- 5Refardt J, Atila C, Christ-Crain M. New insights on diagnosis and treatment of AVP deficiency. Rev Endocr Metab Disord. 2024;25(3):639‐649.38087160 10.1007/s 11154-023-09862-w PMC 11162367 · doi ↗ · pubmed ↗
- 6Milles JJ, Spruce B, Baylis PH. A comparison of diagnostic methods to differentiate diabetes insipidus from primary polyuria: a review of 21 patients. Acta Endocrinol. 1983;104(4):410‐416.10.1530/acta.0.10404106659843 · doi ↗ · pubmed ↗
- 7Arima H, Azuma Y, Morishita Y, Hagiwara D. Central diabetes insipidus. Nagoya J Med Sci. 2016;78(4):349‐358.28008190 10.18999/nagjms.78.4.349PMC 5159460 · doi ↗ · pubmed ↗
- 8Guideline 2023 for hypothalamic pituitary dysfunction, congenital nephrogenic diabetes insipidus and related disorders. J Jpn Endocr Soc. 2023;99(Suppl):1‐171.