Influence of white blood cell count trajectories on the risk of differentiation syndrome during induction therapy with all-trans-retinoic acid and arsenic trioxide in pediatric acute promyelocytic leukemia
Houxin Fu, Yuchen Liu, Shaoyan Hu

TL;DR
This study shows that changes in white blood cell counts during treatment can predict the risk of a serious complication in children with a type of leukemia.
Contribution
The study identifies specific white blood cell trajectory patterns linked to increased risk of differentiation syndrome in pediatric APL patients.
Findings
Four distinct white blood cell count trajectory classes were identified in pediatric APL patients.
Patients with high-level increasing or low-level increasing WBC trajectories had significantly higher DS risk.
Class 1 patients required more frequent transfusions during induction therapy.
Abstract
This study aims to investigate the association between early dynamic trajectories of white blood cell (WBC) count and the risk of differentiation syndrome (DS) during induction therapy with All-trans-retinoic Acid (ATRA) combined with arsenic trioxide (ATO) in pediatric patients with acute promyelocytic leukemia (APL). A retrospective cohort of pediatric APL patients treated with ATRA and ATO induction therapy between January 2016 and December 2024 is analyzed. Latent growth mixture modeling (LGMM) is employed to identify distinct WBC count trajectories over the first seven days of induction therapy. DS is diagnosed according to Frankel's criteria. Logistic regression analyses are performed to evaluate associations between WBC trajectory classes and the occurrence of DS, treatment-related complications, and transfusion requirements. A total of 93 patients are included, with an overall…
Genes, proteins, chemicals, diseases, species, mutations and cell lines named across the full text — each resolved to its canonical identifier and authoritative record.
Click any figure to enlarge with its caption.
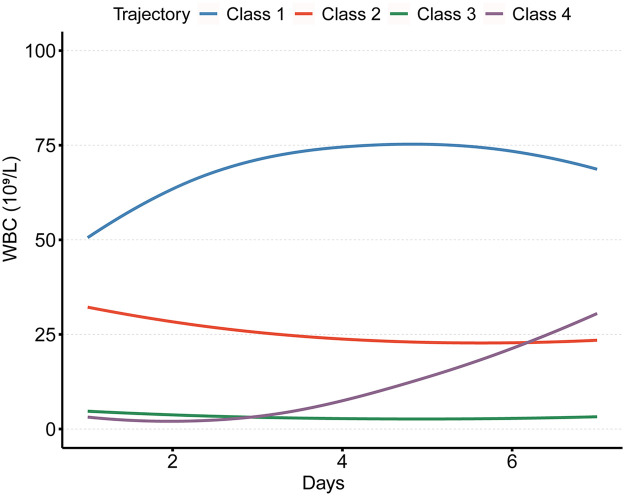 Figure 1
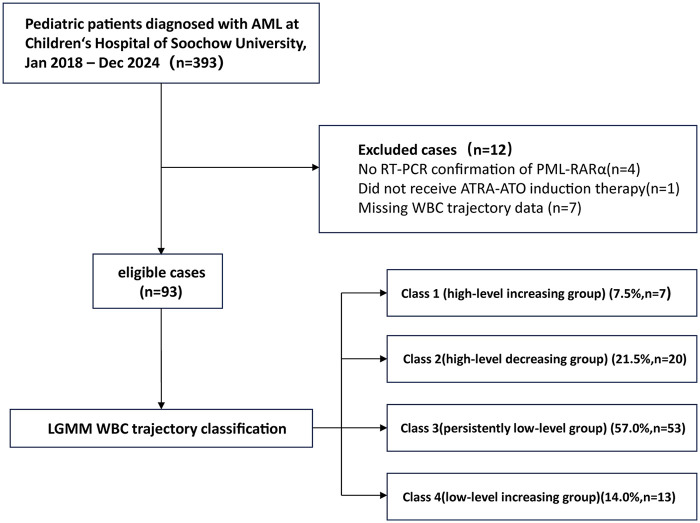 Figure 2
| Number of classes | Log likelihood | AIC | BIC | SABIC | Entropy | %class1 | %class2 | %class3 | %class4 |
|---|---|---|---|---|---|---|---|---|---|
| 2.0 | −1,876.9 | 3,785.8 | 3,826.3 | 3,775.8 | 0.9 | 36.6 | 63.4 | ||
| 3.0 | −1,871.0 | 3,781.9 | 3,832.6 | 3,769.4 | 0.9 | 35.5 | 3.2 | 61.3 | |
| 4.0 | −1,857.9 | 3,763.9 | 3,824.7 | 3,748.9 | 0.9 | 7.5 | 21.5 | 57.0 | 14.0 |
| Characteristic | Total ( | Class 1 ( | Class 2 ( | Class 3 ( | Class 4 ( | |
|---|---|---|---|---|---|---|
| Age(year) | 8.3 (5.6, 11.2) | 11.2 (7.9, 12.1) | 7.6 (5.5, 12.5) | 8.3 (5.5, 11.2) | 10.2 (7.7, 10.9) | 0.507 |
| Female, | 41 (44.1) | 24 (45.3) | 10 (50) | 2 (28.6) | 5 (38.5) | 0.799 |
| BMI | 16.4 (15.4, 20.1) | 18.1 (16.5, 19.6) | 17.1 (15.1, 23.0) | 16.0 (14.9, 18.6) | 19.1 (17.3, 20.2) | 0.035 |
| FLT3-ITD, | 29 (31.2) | 4 (57.1) | 7 (35) | 16 (30.2) | 2 (15.4) | 0.31 |
| Infection, | 57 (61.3) | 5 (71.4) | 15 (75) | 28 (52.8) | 9 (69.2) | 0.29 |
| DIC, | 56 (60.2) | 6 (85.7) | 16 (80) | 27 (50.9) | 7 (53.8) | 0.067 |
| Hepatomegaly, | 29 (31.2) | 4 (57.1) | 6 (30) | 14 (26.4) | 5 (38.5) | 0.359 |
| Splenomegaly, | 23 (24.7) | 6 (85.7) | 4 (20) | 9 (17) | 4 (30.8) | 0.003 |
| Hemoglobin(g/L) | 84.0 (72.0, 95.0) | 84.0 (71.5, 89.0) | 76.5 (67.2, 91.0) | 87.0 (74.0, 97.0) | 83.0 (74.0, 97.0) | 0.301 |
| Neutrophil(109 /L) | 0.8 (0.3, 3.7) | 25.6 (14.7, 109.6) | 4.6 (2.3, 8.6) | 0.4 (0.2, 1.0) | 0.4 (0.3, 0.5) | < 0.001 |
| Platelet(109 /L) | 36.0 (22.0, 80.0) | 28.0 (18.5, 60.0) | 28.5 (21.8, 55.0) | 41.0 (27.0, 80.0) | 82.0 (22.0, 87.0) | 0.297 |
| Bone marrow blasts (%) | 87.0 (75.0, 91.0) | 95.0 (82.0, 95.5) | 87.9 (75.0, 92.9) | 85.0 (74.0, 89.0) | 87.0 (73.0, 89.0) | 0.246 |
| CD117 flow (%) | 89.0 (16.9, 97.1) | 11.5 (3.3, 57.2) | 88.9 (48.3, 96.3) | 89.1 (25.7, 97.8) | 91.1 (16.5, 95.2) | 0.546 |
| CD34+, No. of pts (%) | 46 (49.5) | 2 (28.6) | 8 (40) | 30 (56.6) | 6 (46.2) | 0.383 |
| DD, | 52 (55.9) | 6 (85.7) | 12 (60) | 25 (47.2) | 9 (69.2) | 0.174 |
| INR, Mean ± SD | 1.4 ± 0.3 | 1.6 ± 0.3 | 1.4 ± 0.2 | 1.3 ± 0.2 | 1.4 ± 0.3 | 0.003 |
| FIB(g/L) | 1.6 (1.2, 2.2) | 1.2 (1.0, 1.5) | 1.3 (0.9, 2.0) | 1.8 (1.4, 2.3) | 1.9 (1.2, 2.4) | 0.104 |
| ALB(g/L) | 44.5 (41.6, 47.4) | 44.7 (43.1, 45.0) | 44.0 (39.1, 47.9) | 44.0 (41.9, 47.0) | 46.2 (43.1, 48.3) | 0.776 |
| BUN(mmol/L) | 4.2 (3.5, 4.9) | 4.9 (4.6, 5.3) | 4.2 (3.2, 4.7) | 4.1 (3.5, 4.8) | 4.1 (3.5, 5.7) | 0.185 |
| Cr(µmol/L) | 36.8 (30.1, 46.0) | 46.0 (37.6, 48.6) | 34.8 (31.7, 47.5) | 34.5 (27.6, 44.6) | 37.4 (36.8, 45.3) | 0.106 |
| cTnT(ng/L) | 3.0 (2.4, 5.6) | 0.0 (0.0, 0.2) | 4.6 (2.6, 6.8) | 2.6 (2.4, 5.3) | 3.0 (2.6, 3.4) | 0.067 |
| CKMB(U/L) | 0.9 (0.6, 1.8) | 0.7 (0.6, 1.0) | 0.7 (0.5, 1.1) | 1.1 (0.6, 2.5) | 0.7 (0.3, 1.6) | 0.054 |
| DS, | 38 (40.9) | 6 (85.7) | 11 (55) | 12 (22.6) | 9 (69.2) | < 0.001 |
| Characteristic | Univariate analysis | Multivariate analysis | ||||
|---|---|---|---|---|---|---|
| OR | 95% CI | OR | 95% CI | |||
| Class 1 | 20.5 | 2.24–187.36 | 0.007 | 12.07 | 1.17–124.71 | 0.037 |
| Class 2 | 4.18 | 1.4–12.43 | 0.01 | 2.69 | 0.82–8.84 | 0.103 |
| Class 3 | Reference | Reference | ||||
| Class 4 | 7.69 | 2.01–29.42 | 0.003 | 8.35 | 1.94–35.92 | 0.004 |
| Female, | 0.87 | 0.38–2.01 | 0.749 | |||
| Age(year) | 1.05 | 0.93–1.18 | 0.422 | |||
| BMI | 1.09 | 0.98–1.21 | 0.119 | |||
| Infection | 2.51 | 1.03–6.15 | 0.044 | 2.57 | 0.86–7.64 | 0.089 |
| Bone marrow blasts (%) | 1.02 | 1–1.05 | 0.109 | |||
| FLT3.ITD | 2.35 | 0.96–5.75 | 0.061 | |||
| Hepatomegaly, | 1.91 | 0.78–4.65 | 0.154 | |||
| Splenomegaly, | 1.85 | 0.71–4.78 | 0.206 | |||
| DIC, | 2.2 | 0.91–5.3 | 0.078 | |||
| CD117 flow (%) | 1 | 0.99–1.01 | 0.594 | |||
| CD34, | 0.5 | 0.22–1.17 | 0.111 | |||
| Hemoglobin(g/L) | 1 | 0.97–1.02 | 0.787 | |||
| Neutrophil(109 /L) | 1.03 | 0.99–1.06 | 0.099 | |||
| Platelet(109 /L) | 0.99 | 0.99–1 | 0.286 | |||
| DD, | 1.99 | 0.85–4.68 | 0.113 | |||
| INR, Mean ± SD | 14.25 | 2.23–90.96 | 0.005 | 2.1 | 0.2–22.4 | 0.54 |
| FIB(g/L) | 0.43 | 0.23–0.8 | 0.007 | 0.44 | 0.2–0.97 | 0.042 |
| ALB(g/L) | 0.99 | 0.97–1.02 | 0.555 | |||
| BUN(mmol/L) | 1.32 | 0.95–1.83 | 0.1 | |||
| Cr(µmol/L) | 1.01 | 0.98–1.05 | 0.338 | |||
| CKMB(U/L) | 1.04 | 0.95–1.14 | 0.432 | |||
| cTnT(ng/L) | 1.03 | 0.91–1.17 | 0.65 | |||
| Variables | Overall ( | Class 1 ( | Class 2 ( | Class3 ( | Class 4 ( | |
|---|---|---|---|---|---|---|
| Infection, | 76 (81.7) | 6 (85.7) | 18 (90) | 42 (79.2) | 10 (76.9) | 0.801 |
| Abnormal liver function, | 19 (20.4) | 2 (28.6) | 5 (25) | 11 (20.8) | 1 (7.7) | 0.606 |
| Transfusion of plasma, Median (IQR) | 200.0 (0, 900) | 1,200.0 (400, 2,400) | 800.0 (200, 1,450) | 0.0 (0, 750) | 200.0 (0, 800) | 0.013 |
| Transfusion of red blood cells, Median (IQR) | 2.0 (0, 4) | 4.0 (2.5, 7) | 3.0 (2, 6) | 2.0 (0, 2) | 2.0 (2, 5) | <0.001 |
| Transfusion of platelets, Median (IQR) | 40.0 (20, 60) | 80.0 (50, 100) | 50.0 (40, 60) | 20.0 (10, 40) | 60.0 (40, 75) | <0.001 |
Peer Reviews
No public reviews on file for this paper yet. If you reviewed it on a platform where reviews are public (OpenReview, ICLR, NeurIPS, ICML), you can paste yours below so the community can read it here.
Videos
No videos yet. Explain this paper in a talk, walkthrough, or lecture? Add one.
Taxonomy
TopicsRetinoids in leukemia and cellular processes · Acute Myeloid Leukemia Research · Acute Lymphoblastic Leukemia research
Introduction
Acute promyelocytic leukemia (APL) represents a distinct subtype of acute myeloid leukemia (AML), accounting for approximately 10%–15% of AML cases. It is characterized by abnormal white blood cell (WBC) counts, thrombocytopenia, coagulopathy, and a high risk of hemorrhage (1–4). The advent of combination therapy with All-trans-retinoic Acid (ATRA) and arsenic agents has markedly improved the cure rate for patients with APL (5, 6). Differentiation syndrome (DS) is a common complication associated with treatment using ATRA and arsenic compounds such as arsenic trioxide (ATO), with reported incidence rates as high as 48% (7–9). DS may lead to severe, potentially life-threatening complications; thus, early recognition and prompt intervention are critical (10, 11).
Recent studies identify leukocytosis and WBC doubling during ATRA-ATO induction therapy as independent risk factors for DS in patients with APL (1, 12). However, WBC counts fluctuate dynamically during induction therapy, and to date, no studies have systematically examined how different WBC trajectory patterns influence the risk of DS.
This study aims to identify early WBC trajectory subtypes during ATRA-ATO induction therapy in pediatric APL and to evaluate the associations between these trajectory patterns and the risk of DS, as well as other treatment-related adverse events. The goal is to establish a more refined risk stratification model that facilitates early identification of high-risk patients and informs optimized intervention strategies, thereby improving clinical outcomes.
Methods
Study patient cohorts
In this retrospective study, 93 pediatric patients diagnosed with APL were treated with a combination of ATRA-ATO therapy at the Department of Hematology, Children's Hospital of Soochow University, between 2016 and 2024. The inclusion criteria are as follows: (1) diagnosis of APL confirmed by detection of the PML-RARα rearrangement using reverse transcription-polymerase chain reaction (RT-PCR) (13); (2) age ≤18 years; and (3) initiation of ATRA-ATO therapy immediately after diagnosis. Patients lacking data on peripheral WBC counts are excluded from the study (Figure 1).
Flowchart for study participants enrolling.
Treatment for all patients follows the NCCN guidelines (14), primarily involving a combination of ATRA-ATO therapy. Upon confirmation of APL, therapy was initiated immediately: ATRA 25 mg/(m^2^·day) plus ATO 0.15 mg/(kg·day) administered continuously until complete remission (CR) was achieved. Therapeutic-dose low molecular weight heparin (LMWH) was initiated concomitantly with ATRA–ATO and continued until coagulopathy resolved. Upon diagnosis of DS during induction therapy for newly diagnosed APL, ATRA is immediately reduced or discontinued, and dexamethasone, along with appropriate supportive care, is administered until resolution of clinical symptoms.
The study was approved by the Ethics Committee of the Children's Hospital of Soochow University(2021KS003). Given that no additional interventions were conducted, the requirement for informed consent was waived by the institutional review board. All data utilized were anonymized and could not be traced back to individual patients.
Exposure
In this study, exposure is defined as the trajectory of WBC count variations from day 1 to day 7 following the initiation of ATRA-ATO therapy. The identification of distinct WBC count trajectories was performed using Latent Growth Mixture Modeling (LGMM). An unconditional quadratic growth model was specified within the LGMM framework to model the WBC count from day 1 to day 7 of induction therapy. To determine the optimal number of latent classes, a series of models was estimated, beginning with a single-class quadratic growth model and incrementally increasing the number of classes up to four. Model fit was compared using the following statistical indices: log-likelihood, Akaike Information Criterion (AIC), Bayesian Information Criterion (BIC), sample-size adjusted BIC (SABIC), and entropy. Lower values of AIC, BIC, and SABIC, along with higher log-likelihood and entropy, signify a better model fit. The model estimation utilized robust maximum likelihood estimation, and all models successfully converged based on standard criteria (15).
Data collection
Baseline data include demographic characteristics (age, sex, height, and weight), FLT3-ITD mutation status, presence of infection at initial diagnosis, disseminated intravascular coagulation (DIC), ultrasound findings (hepatosplenomegaly), bone marrow promyelocyte percentage [BM promyelocytes (%)], CD117 expression by flow cytometry, CD34 expression by flow cytometry, baseline WBC count, hemoglobin (HB), platelet count, absolute neutrophil count, absolute monocyte count, serum creatinine (SCr), blood urea nitrogen (BUN), international normalized ratio (INR), D-dimer, fibrinogen (FIB), albumin, lactate dehydrogenase (LDH), creatine kinase-MB (CKMB), and cardiac troponin T (cTNT). Baseline WBC is defined as the highest value recorded before the initiation of retinoic acid therapy, or, if unavailable, as the first WBC measurement upon hospital admission. Missing covariate data are addressed through multiple imputation. To reduce information bias, variables with a missing rate exceeding 10% are excluded from the analysis.
Outcome
The primary outcome of this study is the occurrence of DS in pediatric patients with APL during treatment with ATRA-ATO in combination with arsenic. The diagnosis of DS is based on the Frankel criteria (3), which include unexplained fever, dyspnea, pleural or pericardial effusion, pulmonary infiltrates, renal failure, hypotension, and weight gain ≥5 kg. A diagnosis of DS is established when at least two of these manifestations are present. Each potential event was independently reviewed by two senior hematologists; disagreements were resolved by consensus or a third senior physician, ensuring objective and consistent outcome assessment. Only DS episodes occurring during the ATRA-ATO induction period were counted.
Secondary outcomes include the development of various treatment-related complications, such as abnormal liver function and infections, as well as transfusion requirements, including platelet, red blood cell, and plasma transfusion volumes.
Statistical analysis
All statistical analyses are performed using R software (version 4.4.2) and Python software (version 3.13). LGMM was conducted using the lcmm package (version 2.1.0) in R. Continuous variables with a normal distribution are described using means and standard deviations, and differences across trajectory classes are assessed using analysis of variance (ANOVA). Variables not normally distributed are summarized as medians with interquartile ranges (IQRs), and intergroup differences are evaluated using the Kruskal–Wallis test. Categorical variables are presented as frequencies and percentages, and differences between groups are examined using the χ^2^ test or Fisher's exact test, as appropriate. Odds ratios (ORs) and 95% confidence intervals (CIs) are estimated using univariable and multivariable logistic regression analyses. A two-sided p-value of less than 0.05 is considered statistically significant.
Results
LGMM analysis and baseline characteristics
The goodness-of-fit statistics for the LGMM models are presented in
Table 1. The four-class model yields the lowest values for the AIC, BIC, and SABIC, indicating the best model fit. Therefore, the four-class model is selected as the optimal solution.
The trajectories of WBC count changes across the four-class LGMM model are depicted in Figure 2. Class 1 (high-level increasing group) comprises 7.5% of the cohort and is characterized by the highest initial WBC count, which rises before declining, presenting an inverted V-shaped pattern. Class 2(high-level decreasing group) includes 21.5% of patients and begins with moderately elevated WBC counts, lower than those in Class 1, followed by a gradual decrease, ultimately remaining higher than the levels in Class 3. Class 3(persistently low-level group) accounts for 57.0% of patients, with consistently low and stable WBC counts throughout the observation period. Class 4(low-level increasing group), representing 14.0% of the cohort, shows initially low and stable WBC levels, followed by a progressive increase, ultimately exceeding those in Class 2 but remaining below those in Class 1.
Four classes identified by trajectories of white blood cell count.
A total of 93 patients are included in the study, and their baseline characteristics are summarized in Table 2. The incidence of DS following treatment with ATRA-ATO in patients with APL is 40.9%. The median age of the patients is 8.3 years, and 55.9% are male. Compared with other trajectory classes, patients in Class 1 exhibit higher baseline neutrophil counts and INR values at diagnosis, a greater frequency of splenomegaly, and the highest incidence of DS (85.7%). Patients in Class 4 have the highest body mass index (BMI) and a DS incidence of 69.2%, second only to that of Class 1. Class 3 includes the largest number of patients and is characterized by the lowest BMI, INR, and DS incidence (22.6%).
Univariate and multivariate analyses
Univariate analysis demonstrated that, compared to Class 3, patients in Class 1 (OR: 20.5, 95% CI: 2.24–187.36), Class 2 (OR: 4.18, 95% CI: 1.40–12.43), and Class 4 (OR: 7.69, 95% CI: 2.01–29.42) were at significantly higher risk of developing DS. In addition, infection at diagnosis (OR: 2.51, 95% CI: 1.03–6.15), elevated INR (OR: 14.25, 95% CI: 2.23–90.96), and lower FIB levels (OR: 0.43, 95% CI: 0.23–0.80) are identified as predictors of DS. Multivariate logistic regression further confirms that patients in Class 1 (OR: 11.37, 95% CI: 1.17–124.71) and Class 4 (OR: 8.34, 95% CI: 1.94–35.92) remain at significantly increased risk for DS compared to those in Class 3, while no significant difference in DS risk is observed between Class 2 and Class 3. FIB is identified as an independent protective factor against the development of DS. The results of both univariate and multivariate analyses are presented in Table 3.
Correlation of the trajectory of WBC count with treatment complications and transfusion support
No statistically significant differences are observed in the incidence of infection or liver dysfunction among the groups during induction. However, Group 1 is found to require significantly more intensive transfusion support during induction, including red blood cells, platelets, and plasma, with particularly high demands for red blood cell and platelet transfusions (p < 0.001), as reported in Table 4.
Discussion
WBC count plays a critical role in the diagnosis and risk stratification of APL and is closely associated with the development of DS (16). Previous studies have demonstrated this association: Gao et al. (12), using GLMM, identify WBC doubling and WBC peak as independent risk factors for DS, while Laura Cicconi et al. (1), through multicenter data, show that elevated WBC count is a strong predictor of DS. As a dynamic and continuous parameter, WBC count is analyzed in this study using LGMM to investigate its trajectory over the first seven days of ATRA-ATO induction therapy in newly diagnosed APL patients and its association with DS. Four distinct trajectory classes are identified: Class 1 is characterized by the highest initial WBC count, which rises before declining, presenting an inverted V-shaped pattern; Class 2 shows a high initial WBC count that gradually decreases; Class 3 maintains consistently low WBC counts; Class 4 exhibits low initial WBC counts that gradually increase. Significant differences in clinical characteristics and DS risk are observed among these subgroups. Multivariable logistic regression analysis reveals that compared to Class 3 patients, those in Classes 1 and 4 have a significantly higher risk of developing DS. Additionally, patients in Class 1 require more frequent transfusion support during induction therapy.
In this study, nearly half of the patients receiving ATRA-ATO therapy develop leukocytosis during induction, which is consistent with previous findings reporting that up to 60% of patients treated with ATRA-ATO experience elevated WBC counts during induction (5, 17).
The results indicate that patients in Class 1 exhibit a higher risk of developing DS compared to those in Class 3, which aligns with prior studies demonstrating that high WBC counts at the initiation of therapy are an independent risk factor for DS (18), and that patients with continuously increasing WBC counts have an elevated risk of DS (1).
However, based on previous findings, the use of LGMM in this study provides a more nuanced classification of WBC trajectories, revealing that patients in Class 4 (low-level increasing group) also have an increased risk of DS compared to Class 3 (persistently low-level group), while those in Class 2 (high-level decreasing group) do not show a statistically significant difference in DS risk relative to Class 3 (persistently low-level group).Patients who begin with a low WBC count but show a sustained upward trend still face a markedly increased risk of differentiation syndrome. This finding underscores the limitations of relying on a single, static WBC threshold at treatment initiation for risk stratification. Consequently, during the first week of therapy, we should monitor dynamic WBC trends in all patients—not just those with high initial values—and consider early intervention (e.g., prophylactic corticosteroids) for anyone exhibiting a steady rise, regardless of their starting WBC level.On the other hand, the findings also extend prior knowledge regarding patients with high initial WBC counts. Even when the initial WBC count exceeds 10 × 10^9^ /L, different trajectory patterns during early induction therapy suggest varying DS risks. If the WBC trajectory demonstrates a continuous decline, the risk of DS is not significantly higher than that in patients with persistently low WBC counts. This indicates that early interventions leading to a declining WBC trajectory may reduce DS risk, even in patients presenting with high baseline WBC counts.
Therefore, these findings provide evidence supporting the NCCN guidelines, which recommend that a WBC peak exceeding 10 × 10^9^ /L serves as a clear indication for prophylactic corticosteroid use.
As for the mechanism underlying leukocytosis, several hypotheses have been proposed (17, 19). The proliferation hypothesis suggests that ATRA-ATO therapy targets the PML-RARα fusion protein to induce differentiation and maturation of APL cells; however, the differentiated granulocytes retain proliferative capacity, and an increased number of divisions during differentiation results in a rapid surge in mature granulocyte counts within a short period.
The cytokine storm hypothesis proposes that ATRA treatment significantly upregulates granulocyte colony-stimulating factor (G-CSF) expression, which reverses the antiproliferative effects of ATRA on HL-60 cells and alters the dynamics of c-myc gene expression, thereby promoting cell cycle progression.
In addition, existing preclinical studies suggest a potential link between leukocytosis during APL treatment and the development of DS. ATRA and ATO degrade the PML-RARα fusion protein, releasing transcriptional repression, which in turn leads to abnormal proliferation and differentiation of promyelocytes, causing a rapid increase in peripheral WBC counts (18–21).
Inflammatory cytokines released by activated granulocytes, such as IL-1β, IL-6, and TNF-α, as well as vascular endothelial growth factor (VEGF), act in a paracrine manner to increase vascular permeability, promoting capillary leakage and organ edema (22). Furthermore, interactions between WBCs and endothelial cells are enhanced, and the upregulation of adhesion molecules, such as ICAM-1 and VCAM-1, contributes to microcirculatory disturbances, exacerbating tissue hypoxia and inflammatory responses (23, 24).
This study, through the application of LGMM, reveals for the first time a potential association between WBC trajectory patterns during ATRA-ATO therapy and the risk of DS in pediatric APL patients, which may provide a basis for early risk stratification. The findings are rigorously adjusted for multiple covariates and comprehensively assess secondary outcomes such as transfusion requirements, thereby enhancing their clinical translational value.
However, several limitations should be acknowledged. First, the single-center retrospective design may introduce selection bias, limiting the generalizability of the conclusions. Second, although Class 1 exhibits an extremely high incidence of DS, its small sample size limits the precision of the estimate; confirmation in larger, prospective cohorts is therefore essential. Third, unmeasured confounders, such as genetic variations or cytokine profiles, may influence WBC dynamics and the underlying mechanisms of DS development. Four, although the association between WBC trajectories and transfusion requirements is intriguing, it remains unadjusted for baseline coagulopathy and other confounders because of sample-size constraints; this relationship should be rigorously tested in larger, prospective cohorts. Additionally, although the seven-day observation window has practical clinical relevance, it may fail to capture later fluctuations in WBC counts.
Conclusion
The trajectory of WBC counts during ATRA-ATO therapy in pediatric APL patients may serve as an indicator for predicting the risk of DS. Both the high-level increasing group and the low-level increasing group are identified as independent risk factors for DS, and patients in the high-level increasing group tend to require more frequent transfusion support during induction therapy.
The reference list from the paper itself. Each links out to its DOI / PubMed record.
- 1Cicconi L Bisegna M Gurnari C Fanciullo D Piciocchi A Marsili G Leucocytosis during induction therapy with all-trans-retinoic acid and arsenic trioxide in acute promyelocytic leukaemia predicts differentiation syndrome and treatment-related complications. Br J Haematol. (2024) 205(5):1727–33. 10.1111/bjh.1975939275865 · doi ↗ · pubmed ↗
- 2Yilmaz M Kantarjian H Ravandi F. Acute promyelocytic leukemia current treatment algorithms. Blood Cancer J. (2021) 11(6):123. 10.1038/s 41408-021-00514-334193815 PMC 8245494 · doi ↗ · pubmed ↗
- 3Winkler C. Acute promyelocytic leukemia. N Engl J Med. (2024) 390(17):e 42. 10.1056/NEJ Micm 231416238683728 · doi ↗ · pubmed ↗
- 4Ho G Li Q Brunson A Jonas BA Wun T Keegan THM. Complications and early mortality in patients with acute promyelocytic leukemia treated in California. Am J Hematol. (2018) 93(11):E 370–2. 10.1002/ajh.2525230105792 PMC 6486372 · doi ↗ · pubmed ↗
- 5Sanz MA Fenaux P Tallman MS Estey EH Löwenberg B Naoe T Management of acute promyelocytic leukemia: updated recommendations from an expert panel of the European Leukemia Net. Blood. (2019) 133(15):1630–43. 10.1182/blood-2019-01-89498030803991 PMC 6509567 · doi ↗ · pubmed ↗
- 6Abrahão R Ribeiro RC Malogolowkin MH Wun T Keegan THM. Early mortality and survival improvements for adolescents and young adults with acute promyelocytic leukemia in California: an updated analysis. Haematologica. (2022) 107(3):733–6. 10.3324/haematol.2021.27885134320784 PMC 8883531 · doi ↗ · pubmed ↗
- 7Ghiaur A Doran C Gaman MA Ionescu B Tatic A Cirstea M Acute promyelocytic leukemia: review of complications related to all-trans retinoic acid and arsenic trioxide therapy. Cancers (Basel). (2024) 16(6):1160. 10.3390/cancers 1606116038539495 PMC 10969096 · doi ↗ · pubmed ↗
- 8Gurnari C Voso MT Girardi K Mastronuzzi A Strocchio L. Acute promyelocytic leukemia in children: a model of precision medicine and chemotherapy-free therapy. Int J Mol Sci. (2021) 22(2):642. 10.3390/ijms 2202064233440683 PMC 7826974 · doi ↗ · pubmed ↗