NOS2/ARG1 axis and immune cell ratios as promising prognostic and predictive biomarkers for Cetuximab combined with chemotherapy in wt-KRAS human colorectal cancer
Djehane Houria Mataam, Assia Galleze, Sarra Benkhelifa, Ryad Trari, Wafa Khelaifia, Said Belhadef, Sabrina Bouhara, Sonia Ait Younes, Anissa Benali, Hassan Mahfouf, Olivier Morales, Houda Belguendouz, Nadira Delhem, Chafia Touil-Boukoffa, Hayet Rafa

TL;DR
This study identifies the NOS2/ARG1 axis and immune cell ratios as potential biomarkers for predicting treatment response and survival in colorectal cancer patients treated with cetuximab.
Contribution
The study introduces a novel combined score integrating NO, arginase, SII, and SIRI as a non-invasive biomarker for prognosis and treatment prediction in colorectal cancer.
Findings
High baseline SII, SIRI, and ARG levels predict poorer survival in mCRC patients.
Elevated NO levels are associated with better outcomes in cetuximab-treated patients.
A combined score of NO, ARG, SII, and SIRI shows higher prognostic value than individual markers.
Abstract
Resistance to epidermal growth factor receptor monoclonal antibodies (anti-EGFR), such as cetuximab, remains a major therapeutic challenge. Growing evidence suggests that local tumor immune cells and systemic inflammation influence therapeutic outcomes. Our study aimed to investigate the balance between nitric oxide synthase-2 (NOS2) and arginase-1 (ARG1) expression and its association with immune contexture and clinical outcome in cetuximab-treated colorectal cancer patients. 100 patients with colorectal cancer (CRC) were included in this study. NOS2 and ARG1 expression and their metabolites were assessed using RT-qPCR, immunofluorescence, and biochemical assays. Tumor-infiltrating CD68+ pan-macrophages, CD163+ M2 like- macrophage, and CD8+ T cells were assessed using immunohistochemistry and immunofluorescence. Baseline complete blood counts were used to calculate systemic immune…
Genes, proteins, chemicals, diseases, species, mutations and cell lines named across the full text — each resolved to its canonical identifier and authoritative record.
Click any figure to enlarge with its caption.
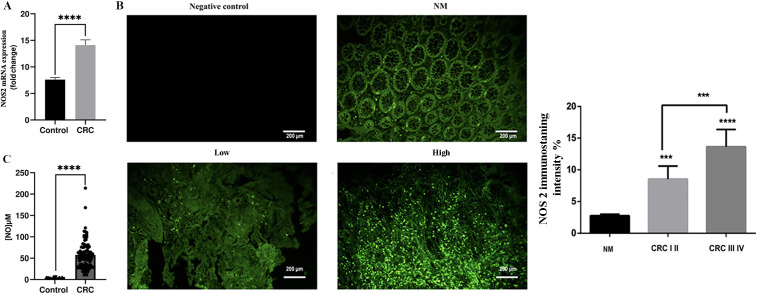 Figure 1
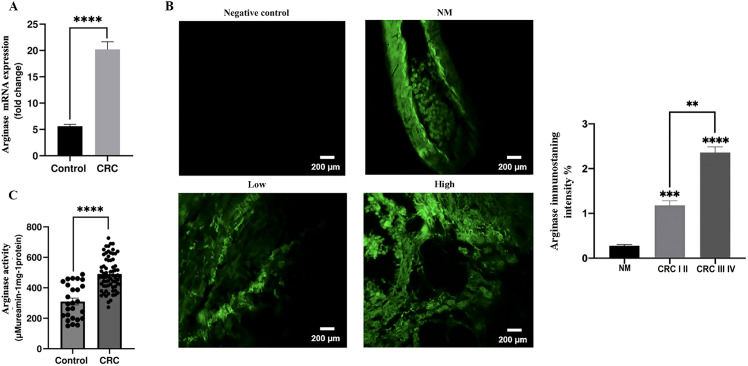 Figure 2
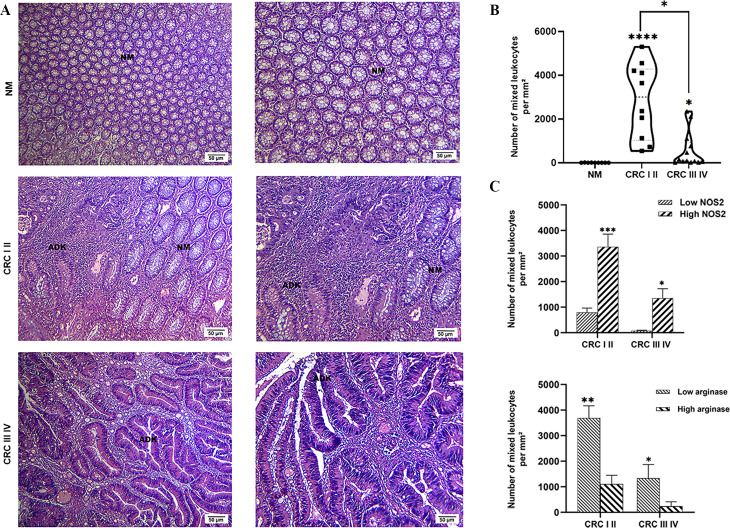 Figure 3
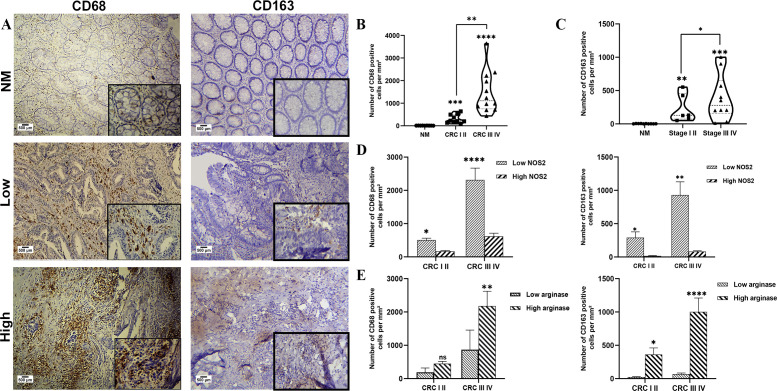 Figure 4
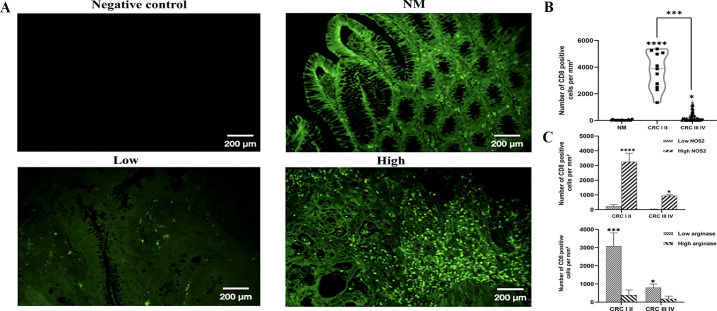 Figure 5
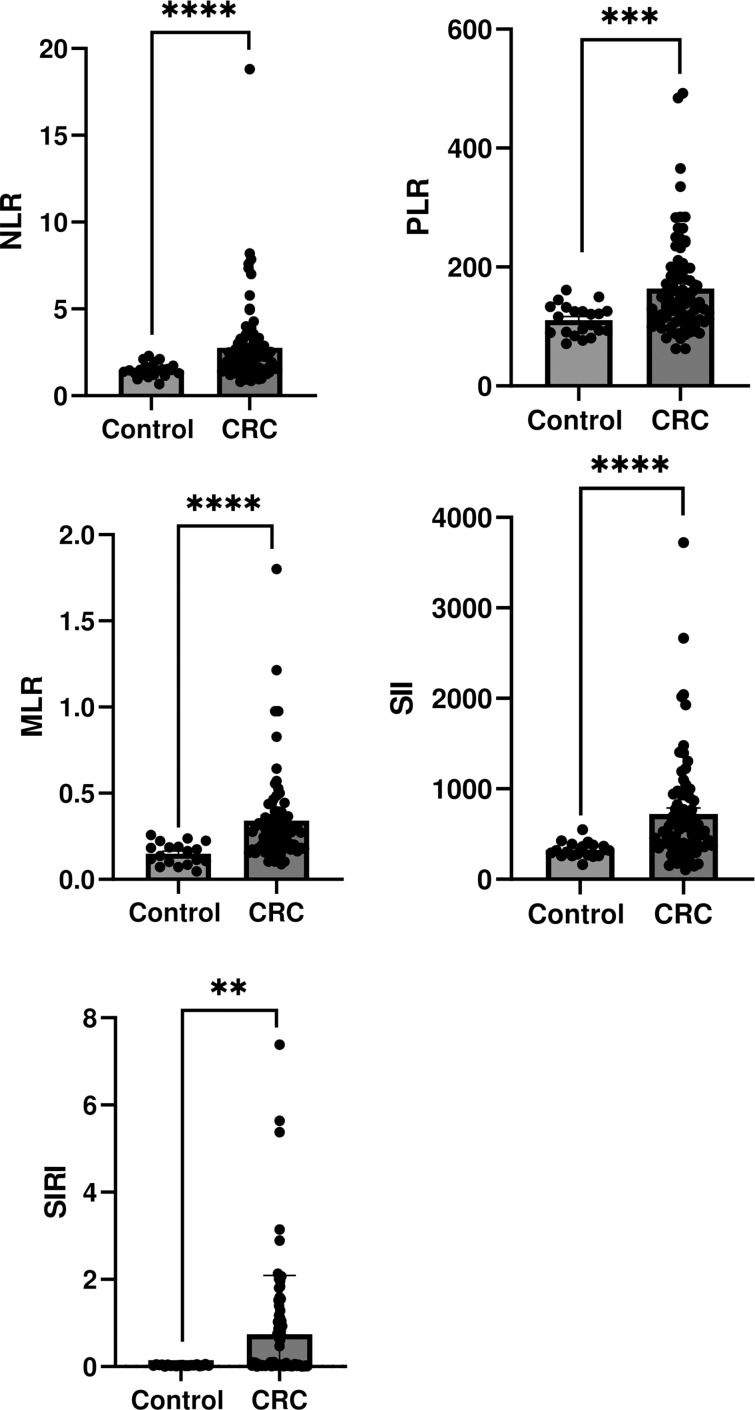 Figure 6
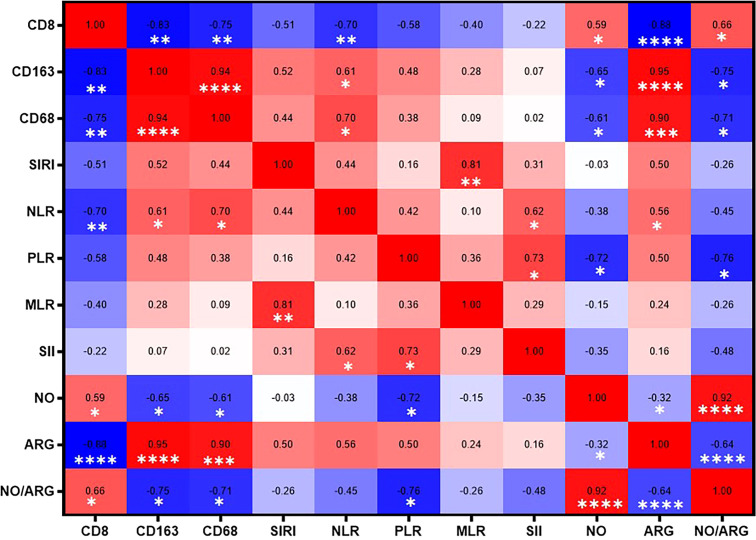 Figure 7
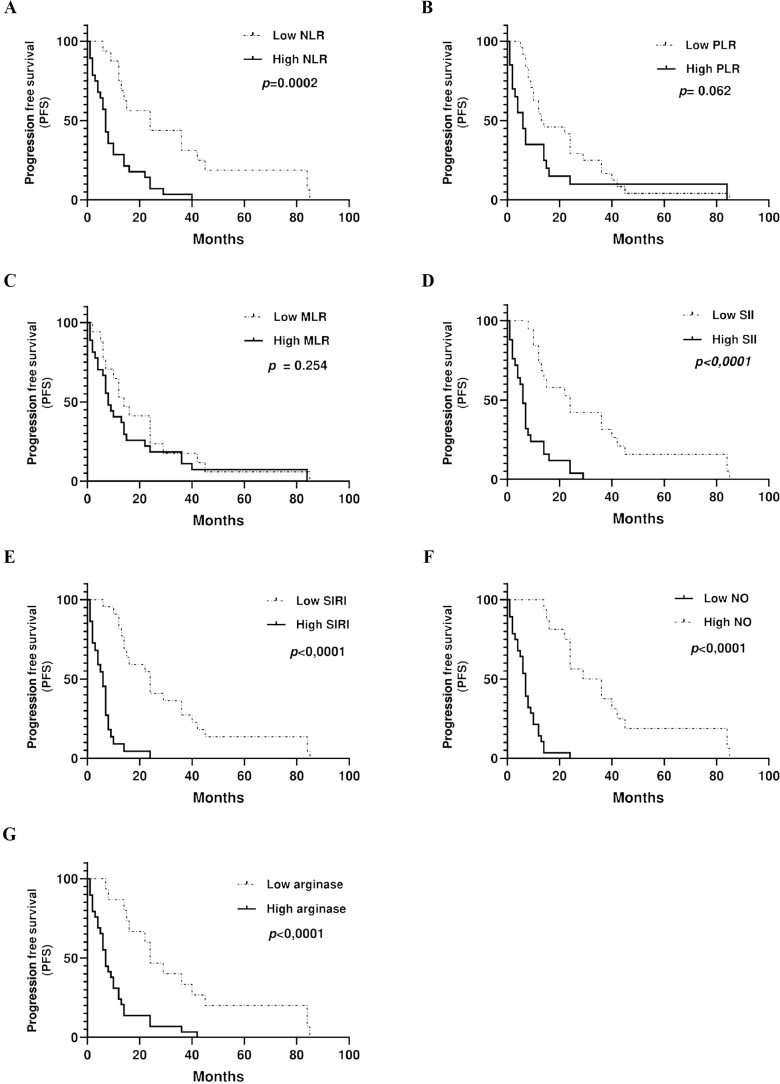 Figure 8
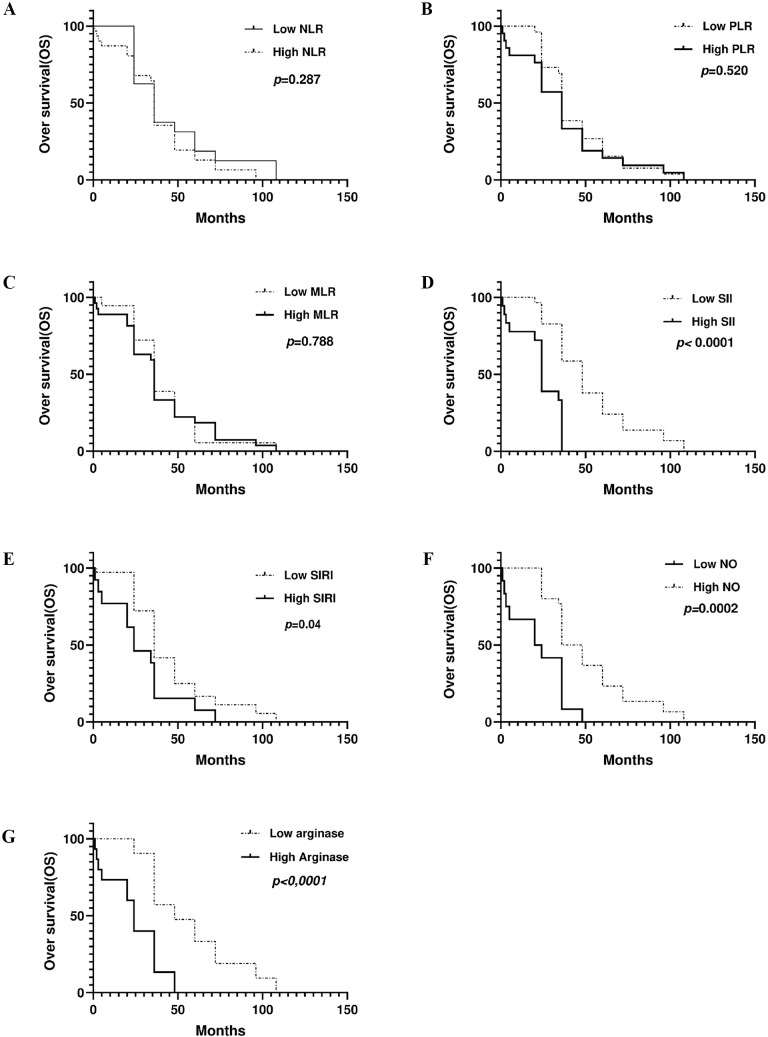 Figure 9
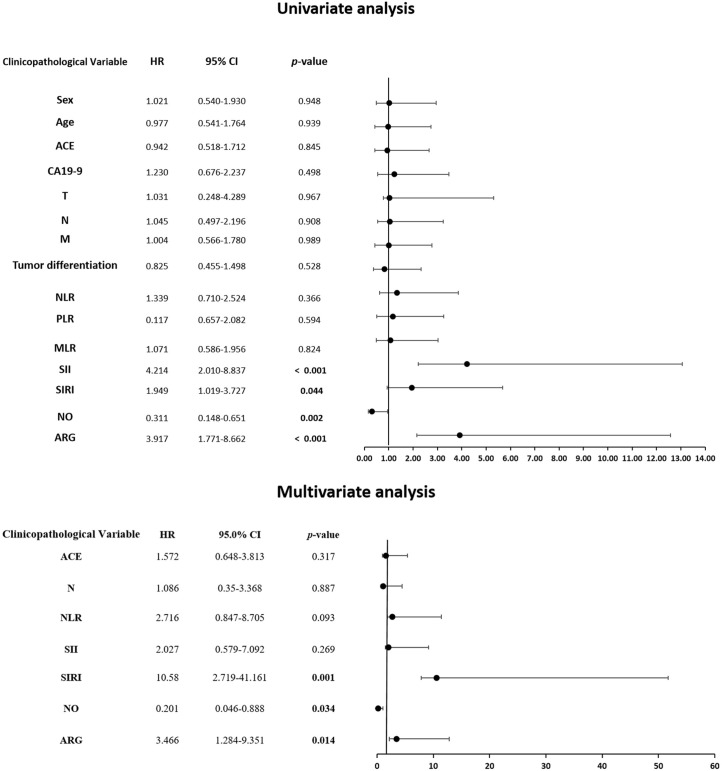 Figure 10
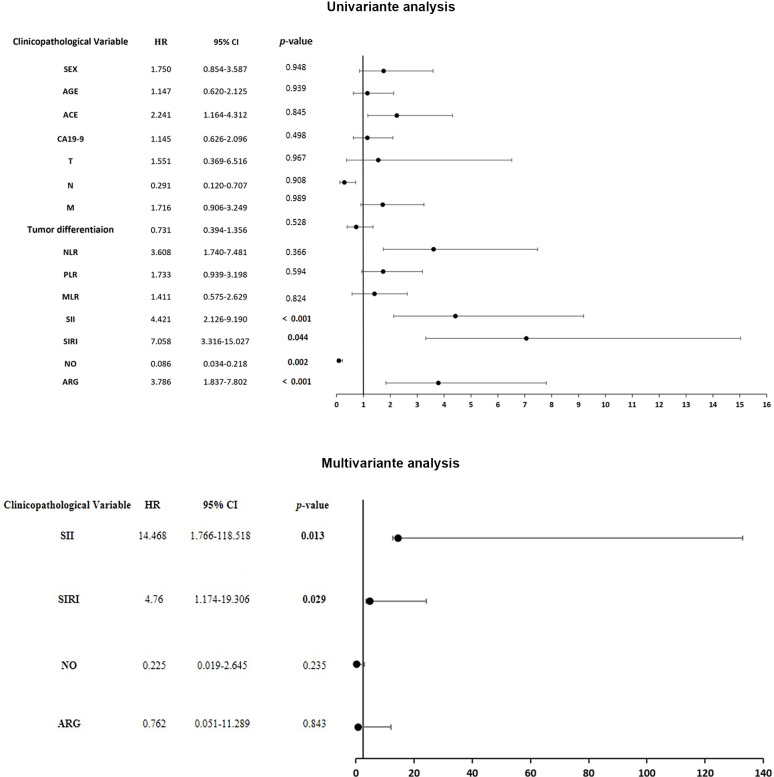 Figure 11
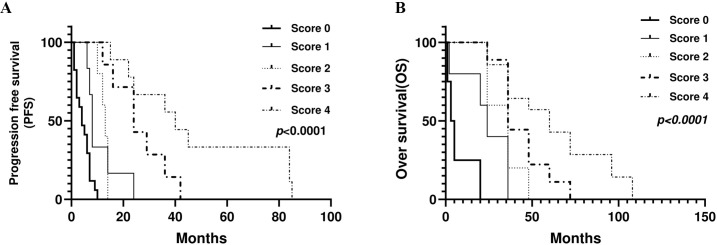 Figure 12
| Clinicopathologic characteristics | Patients CRC |
|---|---|
| Total cases | N=100 |
| Mean Age (range) | 65 (48-85) years |
| Sex(%) | |
| Male | 51 |
| Female | 49 |
| Primary tumor localization (%) | |
| Left colon | 47 |
| Right colon | 23 |
| Transverse colon | 10 |
| Rectum | 20 |
| Tumor size (%) | |
| <5 cm | 36 |
| ≥5 cm | 64 |
| Tumor differentiation | |
| Poor | 31 |
| Well | 69 |
| TNM stage (%) | |
| I, II | 10 |
| III, IV | 90 |
| Nodules | |
| N0 | 39 |
| N+ | 61 |
| Metastases (%) | |
| M0 | 40 |
| M+ | 60 |
| Localization metastases (%) | |
| Liver | 27 |
| Lung | 23 |
| Other | 10 |
| MSI | |
| Stable | 48 |
| Instable | 52 |
| Tumor markers (CEA) | |
| Negative | 45 |
| Positive | 55 |
| Therapy(%) | |
| Untreated | 10 |
| Treated: capecitabine + oxaliplatin | 30 |
| Treated: capecitabine + oxaliplatin + Cetuximab | 60 |
| Biomarker | Responder PR+SD | Non responder PD | |
|---|---|---|---|
| NLR | 1.455±0.219 | 3.404±0.462 |
|
| PLR | 168.8±11.03 | 192.3±16.52 | 0.22 |
| MLR | 0.342±0.05 | 0.419±0.06 | 0.50 |
| SII | 288.9±30.25 | 1105±142.9 |
|
| SIRI | 0.024±0.002 | 0.034±0.003 |
|
| NO | 62.83±4.65 | 42.62±6.60 |
|
| Arginase | 434.6±20.08 | 537.8±32.80 |
|
| Biomarker | AUC | Cut-off value | Sensitivity | Specificity | Youden index |
|---|---|---|---|---|---|
| NLR | 0.87 | 2.1 | 59.51% | 94.12% | 0.5363 |
| PLR | 0.77 | 150.9 | 44.86% | 94.44% | 0.393 |
| MLR | 0.86 | 0.23 | 63.51% | 95.24% | 0.5875 |
| SII | 0.82 | 425.3 | 67.57% | 100% | 0.6757 |
| SIRI | 0.71 | 0.044 | 50.59% | 94.44% | 0.4503 |
| NO | 0.98 | 30 | 87% | 100% | 0.87 |
| Arginase | 0.86 | 461 | 59.14% | 92.31% | 0.5145 |
Peer Reviews
No public reviews on file for this paper yet. If you reviewed it on a platform where reviews are public (OpenReview, ICLR, NeurIPS, ICML), you can paste yours below so the community can read it here.
Videos
No videos yet. Explain this paper in a talk, walkthrough, or lecture? Add one.
Taxonomy
TopicsImmune cells in cancer · Ferroptosis and cancer prognosis · Inflammatory Biomarkers in Disease Prognosis
Introduction
Colorectal cancer is one of the most lethal cancers worldwide (1). According to GLOBOCAN 2022, CRC is the third most commonly diagnosed malignancy and the second leading cause of cancer-related mortality globally, accounting for more than 1.9 million new cases and approximately 904,019 deaths per year. Although advances have been made in the management and treatment of primary CRC, the prognosis of patients with metastatic CRC (mCRC) remains poor, with a 5-year survival rate of 14% (2, 3). Precision medicine has transformed CRC treatment by enabling a personalized approach based on the genetic profile of each patient. Genomic profiling has identified key mutations, such as those in KRAS, BRAF, and PIK3CA, which are involved in signaling pathways that regulate cell proliferation and survival. This information guides the selection of targeted therapies, improving treatment effectiveness while minimizing the side effects (4).
Anti-EGFR therapies have improved outcomes in patients with mCRC, however, resistance to these agents remains a significant challenge (5, 6). Tumor recurrence and therapeutic resistance are increasingly recognized as major determinants of poor prognosis, emphasizing the urgent need for more robust clinical tools to refine patient stratification (7). In this context, the identification of reliable biomarkers capable of predicting treatment response and survival would represent a substantial advancement toward personalized therapeutic strategies in mCRC research and care (8, 9).
It is now widely recognized that KRAS mutations are negative predictors of response to anti-EGFR therapy. However, studies have shown that patients with RAS wild-type manifest acquired resistance to treatment, indicating the involvement of alternative mechanisms in anti-EGFR resistance (10–13). There is increasing evidence that immune and inflammatory contexts, both systemic and within the tumor microenvironment (TME), play a central role in therapeutic responses and patient prognosis (1, 14).
Among the emerging factors contributing to this complex resistance landscape, the balance between NOS2 and ARG1 within the TME represents a key mechanism linking immune modulation and treatment resistance (15, 16). Within the TME, tumor-infiltrating lymphocytes (TILs) and tumor-associated macrophages (TAMs) are the two main components that have shown prognostic value (17, 18). Tumor-infiltrating CD8+ cytotoxic T lymphocytes have been consistently associated with improved prognosis and therapeutic response (19, 20). However, TAMs exhibit remarkably controversial effects due to their plasticity. M1-polarized macrophages, characterized by NOS2 expression, promote tumor suppression through pro-inflammatory activity, whereas M2-like macrophages, which often express ARG1, contribute to immune suppression, matrix remodeling, and therapeutic resistance (21, 22). The interplay between ARG1 and NOS2, enzymes that metabolize the common substrate L-arginine, is a central immunometabolic axis that regulates T cell function and macrophage polarization. ARG1 activity can suppress CD8^+^ T cell function by depleting arginine, whereas NOS2 promotes the activation of CD8^+^ T cells by enhancing their antitumor cytotoxic functions through upregulation of death receptor expression (23–25).
Additionally, at the systemic level, immune cell ratios, including the neutrophil-to-lymphocyte ratio (NLR), platelet-to-lymphocyte ratio (PLR), monocyte-to-lymphocyte ratio (MLR), systemic immune-inflammation index (SII), and systemic inflammation response index (SIRI), have emerged as accessible biomarkers with prognostic and predictive significance in CRC (26, 27). However, their predictive power alone remains limited, and their clinical utility is debatable. The integration of these systemic markers with intratumoral immune features could provide a more comprehensive and clinically actionable biomarker profile.
In this context, and consistent with our previous work demonstrating the implication of the iNOS/NO system in colitis-associated cancer and colorectal cancer, particularly in immune escape, tissue damage, and therapeutic response (28, 29), we sought to further investigate the NOS2/ARG1 axis by stratifying CRC patients according to high or low expression levels. This study aimed to evaluate the association between NOS2/ARG1 expression and systemic immune cell ratios with local tumor immune infiltrates (TILs, TAMs) and to assess their prognostic significance for response to cetuximab-based chemotherapy and patient survival. Importantly, this study offers a novel approach through the development of a simple and noninvasive combined score integrating NO, arginase, SII, and SIRI. This novel score aims to enhance patient stratification by identifying individuals who are more likely to benefit from treatment and experience favorable survival outcomes.
Patients and methods
Patients
In our study, 100 Algerian patients with histopathologically confirmed colorectal adenocarcinoma were enrolled and followed up prospectively and retrospectively between 2014 and 2025 at the Oncology Department of the Rouiba Hospital. The inclusion and exclusion criteria are shown in Supplementary Material 2. Additionally, 50 healthy participants were included as the control group. The control subjects were required to have no acute or chronic inflammatory disease, hematologic disorder, conditions capable of altering circulating cell counts, or history of cancer. They also had to refrain from recent use of medications or substances known to modify inflammatory parameters, including antibiotics, anti-inflammatory drugs, corticosteroids, immunosuppressants. Clinical responses were assessed after eight cycles. Only the 60 metastatic patients who received CAPOX + Cetuximab were included in the treatment response analysis, as this subgroup corresponded to the population eligible for anti-EGFR therapy and for whom predictive biomarkers were assessed. Tumor response was assessed using the Response Evaluation Criteria in Solid Tumors (RECIST) and categorized as partial response (PR), stable disease (SD), or progressive disease (PD). The characteristics of the study groups are shown in Table 1. This study was conducted in accordance with the Declaration of Helsinki (1964) and approved by the Ethics Committee of the National Agency for Research Development in Health and Life (ATRSSV) 20/PNR 2023/ATRSSV dated January 02, 2023. Written informed consent was obtained from all participants included in the study. The informed consent form temple is included in Supplementary Material 3.
Plasma collection and PBMC isolation
Peripheral blood was collected into EDTA tubes. Plasma was separated by centrifugation at 4100 g for 10 minutes. The samples were then aliquoted and stored at -40°C until further analysis. Additionally, blood samples from healthy donors were also collected for use as controls. For peripheral blood mononuclear cell (PBMC) isolation, whole blood was diluted in a 1:1 ratio with sterile phosphate-buffered saline (PBS, pH 7.4), and processed using the Ficoll density gradient centrifugation method (Ficoll-Histopaque, density = 1.077, Sigma-Aldrich).
Tissue samples
Tissue samples were collected from patients diagnosed with CRC who were admitted to the Oncology Service at Rouiba Public Hospital and Anatomical Pathology Department of Nafissa Hamoud Hospital. Normal colon mucosa was collected from the distal ends of the surgical margin during colectomy procedures.
Nitric oxide measurement
Plasma nitric oxide levels were determined using the modified Griess assay as described by Touil- Boukoffa et al. (30). Briefly, 50 μL of plasma samples were incubated with 25 μL of Griess B (0.5% N-1-naphthylethylenediamine in 20% HCl), 25 μL of Griess A (5% sulfanilamide in 20% HCl), and 400 μL of distilled water. After 20 min incubation at room temperature in the dark, absorbance was measured at 543 nm, and nitrite concentration (μM) was calculated from a NaNO_2_ standard curve (0–128 μM).
Plasma arginase activity
Arginase-1 activity was quantified using a modified protocol from Corraliza et al. (31). Briefly, 30 μL of plasma were incubated with 25 μL of 25 mM Tris–HCl (pH 7.4), 5 μL of 10 mM MnCl_2_, and 25 μL of 0.5 M L-arginine at 37 °C for 1 h. The reaction was terminated by adding 400 μL of an acidic mixture (H2SO4, H3P04, and H2O, 1:3:7 v/v). After the addition of 20 μL of 9% α- isonitrosopropiophenone, followed by heating at 95 °C for 1 h, absorbance was recorded at 540 nm, and ARG1 activity was expressed as μM urea·min^-1^·mg^-1^ protein.
RNA extraction and real‐time quantitative polymerase chain reaction
Total RNA was extracted from the tissues of CRC patients with different stages and healthy mucosa (n= 12 per group) using the QIAGEN RNeasy kit (Qiagen) following the manufacturer’s protocol. RNA quantity and purity were measured using a NanoDrop spectrophotometer (Thermo Scientific, USA) with A260/A280 ratios of 1.8–2.1 and A260/A230 ratios >1.8. RNA integrity was verified by electrophoresis on denaturing agarose gels, showing distinct 28S and 18S rRNA bands with an approximate 2:1 ratio. Complementary DNA (cDNA) was synthesized using a Kit (Bio-Rad). Thus, quantitative polymerase chain reaction QPCR was performed on a MyiQ single-color real-time PCR detection system with SYBR green super mix (Bio-Rad). We normalized the gene expression amount to HPRT and GAPDH housekeeping genes. The expression of relative target genes is represented as fold differences and quantified with the 2−ΔΔCt method. Primer sequences for PCR amplification were summarized as follows: NOS2 Forward 5′-TGACCCTGAGCTCTTCGAAATC-3′, Reverse 5′ AGGGCGTACCACTTTAGCTCC-3′; Arginase 1 Forward 5′-TTGAGAAAGGCTGGTCTGCT-3′, Reverse 5’-CAAAGGGCAGGTCCCCATAA-3’; hGAPDH Forward 5′-GCCAAGGTCATCCATGACAACTTTGG-3′, Reverse 5′GCCTGCTTCACCACCTTCTTGATGTC-3′; hHRPT Forward 5′-CCCTGGCGTCGTGATTAG- 3′, Reverse 5′- ATGGCCTCCCATCTCCTT-3′.
Histological analysis
Hematoxylin/eosin-stained samples were prepared from sections of 4 μm formalin-fixed, paraffin- embedded (FFPE) blocks taken from patients with colorectal adenocarcinoma and were classified according to the tumor-node-metastasis (TNM) staging classification. The sections were stained with hematoxylin and eosin (H&E). Histopathological assessment was performed based on epithelial integrity, crypt architecture, and the degree of mixed leukocyte infiltration, defined as the presence of a heterogeneous population of immune cells, including lymphocytes, macrophages, and neutrophils, within the tumor microenvironment. Photomicrographs of normal colon mucosa as well as tissue sections of CRC patients were examined using a light microscope at ×100 and ×400 magnifications (scale bar: 50 μm).
Immunohistochemistry
Immunohistochemical reactions were performed on 4 μm thick slides from FFPE samples. Initially, the tissues were deparaffinized and rehydrated using a graded alcohol series. Endogenous peroxidase activity was blocked with 3% hydrogen peroxide for 10 min and nonspecific binding was blocked by incubation for 2 h in PBS containing 5% skim milk. The monoclonal mouse anti-CD68 (Sigma Aldrich, clone Kp-1, diluted 1:100) and anti-CD163 (Sigma Aldrich, clone MRQ-26, diluted 1:100) antibody (mAb) were subsequently incubated overnight at 4 °C. anti-CD68 and anti- CD163 were detected with biotinylated rabbit anti-mouse immunoglobulin horseradish peroxidase (HRP) conjugated streptavidin (1:500). Immunoreactive complexes were detected using the DAB system (Invitrogen-Life Technologies, USA). Slides were counterstained briefly with hematoxylin (Sigma Aldrich) and mounted in Eukit (Sigma Aldrich). Images were captured using a digital camera at ×100 magnification (scale bar: 500 μm). Negative control procedures included omitting the primary antibody. Positive controls were human spleen and tonsil tissues. Image acquisition, quantitative analysis, and counting of positive cells/mm2 were performed using ImageJ software with standardized settings applied uniformly across all samples. The slides were assessed in a fully blinded manner.
Immunofluorescence staining
Tissue sections, each 4 μm thick, underwent deparaffinization with xylene and were rehydrated through a series of ethanol concentrations after being heated at 60 °C for one hour. The slides were rinsed three times with 0.1% PBS-Tween, permeabilized with 0.1% Triton-X 100 for 30 min, blocked using 3% Bovine Serum Albumin (BSA) for 2 h, and then incubated overnight at 4 °C with primary rabbit IgG antibodies against NOS2 (Invitrogen, PA3-030A, 1:250 dilution), ARG1(Invitrogen, PA5-29645, 1/500 dilution), and CD8 (Invitrogen, PA5-88265, 1/100 dilution). Goat anti-rabbit antibody conjugated with fluorescein isothiocyanate (FITC) (1:1000; Life Technologies, Carlsbad, CA, USA) was used as a secondary antibody. Finally, the slides were mounted using glycerol, and observations were performed using fluorescence microscopy at a magnification of ×200. A negative control, in which the primary antibody was omitted, was systematically included. Image acquisition and quantitative analysis and number of positive cells/mm2 were performed using ImageJ software, with standardized settings applied uniformly across all samples. Slides were assessed in a fully blinded manner.
Data collection
Clinicopathologic characteristics and baseline counts of neutrophils, monocytes, lymphocytes, and platelets were collected from routine pre-treatment blood tests, based on patients’ medical records. Immune cell ratios and inflammatory indexes were calculated using the following formulas:
NLR= Neutrophil count/absolute lymphocyte count.PLR= Absolute platelet count/absolute lymphocyte count.MLR= Absolute monocyte count/absolute lymphocyte count.SII= Platelet count × neutrophil count/lymphocyte count.SIRI= Neutrophil count × monocyte count/lymphocyte count.
Follow-up patients
Progression-free survival (PFS) was measured as the time between treatment initiation and disease progression or recurrence. Overall survival (OS) was defined as the time between treatment initiation and death from any cause or the date of last follow-up.
Statistical analysis
Our data were expressed as the mean ± standard error of the mean (SEM) and analyzed statistically using Student’s t-test or one-way analysis of variance (ANOVA) test, which is appropriate for multiple comparisons. Multiple statistical comparisons were adjusted using sidak correction to control the family wise error rate. The results were considered significant when the p-value was less than 0.05. The normality and homogeneity of the distributions were evaluated using the Shapiro-Wilk and Fisher tests, respectively. The sample size required for the study was estimated to ensure 80% statistical power with a two-sided significance level of α = 0.05. Power calculations were performed using MedCalc Statistical Software (version 15.8, MedCalc Software, Ostend, Belgium) and G*Power software (version 3.1). The estimation was based on the expected effect size and event rate associated with the primary endpoint. The optimal cutoff values for the biomarkers were determined using receiver operating characteristic (ROC) curve analysis, with treatment response (responders vs. non-responders) as the binary outcome. The threshold corresponding to the highest Youden’s index (J = sensitivity + specificity -1) was selected. ROC curves, area under the curve (AUC), sensitivity, specificity, and Youden index were calculated. Patients were subsequently classified into “high” and “low” biomarker groups according to the derived cutoff value for all subsequent analyses. The Kaplan–Meier method was applied to progression free survival and overall survival, while survival differences between groups, defined by the established cutoff points, were compared using the log-rank test. Univariate analyses were conducted using the Cox proportional hazards model, and hazard ratios (HRs) and 95% confidence intervals (CIs) were calculated for each factor. Backward selection was then used to retain only the significant variables in the multivariate model. Multicollinearity for multivariate models was assessed using variance inflation factors (FIVs) and tolerance, a VIF < 5 and tolerance > 0.2 were considered indicative of acceptable collinearity. Statistical analyses were performed using GraphPad Prism 9 and SPSS (version 27).
Results
NOS2/ARG1 Axis correlates with tumor progression in sporadic colorectal cancer
Previous studies have highlighted the dysregulation of the L-Arginine nitric oxide pathway as a critical feature in colorectal cancer, promoting tumor progression, immune suppression, metastasis, and resistance to therapy (32, 33). This metabolic axis plays a central role in shaping the TME by modulating immune cell function and inflammatory responses (32, 33). Thus, considering our previous study reporting the impact of the iNOS/NO system on CRC immune escape, tissue damage, and response to therapy (29), we sought to assess the NOS2/ARG1 Axis in different stages of CRC.
First, our study demonstrated that NOS2/NO expression at the mRNA (Figure 1A), protein (Figure 1B), and plasma levels (Figure 1C) was significantly higher in patients with colorectal cancer than in controls (p < 0.0001). Notably, the tissue expression of NOS2 was significantly higher in patients with late-stage disease (stages III–IV) than in those with early-stage disease (stages I–II) (P < 0.001).
*Analysis of NOS2/NO expression in control and patients with colorectal cancer. (A) NOS2 mRNA expression, (B) Representative images displaying low or high NOS2 and normal mucosa, along with quantification of NOS2 expression levels, (C) Plasma nitric oxide levels. NOS2 expression was quantified using the Fiji software. Data are presented as mean ± SEM. ***p < 0.001, ***p < 0.0001. (GR ×200 magnification; scale bar: 200 μm).
Second, our results also demonstrated that arginase expression at the mRNA level (Figure 2A), protein level (Figure 2B), and in plasma (Figure 2C) was significantly higher in patients with colorectal cancer than in controls (p < 0.0001). In addition, tissue arginase levels were significantly higher in late-stage cancers (stages III–IV) than in early-stage tumors (stages I–II) (p < 0.01). Furthermore, arginase levels were substantially elevated in cancer patients compared with those in healthy controls (CRC I, II p < 0.001 and CRC III, IV p < 0.0001). Our findings highlight the potential role of NOS2/ARG1 balance dysregulation in CRC progression.
*Analysis of arginase expression in control and colorectal cancer patients. (A) Arginase mRNA expression, (B) Representative images displaying low or high ARG in tumor mucosa and normal mucosa, along with quantification of protein expression levels, (C) Plasma arginase levels. Arginase expression was quantified using Fiji software. Data are presented as mean ± SEM. **p < 0.01, ***p < 0.001, ***p < 0.0001. (GR ×200 magnification; scale bar: 200 μm).
Tissue damages and leukocyte infiltration in CRC tissue: Relationship with NOS2/ARG1 expression
Considering the dysregulation of the NOS2/ARG1 balance assessed in vivo and in situ, we investigated the relationship between NOS2 and ARG1 expression, tissue damage, and leukocyte infiltration during CRC.
Hematoxylin and eosin staining revealed that the healthy colon mucosa exhibited an intact structure without any histological alterations (Figure 3A). However, histological analysis of CRC tissues revealed severe tissue damage with significant crypt destruction and orientation, which notably increased with tumor progression (Figure 3A). Mixed leukocyte infiltration within tumor tissues was significantly higher in patients with early-stage CRC than in those with late-stage disease and in the control group (p < 0.05 and p < 0.0001, respectively) (Figure 3B). Additionally, patients with late- stage CRC exhibited significantly greater leukocyte infiltration compared to controls (p < 0.05) (Figure 3B). Interestingly, areas with high NOS2 expression were associated with significantly increased leukocyte infiltration in both early- and late-stage CRC (p < 0.001 and p < 0.05, respectively) (Figure 3C). Conversely, regions with high arginase expression showed significantly lower leukocyte infiltration in both early- and late-stage CRC (p < 0.01 and p < 0.05, respectively) (Figure 3C). These findings highlight the involvement of the NOS2/ARG system in tissue alterations and leukocyte infiltration during CRC progression.
*Histological analysis of normal mucosa and CRC was performed using hematoxylin and eosin staining. (A) Representative images of normal mucosa, early-stage CRC (CRC I and II), and late-stage CRC (CRC III and IV) at original magnification of ×100 and ×400, respectively. Scale bar: 50 μm. (B) Number of mixed leukocytes. (C) Number of leukocytes mixed in areas with high or low NOS2 and ARG expression. Data are presented as mean ± SEM. (*p < 0.05, p < 0.01, *p < 0.001, ***p < 0.0001).
Immune cells infiltration in CRC tissue: Relationship with NOS2/ARG1 expression
Given the strong association between the NOS2/ARG axis and leukocyte infiltration, we hypothesized that the NOS2/ARG axis may contribute to tumor progression by influencing the composition and polarization of infiltrating immune cells. To explore this hypothesis, we examined the expression of CD68 and CD163, which are commonly associated with the immunosuppressive and pro-tumoral M2 macrophage phenotype (21, 22), as well as CD8, a marker of cytotoxic anti-tumoral T lymphocytes (19, 20).
Interestingly, our results showed that the levels of CD68^+^ and CD163^+^ TAMs infiltrating the TME were significantly higher in patients with late-stage (III, IV) than in those with early-stage (I, II) disease (p < 0.0001, p < 0.05). Similarly, a significant difference was observed between the expression of CD68^+^ and CD163^+^ cells in patients and normal mucosa (CD68^+^: CRC I, II p < 0.001; CRC III, IV p < 0.0001, respectively), (CD163^+^: CRC I, II p < 0.01; CRC III, IV p < 0.001, respectively) (Figures 4B, C). Our analysis demonstrated that areas with high NOS2 expression were associated with significantly lower infiltration of both CD68^+^ and CD163^+^macrophages then areas with low NOS2 expression. CD68^+^ cell numbers were reduced in both early- stage (CRC I, II; p < 0.05) and late-stage (CRC III, IV; p < 0.0001) tumors, whereas CD163^+^ cell counts were similarly decreased in early- and late-stage CRC (p < 0.05 and p < 0.01, respectively) (Figure 4D). In contrast, areas with high arginase expression showed significantly increased infiltration of CD68^+^ macrophages in late-stage CRC (p < 0.01) but not in early-stage tumors (Figure 4E). Likewise, CD163^+^ macrophage infiltration was markedly higher in regions with elevated arginase expression in both early- (p < 0.05) and late-stage CRC (p < 0.0001) (Figure 4E).
*Analysis of the number of CD68+ and CD163+ cells in normal mucosa and colorectal cancer. (A) Representative images displaying low or high expression of CD68+ and CD163+ cells in tumor mucosa and normal mucosa. (B) Number of CD68+ cells at different stages. (C) Number of CD163+ cells at different stages. (D) Number of CD68+ and CD163+ cells in areas with high or low NOS2 (E) Number of CD68+ and CD163+ cells in areas with high or low ARG1 expression. The number of CD68+ and CD163+ TAMs infiltrating the TME was quantified using Fiji software. Data are presented as mean ± SEM (*p < 0.05, p < 0.01, *p < 0.001, ***p < 0.0001). Original magnification: ×100; scale bar: 500 μm.
However, the number of CD8^+^ T cells infiltrating the tumor was significantly higher in patients with early-stage colorectal cancer (Stage I–II) than in those with late-stage cancer (Stage III–IV) (p < 0.0001). Additionally, the difference in CD8^+^ T cell infiltration between patients and normal mucosa was significant (CRC I, II p < 0.0001; CRC III, IV p < 0.05) (Figure 5B). Notably, regions exhibiting elevated NOS2 expression were correlated with higher CD8^+^ T cell infiltration in both early- and late- stage CRC (p < 0.0001 and p < 0.05, respectively). In contrast, areas with higher arginase expression demonstrated significantly reduced CD8^+^ T cell infiltration at both stages (p < 0.001 and p < 0.05, respectively) (Figure 5C). These results suggest that the NOS2/ARG axis may critically influence tumor progression by modulating immune cell polarization and infiltration, thereby supporting the accumulation of immunosuppressive cell populations within the TME during progression.
*Number of CD8-positive cells per mm² in normal mucosa and colorectal cancer. (A) Representative images displaying low or high expression of CD8 T cell infiltrate. (B) Number of CD8 cell infiltration in different stages (C) Number of CD8 cell infiltration in areas with high or low expression of NOS2 and ARG. Quantification of CD8+ expression in the tumor microenvironment was analyzed using Fiji software. The results are presented as the mean ± SEM. Statistical significance: *p < 0.05, ***p < 0.001, ***p < 0.0001, one-way ANOVA. Scale bar: 200 μm; original magnification ×200.
Relationship between NOS2/ARG1 axis and peripheral and local immune cells in CRC
To further explore the immune dynamics associated with the NOS2/ARG axis and tumor progression, we examined the ratios of circulating immune cells. These systemic immune markers may serve as peripheral blood-based surrogates for tumor-infiltrating immune cells (34), offering a less invasive and more accessible means of assessment than tissue-based methods. In particular, we focused on NLR, PLR, MLR, SII, and SIRI, which have been widely recognized as indicators of systemic inflammation and immune status in patients with cancer. Our analysis indicated a significant increase in NLR, MLR, SII (p < 0.0001), PLR (p < 0.001), and SIRI (p < 0.01) in patients with CRC compared to the controls (Figure 6).
*Immune cell ratios and inflammatory index levels in the control and colorectal cancer groups. (A) NLR, (B) PLR, (C) MLR, (D) SII, and (E) SIRI. Values are presented as mean ± SEM. **p < 0.01, ***p < 0.001, ***p < 0.0001.
Next, we investigated the association between systemic immune cell ratios and tumor-infiltrating immune cells in CRC, aiming to evaluate whether circulating markers reflect local immune dynamics within the tumor microenvironment. Correlation analysis revealed several significant relationships between systemic inflammatory markers and immune cell infiltration in patients with colorectal cancer. Notably, CD8^+^ T cells were significantly negatively correlated with CD163^+^ (r = −0.83, p = 0.005), CD68^+^ (r = −0.75, p = 0.015), NLR (r = −0.70, p = 0.005), and ARG (r = −0.88, p < 0.0001), while showing a moderate significant positive correlation with NO (r = 0.70, p = 0.022) and NO/ARG ratio (r = 0.70, p = 0.007). In addition, CD163^+^ infiltration was significantly positively correlated with CD68^+^ (r = 0.94, p < 0.0001) and NLR (r = 0.61, p = 0.046) and negatively correlated with NO (r = −0.65, p = 0.047) and NO/ARG ratio (r = −0.75, p = 0.017). CD68^+^ also showed a strong significant positive correlation with ARG (r = 0.90, p < 0.001) and NLR (r = 0.70, p = 0.029), and a significant positive negative correlation with NO (r = −0.61, p = 0.053) and NO/ARG ratio (r = −0.71, p = 0.025). Furthermore, strong significant correlations were observed among the systemic inflammatory indices: NLR correlated positively with SII (r = 0.61, p = 0.048) and ARG (r = 0.56, p = 0.048), and PLR correlated positively with SII (r = 0.73, p = 0.014). NO correlated negatively with ARG (r = −0.32, p = 0.030), and SIRI showed a strong positive correlation with MLR (r = 0.81, p = 0.004) (Figure 7). These findings suggest that the balance of the NOS2/ARG axis not only shapes the local immune cell composition but also affects peripheral immune parameters. Consequently, systemic inflammatory indices may serve as valuable non-invasive proxies for immune profiling in colorectal cancer, with potential implications for prognosis and treatment stratification.
*Correlation heatmap of systemic immune cell ratios, tumor cell infiltrates, and NO/ARG ratios in patients with colorectal cancer. The correlation coefficient (r) is also shown. Significant positive correlations are indicated in red, significant negative correlations in blue, and non-significant correlations are uncolored. *p < 0.05, **p < 0.01, ***p < 0.001, ***p < 0.0001.
NOS2/ARG1 axis and peripheral immune cells as biomarkers of treatment response in metastatic colorectal cancer
Given the observed associations between the NOS2/ARG1 axis, immune cell infiltration, and systemic inflammatory markers, we next sought to evaluate the potential prognostic significance of these variables. Understanding how these immune-related parameters correlate with clinical outcomes may provide valuable insights that aid patient risk stratification and guide therapeutic decision-making. Therefore, we analyzed the relationship between these factors and treatment response.
Our findings revealed that the non-responder group exhibited significantly elevated baseline NLR, SII, SIRI, and arginase levels compared to the responder group (p = 0.009, p < 0.0001, p = 0.03, p = 0.01, respectively). Higher NO levels were observed in the responder groups than in the non- responder groups (p = 0.008) (Table 2). To further explore the prognostic relevance of these biomarkers, we constructed survival curves for each biomarker by establishing cutoff values used to stratify patients into low and high groups (Table 3).
NOS2/ARG1 expression and peripheral immune cells as prognostic and predictive markers of progression free survival and over survival in metastatic colorectal cancer
Considering the interplay between systemic immune cell ratios and the tumor microenvironment, particularly their association with the NOS2/ARG1 axis and tumor-infiltrating lymphocytes, we next explored the clinical relevance of these markers. Our survival analysis revealed significant associations between inflammatory biomarkers and clinical outcomes. Patients with elevated NLR, SII, SIRI, and arginase levels exhibited significantly diminished progression-free survival (PFS) (p = 0.0002, p < 0.0001, p < 0.0001, and p < 0.0001, respectively) compared to those with low levels. In contrast, elevated NO levels were significantly associated with longer PFS (p < 0.0001) (Figure 8). Similarly, higher levels of SII, SIRI, and arginase were associated with markedly reduced overall survival (p < 0.0001, p = 0.01, p < 0.0001, respectively) compared with lower levels. Conversely, elevated NO levels were significantly associated with improved OS (p = 0.0002), highlighting their potential prognostic value (Figure 9).
Kaplan-Meier curve of association between inflammation markers. (A) NLR, (B) PLR, (C) MLR, (D) SII, (E) SIRI, (F) NO, (G) arginase, and progression free survival.
Kaplan-Meier curve of association between inflammation markers (A) NLR, (B) PLR, (C) MLR, (D) SII, (E) SIRI, (F) NO, (G) arginase, and survival.
Furthermore, we sought to determine whether these inflammatory parameters could serve as independent prognostic factors. A univariate analysis revealed that elevated levels of SII (HR = 4.421, 95% CI: 2.126–9.190, p = 0.001), SIRI (HR = 7.058, 95% CI: 3.316–15.027, p < 0.001), ARG (HR = 3.786, 95% CI: 1.837–7.802, p < 0.001), ACE (HR = 2.241, 95% CI: 1.164–4.312, p = 0.016) and Node (HR = 0.291, 95% CI: 0.120 – 0.707, p = 0.006) had a statistically significant effect on PFS in CRC. Higher NO levels (HR = 0.086, 95% CI: 0.034–0.218, p = 0.0001) were associated with better survival rates. After adjusting for univariate indices, multivariate analysis was performed, and the results revealed that SIRI (HR = 10.58, 95% CI: 2.719–41.61, p = 0.001), arginase (HR = 10.58, 95% CI: 2.719–41.61, p = 0.014), and NO (HR = 3.466, 95% CI: 1.284–9.351, p = 0.034) remained independent prognostic factors for CRC (Figure 10).
Forest plot of univariate and multivariate Cox regression analyses of PFS.
Additionally, univariate analysis revealed that OS was significantly associated with several factors. Elevated SII (HR = 4.21, 95% CI: 2.01–8.84, p < 0.001), SIRI (HR = 1.95, 95% CI: 1.02–3.73, p = 0.044), and ARG (HR = 3.92, 95% CI: 1.77–8.66, p < 0.001) levels were linked to worse outcomes, whereas higher NO levels (HR = 0.31, 95% CI: 0.15–0.65, p = 0.002) were associated with better survival. In the multivariable model, after adjusting for potential confounders, both SII (HR = 14.47, 95% CI: 1.77–118.52, p = 0.013) and SIRI (HR = 4.76, 95% CI: 1.17–19.31, p = 0.029) remained significant independent prognostic markers. Other variables, including ARG and NO, were not significant in the adjusted model (Figure 11).
Forest plot of univariate and multivariate Cox regression analyses of OS.
Combined inflammatory indices score as predictors of outcome in metastatic colorectal cancer
Based on previous results, NO/ARG/SIRI and SII/SIRI were independently linked with PFS and OS, respectively. To enhance the prognostic value of systemic inflammatory markers in colorectal cancer, we developed a combined score integrating four widely studied indices: SII, SIRI, NO, and ARG. Each patient was assigned a score ranging from 0 to 4 based on the number of adverse markers: SII ≥ 425.3, SIRI ≥ 0.044, NO < 30, and ARG > 461. A score of 0 indicated that all markers were within the low-risk range (low SII, SIRI, and ARG and high NO levels), whereas a score of 4 indicated that all markers were within the high-risk range (high SII, SIRI, and ARG and low NO levels). Scores of 1, 2, and 3 reflected intermediate combinations of the elevated markers. Our analysis revealed that higher inflammatory scores were significantly associated with poorer progression-free survival and overall survival (p < 0.0001), suggesting that the combined score may serve as a more robust prognostic indicator than any single marker (Figure 12).
Combined inflammatory indices score as a prognostic biomarker for CRC. (A) PFS (B) OS.
Discussion
Colorectal cancer is a complex disease with multiple factors contributing to its pathogenesis (35). Previous studies have reported the relationship between NOS2/ARG1 as a key regulator of the TME, influencing immune cell infiltration and treatment response (32, 33, 36). NOS2 and ARG1 compete for the common substrate L- arginine but drive divergent immunological pathways: NOS2 promotes pro-inflammatory and cytotoxic responses which are associated with better therapeutic outcomes and improved prognosis (16, 37–39), whereas elevated arginase activity depletes L-arginine, suppresses T cell proliferation, and promotes the recruitment of immunosuppressive TAMs, which are correlated with poor prognosis (15, 40–42). In our study, we showed a significant upregulation of NOS2/NO and arginase levels in tissue and plasma compared to the control group, and these levels increased with the progression of the disease. These findings support both our earlier observations and those of other researchers showing the significant role of these enzymes in the pathophysiology of CRC and their potential as prognostic markers (28, 29, 40, 43).
Previous studies have established the NOS2/ARG1 axis as a critical modulator of tumor progression and metastasis. Wang et al. (44) reported that activation of ARG1 in the CT26 murine CRC model enhanced metastatic colonization of the liver and lungs and promoted tumor cell migration, whereas pharmacological inhibition of arginase significantly reduced these malignant features. Conversely, NOS2 plays a multifaceted role in CRC. Li et al. (45) demonstrated that elevated NOS2 expression has been shown to reduce tumorigenicity in vivo and inhibit CRC cell proliferation and survival by inducing apoptosis through suppression of the NF-κB signaling pathway. Additionally, Cunha et al. (46) reported that genetic deletion of NOS2 in murine T cells impaired effector differentiation, reduced tumor infiltration, and compromised recall responses and adoptive cell transfer efficacy, highlighting the essential role of endogenous nitric oxide in supporting T cell mediated immune responses within the TME. In contrast, chronic NOS2 expression can promote inflammation-driven carcinogenesis, angiogenesis, and DNA damage via sustained NO production (47).
Notably, NOS2 and ARG1 are expressed not only by tumor cells but also by immune cells that infiltrate the TME (48, 49). ARG1^+^ and NOS2^+^ immune cells were detected in the lamina propria and submucosal regions of the colon, reflecting their contribution to shaping local immune dynamics (50–53). NOS2 is expressed by multiple immune cell subsets, including T cells, macrophages, and mature dendritic cells, and modulates their function through post-translational modifications of key transcriptional and signaling proteins (54, 55). Moreover, MDSCs have been shown to be a major source of ARG1 in the tumor setting, further supporting their immunosuppressive function (56).
Given the observed upregulation of the NOS2/ARG1 axis both in vivo and in situ, we aimed to examine the relationship between NOS2 and ARG1 expression, tissue damage, and the subtypes of infiltrating immune cells during CRC progression. Our results indicate that NOS2 upregulation is associated with tissue damage and an increase in leukocyte infiltration, which occurs in a stage- dependent manner. These findings are consistent with a study conducted by Benkhelifa et al. (29). Conversely, ARG expression is associated with low leukocyte infiltration. This reduction is consistent with the fact that elevated ARG1 activity leads to the loss of T-cell receptor ζ-chain expression and induces cell-cycle arrest, resulting in T-cell exhaustion hallmarks of immune-cold tumors characterized by low tumor infiltrate (25, 57). Notably, inhibition of ARG by OATD-02, a novel arginase inhibitor, reprograms tumor metabolism by restoring L-arginine availability, thereby shifting the tumor microenvironment toward a more immunoactive state (39).
To further refine our investigation, we determined which immune cell types were affected by the NOS2/ARG1 axis. First, we assessed the expression of CD68 and CD163 in both normal and tumor mucosa. Our results showed that CD68^+^ and CD163^+^ TAMs were more abundant in the tumor mucosa than in the normal mucosa, with higher levels in late-stage CRC. This finding is consistent with those of previous studies (18, 42, 58–60). CD68 is commonly used as a pan-macrophage marker, whereas CD163 is more specifically associated with M2 macrophages (61). In colorectal cancer, M2 macrophages promote tumor progression by secreting multiple immunosuppressive factors, including IL-10, TGF-β and arginase, which suppress cytotoxic T cell activity and enhance regulatory T cell expansion (21). They also contribute to extracellular matrix remodeling, angiogenesis, and tumor cell migration through elevated production of VEGF-A, VEGF-C and MMPs (22). Conversely, M1 macrophages exhibit pro-inflammatory and antitumor activities by directly killing tumor cells through the production of reactive oxygen and nitrogen species, as well as TNF-related apoptosis- inducing ligand (TRAIL) (62). Previous studies have reported that NOS2 is upregulated in M1 macrophages and reflects pro-inflammatory activity, whereas ARG1 expression is commonly observed in association with M2-like macrophage phenotypes (42, 63).
Our data indicated that areas with low NOS2 and high arginase expression were correlated with higher CD68^+^ and CD163^+^ macrophage infiltrations. In contrast, areas with high NOS2 and low arginase expression were associated with increased CD8^+^T cell infiltration. Our results are consistent with those reported by (24, 64), suggesting that the M2 macrophage subpopulation predominates in patients with CRC undergoing progression.
The balance between M1/M2 macrophage polarization profoundly influences the infiltration and activity of CD8^+^ T lymphocytes. In our study, we observed a significantly higher infiltration of CD8^+^ T lymphocytes in patients with early-stage CRC than in those with late-stage CRC. Our results are consistent with those of Kasurinen et al. (65), who reported that reduced CD3^+^ and CD8^+^ T-cells correlated with tumor progression and an increased risk of recurrence, highlighting the critical role of the TME in disease progression. Consistent with this, a recent pancancer single-cell RNA sequencing analysis across nine tumor types revealed that distinct TAM subsets occupy functionally different niches within the TME. Pro-inflammatory TAMs were located in regions enriched with exhausted CD8^+^ T cells, whereas pro-tumorigenic TAMs were confined to hypoxic niches characterized by a T cell-excluded phenotype (66).
To further explore the immune dynamics associated with the NOS2/ARG1 axis and tumor behavior we analyzed the proportions of circulating immune cells. These systemic immune cell ratios may act as peripheral blood-based substitutes for TILs (34), providing a less invasive and more readily available method of evaluation than tissue-based approaches. Our study indicated that the immune cell ratios and inflammatory indices, including NLR, PLR, MLR, SII, and SIRI, were higher in patients with CRC than in the control group. These findings are consistent with those of previous studies on solid cancers as well as lung cancer and oral squamous cell carcinoma (67–69).
Additionally, the association between systemic biomarkers and immune cell infiltrates tumors showed that CD8^+^T-cell counts were negatively correlated with the NLR. Neutrophils, which represent the predominant subset of MDSCs, have been linked to poor prognostic outcomes in various malignancies (70). In addition, Ohashi et al. (71) reported that NLR was negatively correlated with T cell infiltration, further supporting the notion that an elevated NLR is a marker of poor prognosis in cancer. Recently, Tan et al. (72) reported that a high NLR was associated with an increase in tumor neutrophils and a decrease in CD8^+^ T-cells in TME on a penile squamous cell carcinoma.
Interestingly, CD8^+^ cell infiltration was positively correlated with plasma nitric oxide, NO/ARG ratio, and negatively correlated with the plasma arginase levels. In contrast, CD68^+^ and CD163^+^ cells were positively associated with arginase and negatively associated with nitric oxide, suggesting immune-metabolic patterns commonly observed in the tumor microenvironment.
Collectively, our findings indicate that late-stage CRC is characterized by both systemic and local immunosuppressive profiles more than early-stage CRC. In this context, we investigated the prognostic and predictive significance of the NOS2/ARG1 axis and immune cell ratios in chemotherapy combined with cetuximab in wt-KRAS metastatic colorectal cancer. Cetuximab-based therapy is widely used for treating mCRC, especially in patients with wt-RAS tumors. However, a significant proportion of patients develop resistance and fail to benefit from treatment. Therefore, it is clinically critical yet challenging to identify reliable biomarkers of resistance to optimize therapeutic strategies for each patient. Our current study demonstrated that responder CRC patients exhibited significantly lower levels of NLR, SII, SIRI, and arginase compared to the non-responder group. However, NO levels were higher in the responder group than in the non-responder group. Several recent studies have assessed the prognostic value of inflammatory indices in patients with CRC. Jiang et al. (73) documented that low pre-treatment NLR, PLR, and SII correlated with enhanced early response to cetuximab therapy. Similarly, Passardi et al. (74) reported that the SII may serve as an effective prognostic marker for patients who are candidates for first-line chemotherapy with bevacizumab in mCRC treatment.
In addition, our survival analysis demonstrated significant associations between inflammatory biomarker levels and clinical outcomes. High baseline SII, SIRI, and arginase levels were associated with poor PFS and OS. A high NLR was significantly associated with poor PFS but not OS rates. Our results are consistent with those of previous studies (59, 75–77), indicating systemic inflammation and altered immune responses, which can negatively impact patient outcomes. Additionally, Ma et al. (40) reported that elevated Arg-1 expression is closely linked to advanced CRC and may serve as a negative prognostic marker for CRC. Similarly, Qiang et al. (78) found that high ARG-1 levels were associated with poor prognosis in patients with intrahepatic cholangiocarcinoma. Consistent with these findings, Tran et al. (79) demonstrated that increased ARG1 expression is linked to poor prognosis in mouse models of endometrial cancer. More recently, Lin et al. (80) reported that ARG1 is upregulated in CRC and associated with reduced overall survival.
However, elevated NO levels were associated with improved prognostic outcomes, including longer PFS and OS. The NO prognostic model demonstrated strong potential as an independent prognostic biomarker for early onset CRC, offering a novel perspective for improving prognostic prediction in this patient population (81). Additionally, Giatromanolaki et al. (37) reported that NOS2-positive TILs may serve as potential markers of an active antineoplastic immune response. Higher NO levels may exert cytotoxic effects and induce apoptosis or programmed cell death in cancer cells and affect the apoptosis process by regulating Bcl-2 family proteins, promoting the expression of pro-apoptotic proteins such as Bax and Bad, and inhibiting the expression of anti-apoptotic proteins Bcl-2 and Bcl-xL (82).
Recently, an innovative therapeutic approach proposed by Wang et al. (83), based on engineered microparticles capable of selectively modulating arginine metabolism and reprogramming TAMs toward a pro-inflammatory phenotype using piceatannol-3′-O-glucoside, which inhibits arginase activity while activating nitric oxide synthase, effectively reduces the number of M2-like macrophages and promotes M1-like polarization. This dual action not only enhances antitumor immunity but also exerts significant inhibitory effects on tumor growth in vivo, highlighting a promising strategy to overcome ARG1-mediated immunosuppression. In particular, the natural compound Wang et al. (83).
Interestingly, in the multivariate analysis, SII and SIRI emerged as independent prognostic factors for PFS, whereas SII, NO, and arginase were independent predictors of OS. To enhance the prognostic value of these markers in CRC, we propose a combined score integrating four widely studied indices: NO, arginase, SII, and SIRI. To our knowledge, this is the first study to examine the value of combining these scores in the evaluation of outcomes in patients with CCR. Our results showed that the OS and PFS of patients with high combined scores were significantly lower than those of patients with low combined scores. This finding suggests that the combined score may be a more robust predictor of prognosis than any other markers. Recent studies have highlighted the predictive value of combinations of different inflammatory markers. A study on patients with hepatocellular carcinoma after liver transplantation indicated that the AUC of NLR-PLR was the largest, followed by NLR and PLR alone, which proved that the combined scoring system was more accurate than the previous single index in the prognosis of hepatocellular carcinoma (84). Similarly, Yang et al. (85) identified the pretreatment NLR-PLR score as an independent risk factor for the prognosis of non-metastatic nasopharyngeal carcinoma, demonstrating that this combined score could better distinguish patients with favorable outcomes after treatment than NLR or PLR alone. Additionally, Abudukelimu et al. (69) reported that the combined use of CA125, NSE, NLR, PLR, and SIRI offers superior diagnostic value compared to any single marker, demonstrating higher sensitivity and specificity.
Conclusion
The current study highlights a strong association between the NOS2/ARG1 axis and both local and systemic immune contexture, as well as clinical outcomes in patients with mCRC treated with cetuximab combined with chemotherapy. Higher NOS2 and lower arginase levels were associated with increased CD8^+^ infiltration, whereas low NOS2 and high arginase levels correlated with elevated densities of CD68^+^ and CD163^+^ cells. Clinically, patients with high NOS2 and low ARG, NLR, SII, and SIRI levels exhibited better outcomes, longer PFS and OS, whereas the opposite profile predicted poor therapeutic response and unfavorable survival outcomes. Furthermore, we propose, for the first time, a novel combined score integrating the NO, arginase, SII and SIRI as a simple, accessible, and non-invasive prognostic and predictive tool. This combined score could stratify patients into distinct prognostic groups, with high scores identifying those more likely to respond to treatment and achieve longer PFS and OS, and low scores indicating poor therapeutic benefit and worse survival outcomes. However, validation of these findings in larger cohorts of mCRC patients is needed to highlight the role of this novel combined score in predicting clinical outcomes in routine clinical practice.
The reference list from the paper itself. Each links out to its DOI / PubMed record.
- 1Siegel RL Giaquinto AN Jemal A . Cancer statistic. CA: A Cancer J Clin. (2024) 74:12–49. doi: 10.3322/caac.21820, PMID: 38230766 · doi ↗ · pubmed ↗
- 2Leowattana W Leowattana P Leowattana T . Systemic treatment for metastatic colorectal cancer. World J Gastroenterol. (2023) 29:1569–88. doi: 10.3748/wjg.v 29.i 10.1569, PMID: 36970592 PMC 10037252 · doi ↗ · pubmed ↗
- 3SEER program NIH National Cancer Institute . SEER cancer statistics review: colorectal cancer—5-year relative survival by stage. Surveillance, Epidemiology, and End Results (SEER) Program, National Institutes of Health. (2024). Available at: https://seer.cancer.gov/statfacts/html/colorect.html.
- 4Kiran NS Yashaswini C Maheshwari R Bhattacharya S Prajapati BG . Advances in precision medicine approaches for colorectal cancer: from molecular profiling to targeted therapies. ACS Pharmacol Trans Sci. (2024) 7:967–90. doi: 10.1021/acsptsci.4c 00008, PMID: 38633600 PMC 11019743 · doi ↗ · pubmed ↗
- 5Doleschal B Petzer A Rumpold H . Current concepts of anti-EGFR targeting in metastatic colorectal cancer. Front Oncol. (2022) 12:1048166. doi: 10.3389/fonc.2022.1048166, PMID: 36465407 PMC 9714621 · doi ↗ · pubmed ↗
- 6Global Burden of Disease 2019 Cancer Collaboration Kocarnik JM Compton K Dean FE Fu W Gaw BL . Cancer incidence, mortality, years of life lost, years lived with disability, and disability-adjusted life years for 29 cancer groups from 2010 to 2019: A systematic analysis for the global burden of disease study 2019. JAMA Oncol. (2022) 8:420. doi: 10.1001/jamaoncol.2021.6987, PMID: 34967848 PMC 8719276 · doi ↗ · pubmed ↗
- 7Cendra AS Pekarek L Ospino LR Dbouk Y Chnaiker S Luengo A . Predictive and prognostic biomarkers of recurrence in locoregional colorectal cancer. J Cancer. (2025) 16:3024–39. doi: 10.7150/jca.111828, PMID: 40740242 PMC 12305430 · doi ↗ · pubmed ↗
- 8Di Nicolantonio F Vitiello PP Marsoni S Siena S Tabernero J Trusolino L . Precision oncology in metastatic colorectal cancer — from biology to medicine. Nat Rev Clin Oncol. (2021) 18:506–25. doi: 10.1038/s 41571-021-00495-z, PMID: 33864051 · doi ↗ · pubmed ↗