Pharmacovigilance insights: safety profiles of antifungal agents for invasive aspergillosis
Wei Jia, Tiezhou Wang, Jingru Wang

TL;DR
This study compares the safety of antifungal drugs for invasive aspergillosis using real-world data, revealing significant differences in toxicity and mortality rates.
Contribution
The study provides novel real-world safety insights for antifungal agents treating invasive aspergillosis using pharmacovigilance data.
Findings
Amphotericin B shows highest mortality and severe renal toxicity, while Isavuconazole has the lowest life-threatening adverse events.
Voriconazole is linked to hepatobiliary and ocular toxicity, and Caspofungin shows significant hepatotoxicity.
Posaconazole and Isavuconazole have lower mortality rates compared to other agents.
Abstract
Invasive aspergillosis (IA) poses significant mortality risks, particularly in immunocompromised patients. The safety profiles of FDA-approved antifungal agents, triazoles (Voriconazole, Posaconazole, Isavuconazole), polyenes (Amphotericin B), and echinocandins (Caspofungin), are not yet fully characterized in real-world settings. This study employed pharmacovigilance data to systematically evaluate the comparative safety profiles of these agents, providing evidence-based insights for clinical practice. A retrospective analysis of the FDA Adverse Event Reporting System (FAERS) data (2004Q1–2024Q3) was conducted. Disproportionality analyses, including reporting odds ratio (ROR), proportional reporting ratio (PRR), Bayesian Confidence Propagation Neural Network (BCPNN), and Multi-item Gamma-Poisson Shrinker (MGPS), were employed to identify adverse event (AE) signals. Duplicate entries…
Genes, proteins, chemicals, diseases, species, mutations and cell lines named across the full text — each resolved to its canonical identifier and authoritative record.
Click any figure to enlarge with its caption.
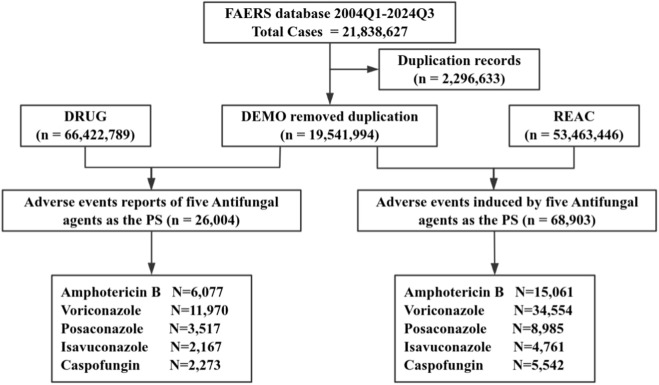 FIGURE 1
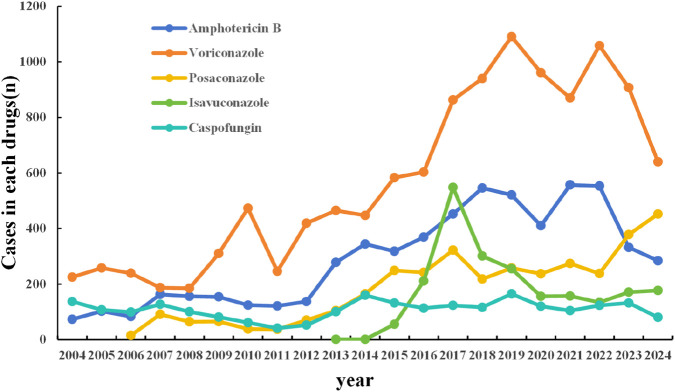 FIGURE 2
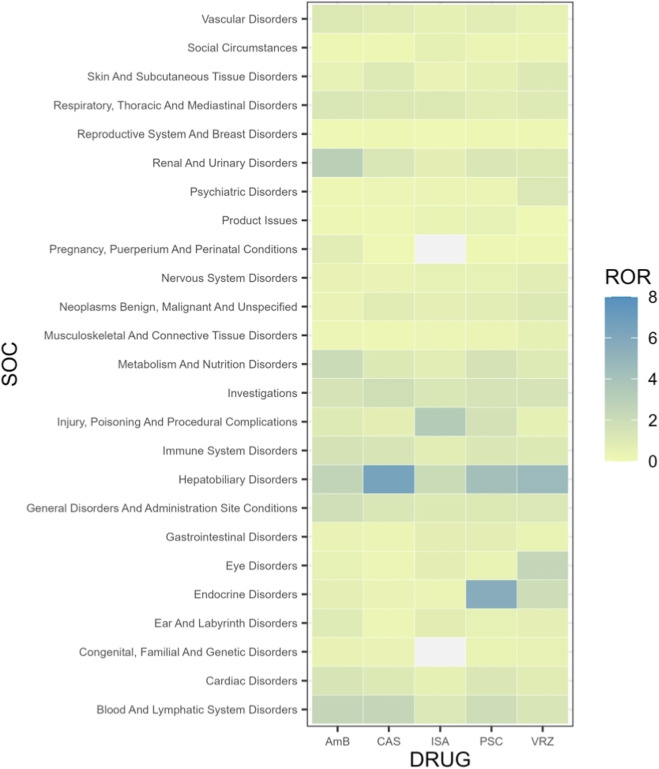 FIGURE 3
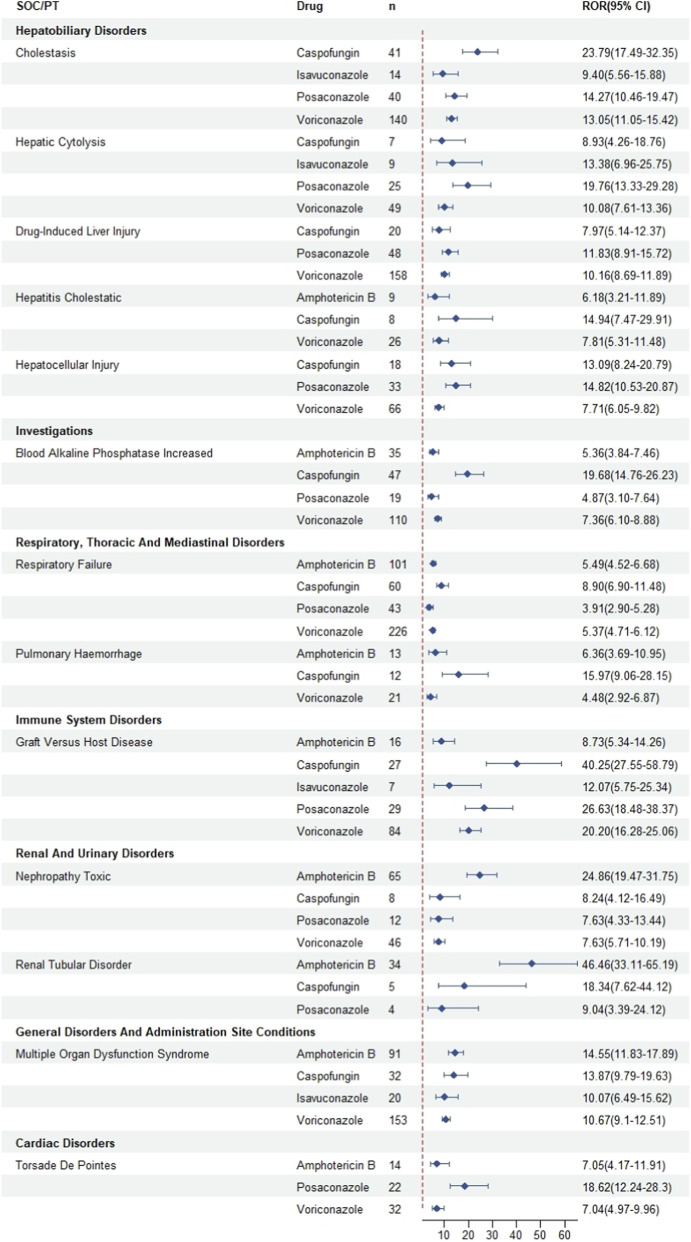 FIGURE 4
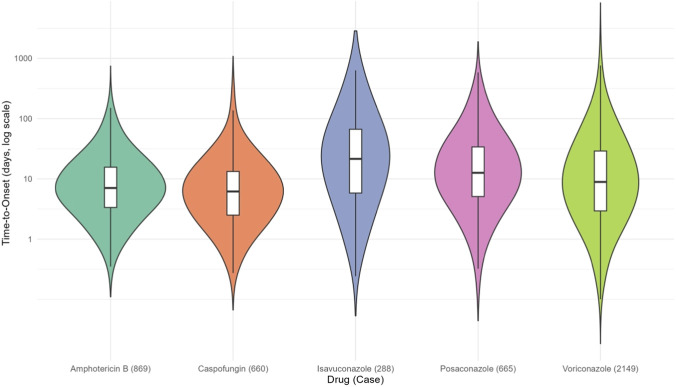 FIGURE 5
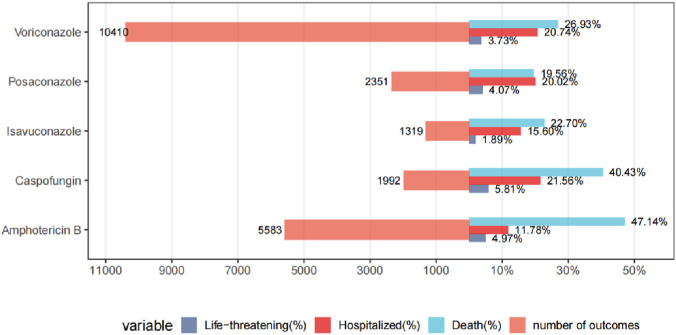 FIGURE 6
| U.S. FDA initial year of approval | Generic name | Brand name | Classification |
|---|---|---|---|
| 1997 | Amphotericin B (AmB) | Fungizone AmBisome* | Polyenes |
| 2002 | Voriconazole (VRZ) | Vfend | Triazoles |
| 2006 | Posaconazole (PSC) | Noxafil | Triazoles |
| 2015 | Isavuconazole (ISA) | Cresemba | Triazoles |
| 2001 | Caspofungin (CAS) | Cancidas | Echinocandins |
| Method | Equation | Criteria |
|---|---|---|
| ROR | ROR = ad/bc | Lower limit of 95% CI > 1, N ≥ 3 |
| 95% CI = eln(ROR)±1.96(1/a+1/b+1/c+1/d)0.5 | ||
| PRR | PRR = (a(c+d))/(c(a+b)) | PRR≥2, χ2 ≥ 4, N ≥ 3 |
| χ2 = [(ad − bc)2] (a + b + c + d)/[(a + b)(c + d)(a + c)(b + d)] | ||
| BCPNN | IC = log2a (a+b+c+d)(a+c)(a+b) | IC025 > 0 |
| IC025 = eln(IC)-1.96(1/a+1/b+1/c+1/d)0.5 | ||
| MGPS | EBGM = a (a+b+c+d)/((a+c)/(a+b)) | EBGM05 > 2, N > 0 |
| EBGM05 = eln(EBGM)-1.64(1/a+1/b+1/c+1/d)0.5 |
| Characteristics | Total | AMB | VRZ | PSC | ISA | CAS |
|---|---|---|---|---|---|---|
| Number of reports | 26,004 | 6,077 | 11,970 | 3,517 | 2,167 | 2,273 |
| Gender, | ||||||
| Female | 8,919 (34.30) | 2,089 (34.38) | 3,935 (32.87) | 1,267 (36.03) | 826 (38.12) | 802 (35.28) |
| Male | 13,779 (52.99) | 3,320 (54.63) | 6,313 (52.74) | 1,767 (50.24) | 1,185 (54.68) | 1,194 (52.53) |
| Unknown | 3,306 (12.71) | 668 (10.99) | 1,722 (14.39) | 483 (13.73) | 156 (7.20) | 277 (12.19) |
| Age (year), | ||||||
| <18 | 2,376 (9.14) | 750 (12.34) | 953 (7.96) | 354 (10.07) | 65 (3.00) | 254 (11.17) |
| 18–64 | 10,399 (39.99) | 2,919 (48.03) | 4,483 (37.45) | 1,428 (40.60) | 561 (25.89) | 1,008 (44.35) |
| ≥65 | 6,766 (26.02) | 1,206 (19.85) | 3,714 (31.03) | 822 (23.37) | 475 (21.92) | 549 (24.15) |
| Unknown | 6,463 (24.85) | 1,202 (19.78) | 2,820 (23.56) | 913 (25.96) | 1,066 (49.19) | 462 (20.33) |
| Reported person, | ||||||
| Consumer | 7,253 (27.89) | 3,010 (49.53) | 2,079 (17.37) | 683 (19.42) | 1,253 (57.82) | 228 (10.03) |
| Health professionals | 4,233 (16.28) | 834 (13.72) | 2247 (18.77) | 774 (22.01) | 83 (3.83) | 295 (12.98) |
| Physician | 7,056 (27.13) | 762 (12.54) | 3,760 (31.41) | 1,110 (31.56) | 364 (16.80) | 1,060 (46.63) |
| Other health professional* | 4,542 (17.47) | 880 (14.48) | 2,406 (20.10) | 556 (15.81) | 292 (13.47) | 408 (17.95) |
| Pharmacist | 2,289 (8.80) | 446 (7.34) | 1,121 (9.37) | 345 (9.81) | 161 (7.43) | 216 (9.50) |
| Unknown | 623 (2.40) | 142 (2.34) | 354 (2.96) | 48 (1.36) | 13 (0.60) | 66 (2.90) |
| Reported countries, | ||||||
| USA | 9,371 (36.04) | 1,159 (19.07) | 4,493 (37.54) | 1,885 (53.60) | 1,469 (67.79) | 365 (16.06) |
| Japan | 2,086 (8.02) | 462 (7.60) | 1,234 (10.31) | 92 (2.62) | 13 (0.60) | 285 (12.54) |
| France | 2,223 (8.55) | 227 (3.74) | 1,153 (9.63) | 402 (11.43) | 59 (2.72) | 382 (16.81) |
| China | 1,361 (5.23) | 54 (0.89) | 1,035 (8.65) | 122 (3.47) | 40 (1.85) | 110 (4.84) |
| UK | 3,444 (13.24) | 2,741 (45.10) | 437 (3.65) | 147 (4.18) | 40 (1.85) | 79 (3.48) |
| Outcome, | ||||||
| Death | 8,187 (31.48) | 2,865 (47.14) | 3,223 (26.93) | 688 (19.56) | 492 (22.70) | 919 (40.43) |
| Disability | 232 (0.89) | 49 (0.81) | 130 (1.09) | 24 (0.68) | 11 (0.51) | 18 (0.79) |
| Hospitalization | 4,730 (18.19) | 716 (11.78) | 2,482 (20.74) | 704 (20.02) | 338 (15.60) | 490 (21.56) |
| Life-threatening | 1,064 (4.09) | 302 (4.97) | 446 (3.73) | 143 (4.07) | 41 (1.89) | 132 (5.81) |
| Other serious outcome | 7,442 (28.62) | 1651 (27.17) | 4,129 (34.49) | 792 (22.52) | 437 (20.17) | 433 (19.05) |
| SOC | AMB | VRZ | PSC | ISA | CAS | |||||
|---|---|---|---|---|---|---|---|---|---|---|
| n | ROR (95% CI) | n | ROR (95% CI) | n | ROR (95% CI) | n | ROR (95% CI) | n | ROR (95% CI) | |
| Blood and lymphatic system disorders | 604 | 2.39 (2.20–2.59)* | 788 | 1.34 (1.24–1.43)* | 294 | 1.94 (1.72–2.17)* | 95 | 1.16 (0.95–1.43) | 223 | 2.40 (2.10–2.74)* |
| Cardiac disorders | 560 | 1.40 (1.29–1.53)* | 801 | 0.86 (0.80–0.93) | 290 | 1.21 (1.08–1.36)* | 76 | 0.59 (0.47–0.74) | 157 | 1.06 (0.90–1.24) |
| Congenital, familial and genetic disorders | 20 | 0.43 (0.28–0.67) | 52 | 0.49 (0.37–0.64) | 13 | 0.47 (0.27–0.81) | - | - | 6 | 0.35 (0.16–0.78) |
| Ear and labyrinth disorders | 60 | 0.92 (0.71–1.18) | 104 | 0.69 (0.57–0.84) | 20 | 0.51 (0.33–0.79) | 16 | 0.77 (0.47–1.26) | 5 | 0.21 (0.09–0.50) |
| Endocrine disorders | 26 | 0.67 (0.46–0.99) | 167 | 1.89 (1.63–2.20)* | 128 | 5.63 (4.73–6.71)* | 4 | 0.33 (0.12–0.87) | 5 | 0.35 (0.15–0.85) |
| Eye disorders | 158 | 0.51 (0.44–0.60) | 1664 | 2.45 (2.34–2.58)* | 84 | 0.46 (0.37–0.57) | 63 | 0.65 (0.51–0.83) | 22 | 0.19 (0.13–0.29) |
| Gastrointestinal disorders | 535 | 0.39 (0.36–0.43) | 1395 | 0.45 (0.42–0.47) | 564 | 0.71 (0.65–0.77) | 314 | 0.75 (0.67–0.84) | 155 | 0.31 (0.26–0.36) |
| General disorders and administration site conditions | 4067 | 1.74 (1.68–1.80)* | 6770 | 1.14 (1.11–1.18)* | 1666 | 1.07 (1.01–1.13)* | 844 | 1.01 (0.94–1.09) | 1170 | 1.26 (1.18–1.34)* |
| Hepatobiliary disorders | 354 | 2.59 (2.33–2.88)* | 1419 | 4.61 (4.38–4.87)* | 336 | 4.18 (3.75–4.66)* | 91 | 2.10 (1.70–2.58)* | 314 | 6.46 (5.77–7.24)* |
| Immune system disorders | 258 | 1.54 (1.36–1.74)* | 389 | 1.01 (0.91–1.11) | 120 | 1.20 (1.00–1.43)* | 44 | 0.82 (0.61–1.11) | 86 | 1.39 (1.13–1.72)* |
| Injury, poisoning and procedural complications | 1379 | 0.97 (0.92–1.02) | 2006 | 0.59 (0.57–0.62) | 1276 | 1.59 (1.50–1.69)* | 1219 | 3.31 (3.10–3.53)* | 347 | 0.64 (0.58–0.72) |
| Investigations | 1358 | 1.49 (1.41–1.57)* | 3142 | 1.50 (1.45–1.56)* | 804 | 1.47 (1.37–1.58)* | 357 | 1.22 (1.09–1.35)* | 616 | 1.88 (1.72–2.04)* |
| Metabolism and nutrition disorders | 666 | 2.09 (1.93–2.26)* | 705 | 0.94 (0.87–1.01) | 292 | 1.52 (1.35–1.70)* | 84 | 0.81 (0.65–1.01) | 120 | 1.00 (0.83–1.20) |
| Musculoskeletal and connective tissue disorders | 191 | 0.23 (0.20–0.26) | 1047 | 0.56 (0.52–0.59) | 158 | 0.32 (0.27–0.37) | 57 | 0.22 (0.17–0.28) | 39 | 0.13 (0.09–0.17) |
| Neoplasms benign, malignant and unspecified | 152 | 0.37 (0.32–0.43) | 966 | 1.05 (0.98–1.11) | 198 | 0.82 (0.71–0.94) | 89 | 0.69 (0.56–0.85) | 131 | 0.88 (0.74–1.05) |
| Nervous system disorders | 581 | 0.43 (0.39–0.47) | 2491 | 0.83 (0.80–0.86) | 414 | 0.52 (0.47–0.57) | 223 | 0.53 (0.46–0.60) | 173 | 0.34 (0.30–0.40) |
| Pregnancy, puerperium and perinatal conditions | 55 | 0.84 (0.65–1.10) | 15 | 0.10 (0.06–0.17) | 4 | 0.10 (0.04–0.27) | - | - | 1 | 0.04 (0.01–0.29) |
| Product issues | 30 | 0.12 (0.09–0.18) | 28 | 0.05 (0.03–0.07) | 71 | 0.50 (0.39–0.63) | 36 | 0.47 (0.34–0.66) | 7 | 0.08 (0.04–0.17) |
| Psychiatric disorders | 162 | 0.18 (0.15–0.21) | 2286 | 1.16 (1.11–1.21)* | 135 | 0.25 (0.21–0.30) | 76 | 0.27 (0.21–0.33) | 66 | 0.20 (0.15–0.25) |
| Renal and urinary disorders | 787 | 2.91 (2.71–3.13)* | 706 | 1.10 (1.02–1.19)* | 196 | 1.18 (1.02–1.36)* | 58 | 0.65 (0.50–0.84) | 130 | 1.27 (1.07–1.51)* |
| Reproductive system and breast disorders | 4 | 0.03 (0.01–0.08) | 35 | 0.12 (0.09–0.17) | 11 | 0.15 (0.08–0.26) | 2 | 0.05 (0.01–0.20) | 4 | 0.09 (0.03–0.23) |
| Respiratory, thoracic and mediastinal disorders | 886 | 1.24 (1.15–1.32)* | 1622 | 0.97 (0.93–1.02) | 344 | 0.79 (0.71–0.88) | 249 | 1.09 (0.96–1.24) | 293 | 1.10 (0.98–1.24) |
| Skin and subcutaneous tissue disorders | 423 | 0.50 (0.46–0.56) | 1926 | 1.03 (0.98–1.08) | 295 | 0.59 (0.53–0.67) | 94 | 0.35 (0.29–0.43) | 281 | 0.93 (0.83–1.05) |
| Social circumstances | 8 | 0.12 (0.06–0.24) | 44 | 0.29 (0.22–0.39) | 13 | 0.33 (0.19–0.57) | 12 | 0.58 (0.33–1.01) | 2 | 0.08 (0.02–0.33) |
| Vascular disorders | 351 | 1.07 (0.96–1.19) | 413 | 0.54 (0.49–0.60) | 159 | 0.81 (0.69–0.95) | 61 | 0.58 (0.45–0.75) | 107 | 0.88 (0.73–1.07) |
| Drugs | SOC | PT | n | ROR (95% CI) | PRR (χ2) | IC (IC025) | EBGM (EBGM05) |
|---|---|---|---|---|---|---|---|
| AMB | Blood and lymphatic system disorders | Pancytopenia* | 122 | 8.93 (7.47–10.67) | 8.87 (850.00) | 3.14 (2.88) | 8.85 (7.62) |
| Bone marrow failure* | 37 | 6.82 (4.94–9.42) | 6.81 (183.07) | 2.77 (2.30) | 6.80 (5.19) | ||
| Disseminated intravascular coagulation* | 31 | 8.49 (5.97–12.09) | 8.48 (204.02) | 3.08 (2.57) | 8.46 (6.30) | ||
| Cardiac disorders | Tachycardia | 96 | 4.33 (3.54–5.29) | 4.31 (243.94) | 2.11 (1.81) | 4.30 (3.64) | |
| Ventricular fibrillation* | 23 | 8.06 (5.35–12.14) | 8.05 (141.71) | 3.01 (2.42) | 8.03 (5.70) | ||
| Torsade de pointes* | 14 | 7.05 (4.17–11.91) | 7.04 (72.44) | 2.81 (2.07) | 7.03 (4.53) | ||
| Endocrine disorders | Diabetes insipidus | 13 | 21.15 (12.26–36.50) | 21.14 (247.92) | 4.39 (3.62) | 21.02 (13.32) | |
| Eye disorders | Ocular toxicity | 4 | 19.07 (7.14–50.95) | 19.06 (68.10) | 4.25 (2.95) | 18.97 (8.33) | |
| General disorders and administration site conditions | Chills | 112 | 3.78 (3.14–4.55) | 3.76 (226.86) | 1.91 (1.64) | 3.75 (3.21) | |
| Multiple organ dysfunction syndrome* | 91 | 14.55 (11.83–17.89) | 14.47 (1136.61) | 3.85 (3.55) | 14.41 (12.13) | ||
| Hepatobiliary disorders | Hepatic function abnormal | 43 | 4.74 (3.51–6.40) | 4.73 (126.42) | 2.24 (1.80) | 4.73 (3.68) | |
| Hepatic failure* | 35 | 4.56 (3.27–6.35) | 4.55 (96.93) | 2.18 (1.70) | 4.55 (3.44) | ||
| Hyperbilirubinaemia | 19 | 7.49 (4.77–11.75) | 7.48 (106.51) | 2.90 (2.25) | 7.47 (5.12) | ||
| Immune system disorders | Anaphylactic shock* | 26 | 4.19 (2.85–6.16) | 4.19 (63.04) | 2.06 (1.51) | 4.18 (3.03) | |
| Graft versus host disease | 16 | 8.73 (5.34–14.26) | 8.72 (109.07) | 3.12 (2.42) | 8.70 (5.77) | ||
| Investigations | Blood creatinine increased | 156 | 9.38 (8.01–10.99) | 9.29 (1152.92) | 3.21 (2.98) | 9.27 (8.12) | |
| Oxygen saturation decreased* | 64 | 4.77 (3.73–6.10) | 4.76 (189.88) | 2.25 (1.89) | 4.75 (3.87) | ||
| Blood potassium decreased | 62 | 8.14 (6.34–10.45) | 8.11 (386.02) | 3.02 (2.65) | 8.10 (6.57) | ||
| Alanine aminotransferase increased | 60 | 3.82 (2.96–4.92) | 3.81 (124.31) | 1.93 (1.56) | 3.81 (3.08) | ||
| Aspartate aminotransferase increased | 58 | 4.26 (3.29–5.52) | 4.25 (144.13) | 2.09 (1.71) | 4.25 (3.42) | ||
| Blood bilirubin increased | 41 | 5.88 (4.33–8.00) | 5.87 (165.51) | 2.55 (2.11) | 5.86 (4.54) | ||
| Liver function test abnormal | 40 | 5.19 (3.81–7.08) | 5.18 (134.79) | 2.37 (1.92) | 5.17 (3.99) | ||
| Blood urea increased | 37 | 8.33 (6.03–11.51) | 8.31 (237.49) | 3.05 (2.58) | 8.29 (6.33) | ||
| Blood alkaline phosphatase increased | 35 | 5.36 (3.84–7.46) | 5.35 (123.51) | 2.42 (1.93) | 5.34 (4.04) | ||
| Blood magnesium decreased | 20 | 9.32 (6.01–14.46) | 9.31 (147.92) | 3.21 (2.58) | 9.29 (6.43) | ||
| Metabolism and nutrition disorders | Hypokalaemia | 304 | 27.28 (24.34–30.57) | 26.75 (7484.01) | 4.73 (4.56) | 26.56 (24.14) | |
| Hyperkalaemia | 53 | 6.13 (4.68–8.02) | 6.11 (226.12) | 2.61 (2.21) | 6.10 (4.87) | ||
| Hypomagnesaemia | 47 | 13.99 (10.50–18.63) | 13.95 (562.72) | 3.80 (3.38) | 13.89 (10.93) | ||
| Metabolic acidosis | 35 | 4.51 (3.24–6.28) | 4.50 (95.22) | 2.17 (1.69) | 4.50 (3.41) | ||
| Nervous system disorders | Intracranial pressure increased* | 12 | 8.61 (4.88–15.17) | 8.60 (80.44) | 3.10 (2.30) | 8.58 (5.34) | |
| Renal and urinary disorders | Renal impairment | 149 | 7.29 (6.20–8.57) | 7.23 (799.19) | 2.85 (2.61) | 7.22 (6.30) | |
| Acute kidney injury | 145 | 3.93 (3.34–4.63) | 3.90 (313.31) | 1.96 (1.72) | 3.90 (3.40) | ||
| Renal failure | 123 | 3.52 (2.95–4.21) | 3.50 (220.09) | 1.81 (1.55) | 3.50 (3.02) | ||
| Nephropathy toxic | 65 | 24.86 (19.47–31.75) | 24.76 (1471.79) | 4.62 (4.26) | 24.59 (20.04) | ||
| Renal disorder | 47 | 4.00 (3.00–5.32) | 3.99 (105.23) | 1.99 (1.58) | 3.99 (3.14) | ||
| Renal tubular disorder* | 34 | 46.46 (33.11–65.19) | 46.36 (1489.49) | 5.52 (5.02) | 45.77 (34.48) | ||
| Respiratory, thoracic and mediastinal disorders | Respiratory failure | 101 | 5.49 (4.52–6.68) | 5.46 (368.17) | 2.45 (2.16) | 5.46 (4.63) | |
| Respiratory distress* | 46 | 6.62 (4.95–8.84) | 6.60 (218.19) | 2.72 (2.30) | 6.59 (5.17) | ||
| Tachypnoea* | 36 | 10.87 (7.83–15.08) | 10.84 (320.79) | 3.43 (2.96) | 10.81 (8.22) | ||
| Bronchospasm | 27 | 7.39 (5.07–10.79) | 7.38 (148.66) | 2.88 (2.33) | 7.37 (5.37) | ||
| Skin and subcutaneous tissue disorders | Toxic epidermal necrolysis* | 30 | 8.06 (5.63–11.53) | 8.04 (184.69) | 3.01 (2.49) | 8.03 (5.95) | |
| Vascular disorders | Shock* | 44 | 7.90 (5.87–10.62) | 7.88 (263.82) | 2.98 (2.54) | 7.86 (6.14) | |
| VRZ | Blood and lymphatic system disorders | Hypoprothrombinaemia* | 5 | 27.98 (11.55–67.76) | 27.98 (127.74) | 4.78 (3.59) | 27.49 (13.12) |
| Cardiac disorders | Torsade de pointes | 32 | 7.04 (4.97–9.96) | 7.03 (164.82) | 2.81 (2.30) | 7.00 (5.24) | |
| Cardiovascular insufficiency* | 13 | 13.34 (7.73–23.03) | 13.34 (147.07) | 3.73 (2.95) | 13.23 (8.38) | ||
| Endocrine disorders | Inappropriate antidiuretic hormone secretion* | 61 | 10.88 (8.45–14.00) | 10.86 (542.33) | 3.43 (3.06) | 10.79 (8.74) | |
| Adrenal insufficiency | 32 | 5.13 (3.62–7.25) | 5.12 (105.84) | 2.35 (1.85) | 5.11 (3.82) | ||
| Cushing's syndrome* | 20 | 8.59 (5.53–13.33) | 8.58 (133.28) | 3.09 (2.46) | 8.54 (5.91) | ||
| Eye disorders | Visual impairment | 318 | 4.67 (4.18–5.22) | 4.64 (907.26) | 2.21 (2.05) | 4.63 (4.22) | |
| Photophobia | 106 | 10.17 (8.40–12.31) | 10.14 (867.99) | 3.33 (3.05) | 10.08 (8.59) | ||
| Toxic optic neuropathy* | 49 | 228.80 (169.46–308.93) | 228.48 (9662.84) | 7.64 (7.20) | 199.07 (154.84) | ||
| Photopsia* | 43 | 11.83 (8.76–15.97) | 11.81 (422.40) | 3.55 (3.12) | 11.73 (9.12) | ||
| Halo vision* | 38 | 59.55 (43.06–82.35) | 59.48 (2103.69) | 5.84 (5.37) | 57.31 (43.69) | ||
| Xanthopsia* | 38 | 207.57 (147.91–291.30) | 207.34 (6876.69) | 7.51 (7.02) | 182.84 (137.70) | ||
| Dyschromatopsia | 37 | 87.28 (62.66–121.57) | 87.19 (2983.31) | 6.37 (5.89) | 82.56 (62.57) | ||
| Visual field defect | 33 | 7.73 (5.49–10.88) | 7.72 (192.15) | 2.94 (2.45) | 7.69 (5.77) | ||
| Chromatopsia | 31 | 70.00 (48.84–100.35) | 69.94 (2015.07) | 6.06 (5.54) | 66.94 (49.53) | ||
| Chloropsia* | 19 | 336.23 (204.66–552.38) | 336.04 (5209.22) | 8.11 (7.41) | 275.99 (182.17) | ||
| Gastrointestinal disorders | Cheilitis | 41 | 13.03 (9.58–17.73) | 13.02 (451.13) | 3.69 (3.24) | 12.92 (9.99) | |
| Lip blister* | 17 | 10.74 (6.66–17.30) | 10.73 (149.03) | 3.41 (2.73) | 10.67 (7.16) | ||
| General disorders and administration site conditions | Multiple organ dysfunction syndrome | 153 | 10.67 (9.10–12.51) | 10.63 (1325.83) | 3.40 (3.17) | 10.56 (9.24) | |
| Necrosis* | 25 | 7.65 (5.17–11.34) | 7.65 (143.76) | 2.93 (2.36) | 7.61 (5.48) | ||
| Hepatobiliary disorders | Hepatic function abnormal | 203 | 9.83 (8.56–11.29) | 9.78 (1590.93) | 3.28 (3.08) | 9.72 (8.66) | |
| Hepatotoxicity | 188 | 15.31 (13.26–17.68) | 15.23 (2476.28) | 3.92 (3.70) | 15.09 (13.38) | ||
| Drug-induced liver injury | 158 | 10.16 (8.69–11.89) | 10.12 (1290.64) | 3.33 (3.10) | 10.06 (8.82) | ||
| Cholestasis | 140 | 13.05 (11.05–15.42) | 13.00 (1538.88) | 3.69 (3.45) | 12.90 (11.22) | ||
| Hepatocellular injury* | 66 | 7.71 (6.05–9.82) | 7.70 (382.73) | 2.94 (2.58) | 7.66 (6.26) | ||
| Liver injury | 63 | 5.24 (4.09–6.72) | 5.24 (215.28) | 2.38 (2.02) | 5.22 (4.25) | ||
| Hepatic cytolysis* | 49 | 10.08 (7.61–13.36) | 10.07 (397.77) | 3.32 (2.91) | 10.01 (7.91) | ||
| Hyperbilirubinaemia | 38 | 6.54 (4.76–9.00) | 6.53 (177.41) | 2.70 (2.24) | 6.51 (4.99) | ||
| Hepatitis cholestatic | 26 | 7.81 (5.31–11.48) | 7.80 (153.41) | 2.96 (2.40) | 7.77 (5.63) | ||
| Hypertransaminasaemia | 26 | 8.07 (5.49–11.86) | 8.06 (159.99) | 3.00 (2.45) | 8.02 (5.81) | ||
| Immune system disorders | Graft versus host disease | 84 | 20.20 (16.28–25.06) | 20.15 (1509.58) | 4.32 (4.00) | 19.91 (16.62) | |
| Hypogammaglobulinaemia* | 15 | 4.82 (2.90–8.00) | 4.82 (45.24) | 2.26 (1.54) | 4.81 (3.14) | ||
| Investigations | Alanine aminotransferase increased | 131 | 3.64 (3.06–4.32) | 3.63 (249.11) | 1.86 (1.61) | 3.62 (3.14) | |
| Aspartate aminotransferase increased | 119 | 3.81 (3.19–4.57) | 3.80 (245.64) | 1.93 (1.66) | 3.80 (3.27) | ||
| Blood alkaline phosphatase increased* | 110 | 7.36 (6.10–8.88) | 7.34 (600.22) | 2.87 (2.60) | 7.31 (6.25) | ||
| Liver function test abnormal | 108 | 6.12 (5.07–7.40) | 6.11 (459.86) | 2.61 (2.33) | 6.09 (5.20) | ||
| Gamma-glutamyltransferase increased | 100 | 7.52 (6.18–9.15) | 7.50 (560.76) | 2.90 (2.61) | 7.47 (6.33) | ||
| Electrocardiogram qt prolonged | 83 | 4.06 (3.27–5.04) | 4.05 (190.48) | 2.02 (1.70) | 4.04 (3.38) | ||
| Blood bilirubin increased | 68 | 4.25 (3.35–5.40) | 4.25 (168.45) | 2.08 (1.74) | 4.24 (3.47) | ||
| Transaminases increased | 57 | 4.44 (3.42–5.76) | 4.43 (151.16) | 2.15 (1.77) | 4.42 (3.56) | ||
| Fluoride increased* | 32 | 2593.93 (1470.22–4576.49) | 2591.52 (30,871.23) | 9.92 (9.27) | 966.10 (600.76) | ||
| Musculoskeletal and connective tissue disorders | Periostitis* | 168 | 1231.12 (1005.00–1508.12) | 1225.14 (114,401.60) | 9.41 (9.15) | 682.51 (575.92) | |
| Rhabdomyolysis* | 94 | 3.95 (3.23–4.84) | 3.94 (206.00) | 1.98 (1.68) | 3.93 (3.32) | ||
| Hypertrophic osteoarthropathy* | 20 | 669.39 (395.95–1131.67) | 669.01 (9297.71) | 8.87 (8.14) | 466.58 (300.69) | ||
| Nervous system disorders | Neurotoxicity | 120 | 12.86 (10.75–15.40) | 12.82 (1297.62) | 3.67 (3.41) | 12.72 (10.95) | |
| Altered state of consciousness* | 106 | 8.92 (7.37–10.80) | 8.90 (739.00) | 3.15 (2.87) | 8.85 (7.54) | ||
| Posterior reversible encephalopathy syndrome* | 28 | 5.42 (3.74–7.86) | 5.42 (100.61) | 2.43 (1.90) | 5.41 (3.96) | ||
| Psychiatric disorders | Hallucination | 448 | 10.75 (9.79–11.80) | 10.62 (3882.46) | 3.40 (3.26) | 10.56 (9.76) | |
| Hallucination, visual | 315 | 27.67 (24.74–30.94) | 27.42 (7882.35) | 4.75 (4.59) | 26.96 (24.55) | ||
| Delirium | 142 | 7.35 (6.23–8.67) | 7.33 (772.57) | 2.87 (2.62) | 7.30 (6.35) | ||
| Mental disorder | 88 | 3.50 (2.84–4.32) | 3.50 (156.51) | 1.80 (1.50) | 3.49 (2.93) | ||
| Disorganised speech | 57 | 64.79 (49.69–84.46) | 64.68 (3429.61) | 5.96 (5.57) | 62.11 (49.75) | ||
| Hallucination, auditory | 45 | 4.91 (3.66–6.58) | 4.90 (139.41) | 2.29 (1.86) | 4.89 (3.83) | ||
| Hallucinations, mixed | 29 | 12.26 (8.51–17.67) | 12.25 (297.34) | 3.60 (3.08) | 12.16 (8.96) | ||
| Renal and urinary disorders | Nephropathy toxic* | 46 | 7.63 (5.71–10.19) | 7.62 (263.22) | 2.92 (2.50) | 7.59 (5.95) | |
| Respiratory, thoracic and mediastinal disorders | Respiratory failure | 226 | 5.37 (4.71–6.12) | 5.34 (794.67) | 2.41 (2.22) | 5.32 (4.77) | |
| Haemoptysis | 91 | 5.60 (4.55–6.88) | 5.59 (341.48) | 2.48 (2.18) | 5.57 (4.69) | ||
| Pulmonary haemorrhage* | 21 | 4.48 (2.92–6.87) | 4.48 (56.52) | 2.16 (1.54) | 4.47 (3.12) | ||
| Skin and subcutaneous tissue disorders | Photosensitivity reaction | 397 | 43.06 (38.96–47.61) | 42.58 (15,690.35) | 5.37 (5.23) | 41.46 (38.12) | |
| Actinic keratosis* | 110 | 72.90 (60.20–88.29) | 72.67 (7425.36) | 6.12 (5.84) | 69.44 (59.16) | ||
| Dermatitis bullous* | 36 | 8.78 (6.33–12.19) | 8.78 (246.66) | 3.13 (2.65) | 8.73 (6.64) | ||
| Pseudoporphyria* | 24 | 124.43 (82.08–188.63) | 124.34 (2716.85) | 6.85 (6.25) | 115.12 (81.27) | ||
| Lentigo* | 20 | 69.35 (44.30–108.56) | 69.31 (1288.49) | 6.05 (5.41) | 66.37 (45.61) | ||
| PSC | Blood and lymphatic system disorders | Febrile neutropenia | 60 | 6.20 (4.81–7.99) | 6.16 (259.61) | 2.62 (2.25) | 6.16 (4.98) |
| Cardiac disorders | Torsade de pointes* | 22 | 18.62 (12.24–28.30) | 18.57 (364.68) | 4.21 (3.61) | 18.52 (13.04) | |
| Pericardial effusion* | 18 | 5.33 (3.36–8.47) | 5.33 (63.20) | 2.41 (1.75) | 5.32 (3.61) | ||
| Endocrine disorders | Pseudoaldosteronism | 61 | 3335.87 (2436.70–4566.84) | 3313.23 (129,508.39) | 11.05 (10.62) | 2124.72 (1633.68) | |
| Hepatobiliary disorders | Drug-induced liver injury* | 48 | 11.83 (8.91–15.72) | 11.77 (472.55) | 3.56 (3.14) | 11.75 (9.27) | |
| Cholestasis* | 40 | 14.27 (10.46–19.47) | 14.21 (490.20) | 3.83 (3.37) | 14.18 (10.93) | ||
| Hepatotoxicity | 36 | 11.17 (8.05–15.51) | 11.13 (331.52) | 3.47 (3.00) | 11.11 (8.45) | ||
| Hepatocellular injury* | 33 | 14.82 (10.53–20.87) | 14.77 (422.68) | 3.88 (3.38) | 14.74 (11.07) | ||
| Hepatic cytolysis* | 25 | 19.76 (13.33–29.28) | 19.71 (442.50) | 4.30 (3.73) | 19.64 (14.14) | ||
| Immune system disorders | Graft versus host disease* | 29 | 26.63 (18.48–38.37) | 26.54 (709.79) | 4.72 (4.20) | 26.43 (19.47) | |
| Investigations | Electrocardiogram qt prolonged | 48 | 9.05 (6.81–12.02) | 9.01 (341.40) | 3.17 (2.76) | 9.00 (7.09) | |
| Liver function test abnormal | 28 | 6.09 (4.20–8.83) | 6.08 (118.67) | 2.60 (2.06) | 6.07 (4.45) | ||
| Metabolism and nutrition disorders | Hypokalaemia | 91 | 13.48 (10.96–16.57) | 13.35 (1038.33) | 3.74 (3.43) | 13.32 (11.21) | |
| Hypomagnesaemia | 21 | 10.45 (6.80–16.03) | 10.42 (178.63) | 3.38 (2.76) | 10.41 (7.27) | ||
| Hypophosphataemia* | 14 | 13.01 (7.70–21.99) | 12.99 (154.66) | 3.70 (2.95) | 12.97 (8.36) | ||
| Nervous system disorders | Neurotoxicity* | 17 | 6.95 (4.32–11.19) | 6.94 (86.35) | 2.79 (2.11) | 6.93 (4.65) | |
| Renal and urinary disorders | Nephropathy toxic* | 12 | 7.63 (4.33–13.44) | 7.62 (68.92) | 2.93 (2.13) | 7.61 (4.74) | |
| Respiratory, thoracic and mediastinal disorders | Respiratory failure* | 43 | 3.91 (2.90–5.28) | 3.90 (92.61) | 1.96 (1.53) | 3.89 (3.03) | |
| Pulmonary Mass* | 14 | 6.40 (3.79–10.82) | 6.39 (63.67) | 2.68 (1.93) | 6.39 (4.12) | ||
| ISA | Gastrointestinal disorders | Dysphagia* | 31 | 4.19 (2.94–5.96) | 4.17 (74.69) | 2.06 (1.55) | 4.17 (3.10) |
| General disorders and administration site conditions | Death* | 266 | 4.12 (3.64–4.67) | 3.95 (593.93) | 1.98 (1.80) | 3.95 (3.56) | |
| Multiple organ dysfunction syndrome* | 20 | 10.07 (6.49–15.62) | 10.03 (162.48) | 3.32 (2.69) | 10.02 (6.94) | ||
| Hepatobiliary disorders | Cholestasis* | 14 | 9.40 (5.56–15.88) | 9.37 (104.65) | 3.23 (2.48) | 9.37 (6.04) | |
| Hepatotoxicity | 14 | 8.18 (4.84–13.83) | 8.16 (87.95) | 3.03 (2.28) | 8.16 (5.26) | ||
| Respiratory, thoracic and mediastinal disorders | Haemoptysis* | 13 | 5.79 (3.36–9.98) | 5.78 (51.34) | 2.53 (1.76) | 5.77 (3.66) | |
| CAS | Blood and lymphatic system disorders | Pancytopenia* | 29 | 5.74 (3.99–8.27) | 5.72 (112.91) | 2.51 (1.99) | 5.71 (4.21) |
| Eosinophilia* | 26 | 16.54 (11.25–24.33) | 16.47 (377.27) | 4.04 (3.48) | 16.44 (11.91) | ||
| Agranulocytosis | 20 | 12.26 (7.90–19.02) | 12.22 (205.81) | 3.61 (2.98) | 12.20 (8.45) | ||
| Disseminated intravascular coagulation* | 20 | 14.90 (9.60–23.13) | 14.85 (258.08) | 3.89 (3.26) | 14.83 (10.27) | ||
| General disorders and administration site conditions | Multiple organ dysfunction syndrome* | 32 | 13.87 (9.79–19.63) | 13.79 (379.25) | 3.78 (3.28) | 13.77 (10.30) | |
| Hepatobiliary disorders | Cholestasis* | 41 | 23.79 (17.49–32.35) | 23.62 (886.15) | 4.56 (4.11) | 23.56 (18.21) | |
| Hepatic function abnormal | 31 | 9.31 (6.54–13.26) | 9.27 (228.54) | 3.21 (2.70) | 9.26 (6.89) | ||
| Hepatic failure | 27 | 9.58 (6.56–13.99) | 9.54 (206.35) | 3.25 (2.71) | 9.53 (6.95) | ||
| Liver disorder | 21 | 5.21 (3.39–8.00) | 5.19 (71.10) | 2.38 (1.76) | 5.19 (3.63) | ||
| Drug-induced liver injury | 20 | 7.97 (5.14–12.37) | 7.95 (121.38) | 2.99 (2.36) | 7.94 (5.50) | ||
| Hepatotoxicity | 19 | 9.55 (6.08–14.98) | 9.52 (144.75) | 3.25 (2.60) | 9.51 (6.52) | ||
| Hepatocellular injury* | 18 | 13.09 (8.24–20.79) | 13.05 (200.01) | 3.70 (3.04) | 13.03 (8.85) | ||
| Immune system disorders | Graft versus host disease* | 27 | 40.25 (27.55–58.79) | 40.06 (1024.09) | 5.32 (4.77) | 39.90 (29.06) | |
| Haemophagocytic lymphohistiocytosis* | 7 | 13.13 (6.25–27.57) | 13.11 (78.23) | 3.71 (2.69) | 13.10 (7.04) | ||
| Investigations | Blood alkaline phosphatase increased | 47 | 19.68 (14.76–26.23) | 19.52 (824.63) | 4.28 (3.87) | 19.48 (15.32) | |
| Alanine aminotransferase increased | 46 | 7.99 (5.98–10.69) | 7.94 (278.93) | 2.99 (2.56) | 7.93 (6.22) | ||
| Aspartate aminotransferase increased | 42 | 8.42 (6.21–11.41) | 8.36 (272.30) | 3.06 (2.62) | 8.36 (6.48) | ||
| Gamma-glutamyltransferase increased | 31 | 14.53 (10.21–20.69) | 14.45 (387.79) | 3.85 (3.34) | 14.43 (10.74) | ||
| Blood lactate dehydrogenase increased* | 28 | 18.02 (12.43–26.13) | 17.93 (446.96) | 4.16 (3.62) | 17.90 (13.12) | ||
| Blood bilirubin increased | 27 | 10.55 (7.23–15.40) | 10.50 (232.02) | 3.39 (2.84) | 10.49 (7.65) | ||
| CAS | Metabolism and nutrition disorders | Hypokalaemia | 28 | 6.68 (4.61–9.68) | 6.65 (134.44) | 2.73 (2.20) | 6.65 (4.87) |
| Nervous system disorders | Encephalopathy* | 16 | 7.15 (4.38–11.69) | 7.14 (84.38) | 2.83 (2.13) | 7.13 (4.73) | |
| Respiratory, thoracic and mediastinal disorders | Respiratory failure* | 60 | 8.90 (6.90–11.48) | 8.82 (415.90) | 3.14 (2.77) | 8.81 (7.12) | |
| Acute respiratory distress syndrome | 24 | 14.68 (9.83–21.92) | 14.62 (304.10) | 3.87 (3.29) | 14.60 (10.43) | ||
| Skin and subcutaneous tissue disorders | Drug reaction with eosinophilia and systemic symptoms* | 40 | 17.99 (13.18–24.56) | 17.87 (635.99) | 4.16 (3.70) | 17.84 (13.75) | |
| Rash maculo-papular | 22 | 11.02 (7.25–16.76) | 10.98 (199.51) | 3.46 (2.85) | 10.97 (7.73) |
Peer Reviews
No public reviews on file for this paper yet. If you reviewed it on a platform where reviews are public (OpenReview, ICLR, NeurIPS, ICML), you can paste yours below so the community can read it here.
Videos
No videos yet. Explain this paper in a talk, walkthrough, or lecture? Add one.
Taxonomy
TopicsPharmacovigilance and Adverse Drug Reactions · Antifungal resistance and susceptibility · Psoriasis: Treatment and Pathogenesis
Introduction
1
Invasive aspergillosis (IA), a life-threatening fungal infection caused primarily by Aspergillus fumigatus, poses significant clinical challenges for immunocompromised populations. Ubiquitous in environmental reservoirs including soil, decomposing vegetation, and airborne particulates, Aspergillus spores initiate infection through inhalation, subsequently germinating and invading host tissues. Hematogenous dissemination frequently results in multi-organ involvement, with pulmonary manifestations predominating, followed by neurological, renal, and sinus complications (Machado et al., 2024; Karthaus and Buchheidt, 2013). Mortality rates remain substantial despite therapeutic advances, necessitating optimized antifungal management strategies.
Current Food and Drug Administration (FDA)-approved therapies for IA encompass three principal antifungal classes: triazoles (Voriconazole, Posaconazole, Isavuconazole), polyenes (Amphotericin B and its lipid derivatives), and echinocandins (Caspofungin). While these agents demonstrate varying efficacy profiles, their safety limitations present critical clinical challenges. Voriconazole, despite its recommendation as first-line therapy, carries risks of neurotoxicity, hepatotoxicity, and complex cytochrome-mediated drug interactions. Amphotericin B formulations, though broad-spectrum, exhibit dose-limiting nephrotoxicity and infusion-related reactions. Echinocandins, while better tolerated, may induce hepatic enzyme elevations and injection-site complications (Boyer et al., 2023; Cadena et al., 2016). These safety concerns highlight the need for systematic pharmacovigilance in treatment optimization.
The FDA Adverse Event Reporting System (FAERS) serves as a vital surveillance tool for post-marketing drug safety evaluation, aggregating over 18 million spontaneous AE reports since 1968. Its utility extends beyond regulatory monitoring, enabling hypothesis generation through disproportionality analysis–a quantitative signal detection methodology that identifies disproportionate drug-AE associations relative to background reporting rates. This approach has proven particularly valuable for detecting rare or delayed-onset toxicities undetected in premarketing trials (Polep et al., 2014). Recent applications in antifungal pharmacovigilance have revealed underreported safety patterns, including azole-associated periostitis and echinocandin-induced histamine release syndromes.
This investigation employs FAERS data-mining strategies to systematically evaluate hepatotoxic, nephrotoxic, and infusion-related AEs associated with contemporary IA therapies. Through comparative analysis of AE signals across antifungal classes, we aim to: (1) quantify real-world toxicity profiles, (2) identify class-specific safety signatures, and (3) inform risk mitigation strategies for vulnerable populations. Our findings seek to complement clinical trial evidence by elucidating population-level safety patterns, ultimately guiding therapeutic decision-making in invasive fungal disease management.
Materials and methods
2
Antifungal drugs
2.1
This study focused on five antifungal agents approved by the FDA for the treatment of IA: the triazoles voriconazole (VRZ), posaconazole (PSC), and isavuconazole (ISA); the polyene amphotericin B (AMB) (including its lipid formulations); and the echinocandin caspofungin (CAS). The initial FDA approval year for each agent in the context of IA is summarized in Table 1.
Data sources and processing
2.2
The study analyzed 21,838,627 AE reports from the FAERS database (2004Q1–2024Q3), a global pharmacovigilance repository adhering to ICH E2B guidelines (Food and Drug Administration, 2024). The dataset comprises seven normalized tables: Demographics (DEMO), Drug Information (DRUG), Adverse Events (REAC), Patient Outcomes (OUTC), Reporting Source (RPSR), Drug Therapy Duration (THER), and Indications for Use (INDI). Figure 1 illustrates the systematic data selection workflow. To address inherent duplication from quarterly updates, we implemented a hierarchical FDA-recommended deduplication strategy by retaining reports with the latest FDA_DT for identical CASE_IDs and selecting entries with the highest PRIMARY_ID when CASE_ID-FDA_DT pairs coincided, ultimately yielding 19,541,994 unique reports (10.5% reduction) as detailed in Figure 1.
Flowchart for screening AEs related to five antifungal agents from the FAERS database.
From the deduplicated dataset, 26,004 reports involving five antifungal agents were identified: AMB (n = 6,077), VRZ (n = 11,970), PSC (n = 3,517), ISA (n = 2,167), and CAS (n = 2,273). To enhance signal detection validity, only cases where these agents were designated as primary suspect (PS) drugs were included. AE terminology was standardized using MedDRA version 27.0, with Preferred Terms (PTs) systematically categorized into primary System Organ Classes (SOCs) to prevent multi-SOC duplication. This study was exempt from IRB approval as it exclusively analyzed de-identified, publicly available data from the FAERS database. All data handling procedures complied with FDA regulations for secondary analysis of pharmacovigilance data.
Statistical analysis
2.3
In this study, the disproportionation method was employed to evaluate the associations between five antifungal agents and AEs. Four signal calculation methods, namely the Reporting Odds Ratio (ROR), Proportional Reporting Ratio (PRR), Bayesian Confidence Propagation Neural Network (BCPNN), and Multi-item Gamma-Poisson Shrinkage (MGPS), were primarily utilized. These four signals are widely applied data mining algorithms in the analysis of the FAERS database (Sakaeda et al., 2013). The calculated ROR and PRR values, representing the strength of the association between the two drugs and AEs, both demonstrated positive correlations. To enhance the accuracy and reliability of the results, the MGPS and BCPNN methods were adopted to reduce the likelihood of false-positive outcomes. The formulas and signal detection criteria for these four algorithms are presented in Supplementary Table S1 and Table 2. Generally, a higher algorithm value indicates a more prominent signal, suggesting a stronger correlation between the drug and the occurrence of AEs.
According to the BCPNN signal intensity criteria: 0 < IC025 < 1.5 is categorized as weak signal, 1.5 ≤ IC025 < 3.0 indicates a moderately strong signal, and IC025 ≥ 3.0 represents a strong signal. Moderately strong or strong signals must be continuously monitored within a specific time period. This study mainly assesses and contrasts moderately strong signals where IC025 ≥ 1.5.
All data cleaning and visualization operations were carried out using R Version 4.3.3, while data collation was performed with Microsoft Excel 2021.
For comparisons of categorical outcomes (e.g., mortality rates, hospitalization rates) among the five antifungal agents, Pearson’s chi-squared (χ^2^) test was employed. A two-sided p-value of less than 0.05 was considered statistically significant.
Result
3
Descriptive analysis
3.1
From January 2004 to September 2024, a total of 21,838,627 AE reports were received by the FAERS. Among them, 26,004 AE reports were related to the target antifungal agents. Specifically, there were 6,077 reports for AMB, 11,970 for VRZ, 3,517 for PSC, 2,167 for ISA, and 2,273 for CAS. In terms of gender distribution, male patients accounted for 52.99%, exceeding female patients who accounted for 34.30%. The age of patients mainly ranged from 18 to 64 years old, with a proportion of 39.99%. For individual drugs, the percentages with this 18–64 age group were as follows: 48.03% for AMB, 37.45% for VRZ, 40.60% for PSC, 25.89% for ISA, and 44.35% for CAS. These reports predominantly originated from healthcare professionals such as doctors, nurses, pharmacists, and other health professionals (e.g., nurse practitioners, clinical coordinators), constituting 69.68% of the total submissions. Additionally, consumers contributed 27.89% of the reports. Remarkably, the United States had the highest number of reported cases, totaling 9,371 cases, which accounted for 36.04% of the total. Subsequently, the United Kingdom reported 3,444 cases (13.24%), followed by France with 2,223 cases (8.55%), Japan with 2,086 cases (8.02%), and China with 1,361 cases (5.23%). Table 3 offers an in-depth analysis of the patient demographics and adverse event reports associated with the utilization of antifungal agents.
Upon analyzing the reporting years, it was observed that for AMB and VRZ, there was an upward trajectory from 2004 to 2018, followed by a decline from 2019 onward. The number of PSC reports exhibited a steady increase over time. In contrast, the growth trend for CAS was modest. For ISA, the peak occurrence was noted in the fifth year following its market launch (as depicted in Figure 2).
Trends of AE occurrence of five antifungal agents from 2004 to 2024.
Risk signals of system organ classes (SOCs)
3.2
The potential AE signals were classified according to System Organ Classes (SOCs), with a total of 25 SOCs involved. The SOCs related to five antifungal agents are presented in Table 4 and Figure 3. The strongest AE signals at the SOC level for each drug were as follows. AMB: Renal and Urinary Disorders (ROR = 2.91). VRZ: Hepatobiliary Disorders (ROR = 4.61) and Eye Disorders (ROR = 2.45). PSC: Endocrine Disorders (ROR = 5.63) and Hepatobiliary Disorders (ROR = 4.18). ISA: Injury, Poisoning and Procedural Complications (ROR = 3.31). CAS: Hepatobiliary Disorders (ROR = 6.46). Detailed data for all SOCs are provided in Table 4. Notably, positive signals were detected for all five antifungal agents across three SOCs: “Hepatobiliary Disorders,” “Infections and Infestations,” and “Investigations.” However, “Infections and Infestations” was excluded from the signal analysis as it is directly related to the underlying disease diagnosis. In contrast, AEs related to “Hepatobiliary Disorders” are described, to varying degrees, in the product instructions of all five antifungal agents. This provides some validation of the positive signals detected in this study. The “Investigations” encompasses abnormal blood test results or other abnormal clinical examination findings. The presence of such findings may indicate clinically significant adverse reactions that extend beyond simple symptoms or physical signs.
Heatmap visualization of SOCs level reporting odds ratios (RORs). Darker blue colors indicate higher RORs, whereas lighter colors represent lower RORs.
Risk signals of preferred terms (PTs)
3.3
A total of 68,903 AEs associated with five antifungal agents were analyzed for risk signals. VRZ accounted for the highest proportion of reported AEs (n = 34,554, 50.1%), followed by AMB (n = 15,061, 21.9%), PSC (n = 8,985, 13.0%), CAS (n = 5,542, 8.0%), and ISA (n = 4,761, 6.9%). This disproportional AE distribution likely reflects variations in clinical utilization patterns, drug-specific pharmacokinetic properties, and intrinsic toxicity profiles. Table 5 and Figure 4 summarize the preferred terms (PTs) associated with these antifungal agents.
Forest plot of risk signals for antifungal agents: system organ class/preferred terms (SOC/PT) and reporting odds ratios (ROR). N, the number of AEs reports.
The most notable PT-level signals for each drug were: AMB: renal tubular disorder (ROR = 46.46) and nephropathy toxic (ROR = 24.86). VRZ: toxic optic neuropathy (ROR = 228.80) and actinic keratosis (ROR = 72.90). PSC: pseudoaldosteronism (ROR = 3335.87) and torsade de pointes (ROR = 18.62). ISA: death (ROR = 4.12). CAS: cholestasis (ROR = 23.79). A substantial proportion of these strong signals, marked with an asterisk (*) in Table 5, were not listed in the official drug labels, highlighting potential underrecognized risks. Full details are provided in Table 5 and Figure 4.
Time-to-onset (TTO) of AEs induced by five antifungal agents
3.4
The time-to-onset (TTO) profiles of AEs varied significantly among the five antifungal agents, as visualized in the violin plot (Figure 5). ISA exhibited the longest median TTO (19.5 days, IQR: 5–63.25 days), followed by PSC (13 days, IQR: 5–37 days) and VRZ (9 days, IQR: 3–30 days). In contrast, CAS and AMB showed shorter median TTO values (6 days and 7 days, respectively), with narrower interquartile ranges (IQR: 3–16 days and 3–15 days). Notably, the mean TTO values were substantially higher than the medians for all drugs (e.g., 55.9 days for ISA vs. 19.5 days median), reflecting skewed distributions with extreme outliers, particularly for VRZ (maximum TTO: 4,250 days) and AMB (maximum TTO: 3,964 days). The simulated violin plots (log-scale) further highlighted the right-skewed distributions and variability in TTO patterns, with CAS demonstrating the most concentrated distribution. These findings suggest distinct safety profiles among the drugs, where ISA and PSC are associated with delayed AE onset, while CAS and AMB may provoke earlier reactions. The temporal relationship between drug initiation and AE onset, as evidenced by the TTO analysis, supports a potential drug-related etiology for many of the reported events.
Comparative violin plot analysis of time-to-onset distributions for AEs induced by five antifungal agents.
Comparison of AE outcomes among five antifungal agents
3.5
As shown in Figure 6, analysis of AE outcomes from the FAERS database revealed distinct safety profiles among AMB, VRZ, PSC, ISA, and CAS. AMB demonstrated the highest mortality rate (47.14%), followed by CAS (40.43%) and VRZ (26.93%), whereas PSC and ISA exhibited markedly lower mortality rates (19.56% and 22.70%, respectively). ISA was associated with the lowest incidence of life-threatening AEs (1.89%), contrasting sharply with CAS (5.81%) and AMB (4.97%). Hospitalization rates ranged from 15.60% (ISA) to 21.56% (CAS), with VRZ and PSC showing intermediate values (20.74% and 20.02%, respectively). Notably, VRZ, despite having the highest number of reported outcomes (n = 10,410), displayed moderate severity across metrics, while AMB, with fewer cases (n = 5,583), was linked to disproportionately severe outcomes. These findings underscore the divergent safety profiles of the evaluated drugs, with ISA and PSC emerging as favorable options in terms of mortality and morbidity, whereas AMB and CAS posed elevated risks for severe AEs.
Comparative AE outcomes of five antifungal agents.
Discussion
4
Key findings and mechanistic insights
4.1
This pharmacovigilance study documents substantial heterogeneity in the safety profiles of five FDA-approved antifungal agents for invasive aspergillosis (IA). AMB exhibited the highest mortality (47.14%) and life-threatening AE rates (4.97%), driven by profound renal toxicity (e.g., nephropathy toxic: ROR = 24.86), while CAS also posed significant risks (40.43%), underscoring the need for cautious use in critically ill patients. At the SOC level, CAS showed moderate hepatobiliary risks (ROR = 6.46), but its cholestasis signal at the PT level was markedly higher (ROR = 23.79), suggesting specific hepatic complications. VRZ demonstrated strong hepatobiliary (ROR = 4.61) and ocular toxicity signals (toxic optic neuropathy: ROR = 228.80). In contrast, ISA and PSC showed lower mortality (22.70% and 19.56%, respectively) and delayed AE onset (median TTO: 19.5 and 13 days). These findings underscore the need for agent-specific risk stratification, such as prioritizing ISA in patients with renal impairment and avoiding VRZ in those with pre-existing hepatic dysfunction.
The divergent safety outcomes likely stem from differences in pharmacological mechanisms and toxicity pathways. The pronounced nephrotoxicity associated with AMB can be attributed to its cationic polyene structure, which preferentially binds to renal tubular cell membrane cholesterol. This interaction disrupts membrane integrity, leading to increased permeability and subsequent apoptotic cell death (Tiphine et al., 1999; Sabra and Branch, 1990), consistent with its high renal tubular disorder signals (ROR = 46.46). VRZ’s hepatic metabolism via cytochrome P450 isoforms may explain its hepatobiliary risks (Dolton and McLachlan, 2014), while its retinal affinity aligns with ocular toxicity. ISA’s delayed TTO and favorable profile may relate to its balanced tissue distribution and lower drug-drug interaction potential (Ellsworth and Ostrosky-Zeichner, 2020). CAS’s hepatic signals could reflect off-target effects on hepatic transporters or immune-mediated cholestasis (Kartsonis et al., 2003). These mechanistic inferences align with preclinical studies but warrant further pharmacokinetic validation.
Comparison with existing literature and clinical implications
4.2
Our results corroborate prior real-world analyses. AMB’s nephrotoxicity and high mortality mirror findings from cohort studies (Cadena et al., 2016), while VRZ’s hepatotoxicity and visual disturbances are well-documented in clinical trials (Boyer et al., 2023). Notably, ISA’s lower AE severity aligns with the SECURE trial, which reported fewer hepatobiliary events compared to VRZ (Maertens et al., 2016). However, CAS’s hepatotoxicity contrasts with its perceived safety in guidelines, suggesting underrecognized risks in post-marketing settings. Discrepancies may arise from differences in study design (e.g., spontaneous reporting vs. controlled trials) or population characteristics, emphasizing the complementary role of pharmacovigilance data.
Clinically, these findings advocate for personalized antifungal selection. ISA and PSC may be prioritized in patients with renal impairment or high comorbidity burdens, whereas VRZ requires vigilant hepatic and ocular monitoring. AMB should be reserved for refractory cases due to its toxicity burden. Regulatory authorities should consider label updates for CAS to reflect hepatotoxicity risks, and clinicians should remain alert to unlabeled AEs, such as AMB-associated disseminated intravascular coagulation (DIC; ROR = 8.49) and CAS-linked hemophagocytic lymphohistiocytosis (HLH; ROR = 13.13).
These signals, though not listed in official prescribing information, carry significant clinical implications. For instance, DIC, a life-threatening coagulopathy, may arise from AMB’s direct endothelial toxicity or immune-mediated platelet activation (Cutaia et al., 1993). Similarly, CAS-induced HLH—a hyperinflammatory syndrome—could stem from dysregulated immune responses triggered by β-glucan exposure (Walker and Munro, 2020; Wagner et al., 2023). These unlabeled AEs require close clinical monitoring. Patients receiving AMB should undergo routine coagulation monitoring (e.g., D-dimer, platelet counts), particularly in prolonged therapy or high-dose regimens. For CAS, unexplained cytopenias or febrile syndromes should prompt evaluation for HLH, including ferritin and soluble IL-2 receptor levels. Such proactive measures could mitigate severe outcomes, as delayed recognition of these AEs may exacerbate morbidity or mortality. Regulatory agencies should prioritize reviewing these signals to update drug labels, ensuring clinicians are informed of potential risks.
Limitations and future directions
4.3
This study has several limitations inherent to the analysis of spontaneous reporting system data. First, reports in the FAERS database are subject to reporting biases, under-reporting, and confounding by indication or concomitant medications. Second, disproportionality analyses identify statistical associations but cannot establish causality. Therefore, the observed adverse outcomes may not be directly attributable solely to the antifungal agents, as confounding by the underlying severe illness or concomitant medications cannot be ruled out. Third, the FAERS data contain inconsistent or missing dosage information, precluding a robust assessment of dose-response relationships, which is crucial for understanding toxicity thresholds. Fourth, due to the spontaneous reporting nature, data on the persistence or reversibility of AEs following drug withdrawal are scarce and unsystematic, limiting insights into long-term safety outcomes.
Future studies should prioritize prospective cohorts with detailed dosing, therapeutic drug monitoring, and structured follow-up data to validate these safety signals and establish causality. Additionally, pharmacokinetic and pharmacodynamic studies are warranted to elucidate the mechanisms behind unlabeled AEs (e.g., CAS-associated hemophagocytic lymphohistiocytosis). Moreover, integrating real-world evidence from electronic health records, which provide more comprehensive patient context and treatment courses, could complement spontaneous reporting data and yield a more holistic safety profile.
Conclusion
5
In summary, this large-scale pharmacovigilance analysis highlights critical safety variations among IA antifungals, with AMB and CAS posing higher risks of severe organ toxicity and mortality. ISA and PSC emerge as safer alternatives, particularly in vulnerable populations. These findings reinforce the importance of post-marketing surveillance and risk-adapted treatment strategies to optimize IA management. Prospective studies focusing on unlabeled AEs (e.g., CAS-associated hemophagocytic lymphohistiocytosis) are needed to validate causality and inform guideline updates.
The reference list from the paper itself. Each links out to its DOI / PubMed record.
- 1Boyer J. Feys S. Zsifkovits I. Hoenigl M. Egger M. (2023). Treatment of invasive aspergillosis: how it's going, where it's heading. Mycopathologia 188 (5), 667–681. 10.1007/s 11046-023-00727-z 37100963 PMC 10132806 · doi ↗ · pubmed ↗
- 2Cadena J. Thompson G. R. Patterson T. F. (2016). Invasive aspergillosis: current strategies for diagnosis and management. Infect. Dis. Clin. North Am. 30 (1), 125–142. 10.1016/j.idc.2015.10.015 26897064 · doi ↗ · pubmed ↗
- 3Cutaia M. Bullard S. R. Rudio K. Rounds S. (1993). Characteristics of amphotericin B-induced endothelial cell injury. J. Lab. Clin. Med. 121 (2), 244–256. 8381844 · pubmed ↗
- 4Dolton M. J. Mc Lachlan A. J. (2014). Voriconazole pharmacokinetics and exposure-response relationships: assessing the links between exposure, efficacy and toxicity. Int. J. Antimicrob. Agents 44 (3), 183–193. 10.1016/j.ijantimicag.2014.05.019 25106074 · doi ↗ · pubmed ↗
- 5Ellsworth M. Ostrosky-Zeichner L. (2020). Isavuconazole: mechanism of action, clinical efficacy, and resistance. J. Fungi (Basel) 6 (4), 324. 10.3390/jof 6040324 33260353 PMC 7712939 · doi ↗ · pubmed ↗
- 6Food and Drug Administration (2024). FDA regional implementation guide for E 2b(R 3) electronic transmission of individual case safety reports for drug and biological products: guidance for industry. Silver Spring, MD: ICH.
- 7Karthaus M. Buchheidt D. (2013). Invasive aspergillosis: new insights into disease, diagnostic and treatment. Curr. Pharm. Des. 19, 3569–3594. 10.2174/13816128113199990330 23278538 · doi ↗ · pubmed ↗
- 8Kartsonis N. A. Nielsen J. Douglas C. M. (2003). Caspofungin: the first in a new class of antifungal agents. Drug Resist Updat 6 (4), 197–218. 10.1016/s 1368-7646(03)00064-5 12962685 · doi ↗ · pubmed ↗