Real-world outcomes of reduced-dose versus standard-dose antibody drug conjugates in metastatic breast cancer: a retrospective cohort study
Nickolas Stabellini, Jasskiran Kaur, Cynthia Owusu, Bahar Moftakhar, Takae Mizukami, Sonia D. de Oliveira, Alberto J. Montero

TL;DR
This study found that lower doses of two antibody drug conjugates used to treat metastatic breast cancer had similar outcomes to standard doses in real-world patients.
Contribution
The study provides real-world evidence that reduced doses of SG and T-DXd may be as effective as standard doses in metastatic breast cancer.
Findings
Reduced-dose SG showed similar progression-free and overall survival to standard-dose SG.
Reduced-dose T-DXd had comparable or better survival outcomes than standard-dose T-DXd.
Overall response rates were similar between reduced and standard doses for both drugs.
Abstract
To evaluate whether reduced doses (RD) of trastuzumab deruxtecan (T-DXd) or sacituzumab govitecan (SG) provide similar outcomes to the approved standard doses (SD) in metastatic breast cancer (mBC). This retrospective cohort included mBC patients receiving at least one cycle of SG (April 2021–May 2024) or T-DXd (February 2020–December 2024). Primary outcomes were progression-free survival (PFS) and overall survival (OS). Kaplan–Meier curves and Log-Rank tests estimated and compared PFS and OS from treatment initiation. Subgroup analyses were performed by HER2 and hormone receptor status. 48 patients received SG (24 RD vs. 24 SD) and 66 received T-DXd (29 RD vs. 37 SD). Median PFS for SG was 3 months in both SD (95% CI, 2–10) and RD (95% CI, 2–8; p = 0.8). Median OS for SG was 10 months (95% CI, 7–13) for SD and 11 months (95% CI, 5–30; p = 0.4) for RD. For T-DXd, median PFS was 10.4…
Genes, proteins, chemicals, diseases, species, mutations and cell lines named across the full text — each resolved to its canonical identifier and authoritative record.
Click any figure to enlarge with its caption.
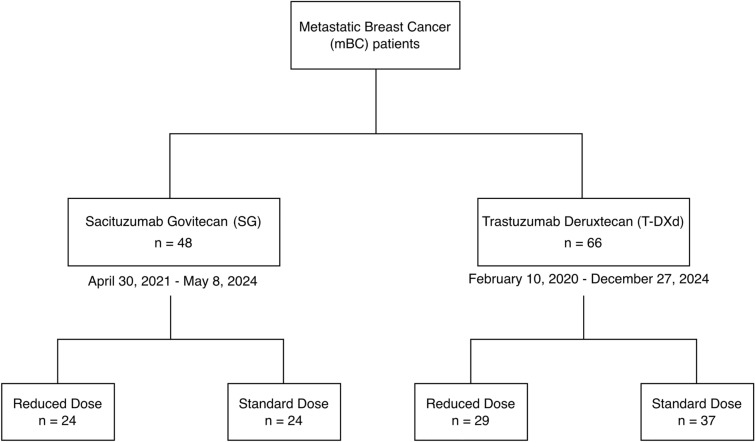 Figure 1
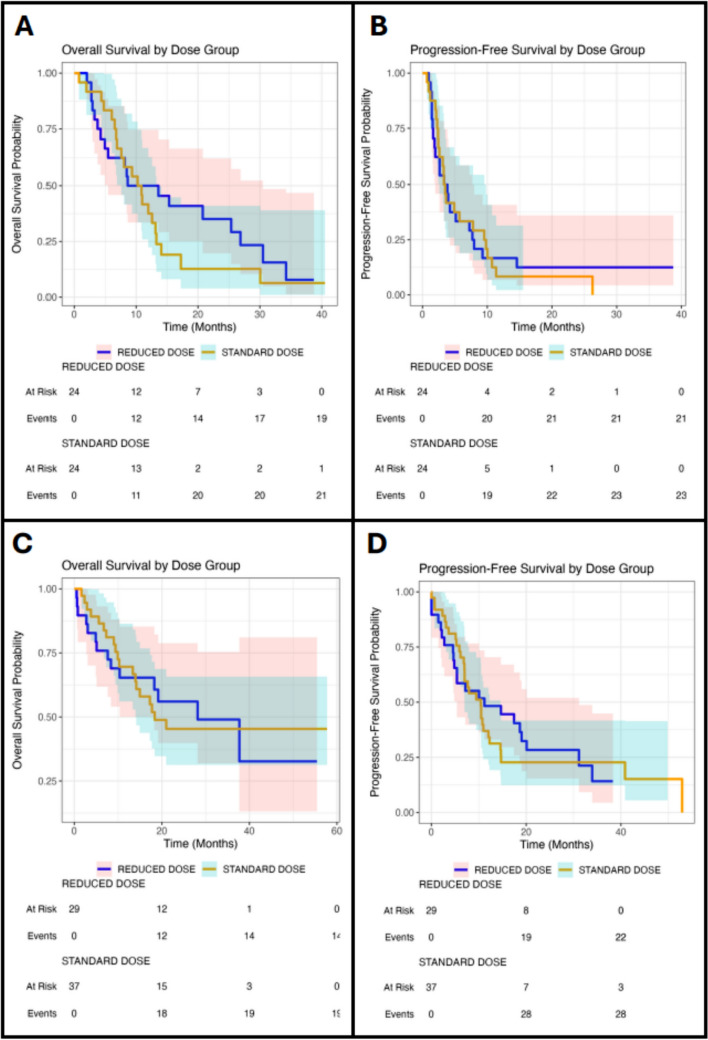 Figure 2
Peer Reviews
No public reviews on file for this paper yet. If you reviewed it on a platform where reviews are public (OpenReview, ICLR, NeurIPS, ICML), you can paste yours below so the community can read it here.
Videos
No videos yet. Explain this paper in a talk, walkthrough, or lecture? Add one.
Taxonomy
TopicsHER2/EGFR in Cancer Research · Advanced Breast Cancer Therapies · Breast Cancer Treatment Studies
Introduction
Breast cancer remains one of the most prevalent cancers with an estimated 316,950 new cases in the United States (U.S.) alone expected in 2025 [1]. Metastatic breast cancer (mBC) remains incurable; however, the development of novel therapies such as antibody–drug conjugates (ADC) have transformed the treatment of mBC [2, 3]. ADCs are targeted treatments which combine a monoclonal antibody (mAb), and a cytotoxic chemotherapy agent via a linker to enable selective delivery of potent cytotoxic payload to target cancer cells [4]. As of June 2025, 19 ADCs have been approved globally for the treatment of various cancer types, including trastuzumab deruxtecan (T-DXd) and sacituzumab govitecan (SG) for treatment of advanced breast cancer patients [5–7]. T-DXd is a human epidermal growth factor 2 (HER2) directed antibody–drug conjugate currently approved for HER2 + and HER2 low or ultralow breast cancer [5]. In addition to breast cancer, T-DXd is also approved for HER2-mutant non-small-cell lung cancer, HER2-positive gastric or gastroesophageal junction adenocarcinoma, and any unresectable or metastatic HER2-positive (IHC 3 +) solid tumors [8–10]. SG is a Trop-2–directed ADC approved for unresectable, locally advanced or metastatic triple-negative breast cancer (TNBC) following ≥ 2 prior systemic therapies and pretreated hormone receptor (HR) + / HER2- mBC refractory to endocrine-based therapy [6]. Compared to physicians’ choice chemotherapy, T-DXd and SG significantly prolonged both progression-free survival and overall survival in phase III clinical trials [5, 6].
Cancer drug dosing has traditionally been based on the maximum tolerated dose (MTD) identified in phase 1 trials, which then in turn becomes the recommended phase II dose (RP2D) [11–13]. This method of dose determination operates on the assumption that toxicity can serve as a surrogate for cytotoxic drug efficacy [11–13]. While chemotherapy dose intensity may lead to improved outcomes in the non-metastatic setting, several trials have consistently demonstrated in mBC that dose intensity is not associated with improved survival outcomes [14]. For example, in a randomized trial evaluating three different doses of docetaxel no survival advantage was observed for 100 mg/m^2^ vs 60 mg/m^2^ of docetaxel, but greater dose intensity was associated with increased toxicities [15]. More recently, the well-designed and pragmatic X-7/7 trial demonstrated that there was no advantage to the higher Federal Drug Administration (FDA) approved dose of capecitabine in mBC, and that a lower fixed dose given on a novel one week on one week off schedule had similar efficacy with much less toxicity [16]. Interestingly, real-world retrospective data with fixed dose capecitabine had indicated that reducing dose intensity would not reduce the clinical activity of capecitabine in advance of the randomized prospective trial [17].
While the efficacy and safety of ADC has been well-studied in controlled trials, these studies lack data on multiple dose levels hindering our analyses of long‐term clinical safety, efficacy, and real-world applications [18]. Theoretically, ADCs with their targeted delivery of chemotherapy as a drug class should have a more favorable therapeutic index than conventional cytotoxic chemotherapy [4]. However, rare but clinically significant, toxicities such as interstitial lung disease/pneumonitis and heart failure exist [19–22]. Toxicities significantly impact patient quality of life (QoL) and desire to continue with treatment [23, 24]. Given that lower doses of both docetaxel and capecitabine in mBC have shown similar efficacy with significantly less toxicity compared to higher doses, it is reasonable to expect that the same would apply to ADCs [25, 26]. We hypothesized that slightly lower doses of T-DXd and SG may offer comparable efficacy and less toxicity in treating mBC than the FDA-approved dose. Given the absence of prospective randomized trials that address the impact of either T-DXd or SD dose reduction on clinical outcomes in mBC real-world data are needed. Our study aimed to retrospectively address this knowledge gap.
Methods
Study setting
The study setting was University Hospitals Seidman Cancer Center (UHSCC), a large hybrid tertiary academic-community practice located in Northeast Ohio, U.S. The institution serves urban, suburban, and rural areas and comprises an integrated network of more than 23 hospitals, more than 50 health centers and outpatient facilities, and more than 200 physician offices across 16 counties throughout the region [27–29].
Data source and covariates
De-identified real-world data were manually extracted from electronic health records (EHRs). The covariates captured included age, age at diagnosis, race, TNM stage at diagnosis, date of diagnosis, date of metastatic diagnosis, days from diagnosis to metastatic recurrence, number of different sites of disease, metastasis location, chemotherapy, metastasis at baseline, metastatic lines of therapy, T-DXd initial dose, T-DXd start date, T-DXd last dose date, SG initial dose, SG start date, SG last dose date, reason for dose reduction, subsequent dose reductions, number of treatments (total number of times the drug was administered from start to last recorded), date of progression, toxicities, hospitalizations from toxicity, treatment response, hormone receptor status, BRCA mutation, vital status, last follow-up date, date of death, and cause of death.
Study design and population
This retrospective cohort study (Fig. 1) included mBC patients who received at least one cycle of SG between April 30, 2021 and May 8, 2024, and mBC patients who received at least one cycle of T-DXd between February 10, 2020 and December 27, 2024. Patients were included if they had received at least one cycle of treatment to minimize selection bias, as excluding those who discontinued therapy after one or two cycles due to treatment-related toxicities could artificially improve the apparent clinical outcomes.Fig. 1. Study design and cohort distribution
Outcomes
The primary outcomes were real-world progression-free survival (PFS) and overall survival (OS), and the secondary outcome was overall response rate (ORR).
Statistical analysis
Categorical covariates were summarized using absolute numbers and percentages and statistically compared using the Pearson’s Chi-squared (χ^2^). Continuous covariates had their distribution assessed using histograms and the Kolmogorov–Smirnov test. If normally distributed, continuous covariates were summarized using mean and standard deviation and compared using the t-test. If non-normally distributed, continuous covariates were summarized using median and quartiles and compared using the Kruskal–Wallis test. Statistical comparisons considered patients receiving a reduced dose (RD) versus those receiving a standard-dose (SD) regimen.
The ORR was defined as the proportion of patients who achieved either a complete or partial response. ORR was calculated for each dose regimen and compared using χ^2^ test.
Kaplan–Meier methodology was used to estimate real-world PFS and OS from the date of treatment (SG or T-DXd) initiation, overall and by dose regimen. The log-rank test was applied to compare PFS and OS according to dose regimen. Subgroup analyses for the Kaplan–Meier and log-rank test were performed for SG in TNBC, ER + , and ER + /HER2-low patients, and for T-DXd in TNBC, HER2 + /ER-, HER2 + /ER + , and HER2-/ER + patients.
A p-value < 0.05 was considered statistically significant.
Software
All analyses were performed in R (version 4.4.3) [30, 31].
Results
Sacituzumab govitecan (SG) cohort
Our study included 48 mBC patients who received SG (Table 1). The median age of these patients at SG initiation was 63 years (IQR 50–70), with a median age at initial breast cancer diagnosis of 54 years (IQR 42–64). Patients were followed for a median of 65 months (IQR 33.6–123.5) from their initial breast cancer diagnosis, 28.6 months (IQR 13.4–68.68) from the mBC diagnosis, and 10.5 months (IQR 5.33–15.38) from the start of first SG treatment.Table 1. Demographic characteristics of the overall cohort and stratified by standard versus reduced dose regimens for the sacituzumab govitecan (SG) cohortCharacteristicOverallReduced DoseStandard Dosep-valuen = 48n = 24 (50%)n = 24 (50%)Age in years—median (IQR)64 (50–70)65 (60–72)61 (39–66)0.08Age at diagnosis in years—median (IQR)54 (41.7–63.2)56 (50–64)49 (38–60)0.06Race—n (%)Black14 (29.2)6 (25)8 (33)0.72White31 (64.6)16 (67)15 (63)Hispanic2 (4.2)1 (4.2)1 (4.2)Asian1 (2.1)1 (4.2)0Stage at Initial Diagnosis—n (%)I-II22 (45.8)14 (58)8 (33)0.03III19 (39.6)5 (21)14 (58)IV7 (14.6)5 (21)2 (8.3)HER2 IHC—n (%)019 (39.6)10 (42)9 (38)0.81114 (29.2)6 (25)8 (33)215 (31.2)8 (33)7 (29)ER +—n (%)14 (29.2)9 (37.5)5 (21)0.34TNBC—n (%)34 (70.8)15 (62.5)19 (79.2)0.34BRCA 1/2 mutated—n (%)1 (2.1)01 (4.2)-Prior neo/adjuvant chemo—n (%)22 (45.8)18 (75)4 (17) < 0.001Prior KN-522 regimen—n (%)11 (22.9)011 (46) < 0.001Prior anthracyclines/taxanes (no pembro)—n (%)23 (47.9)14 (58)9 (38)0.24Prior Taxanes Only—n (%)4 (8.3)4 (17)00.11Prior Lines Therapy in Metastatic Setting—median (IQR)2 (1–4)3 (2–4)1 (0–2)0.002For ER + , prior CDK4/6—n (%)14 (29.2)9 (38)5 (21)0.34Prior PD-1 mAB in metastatic setting—n (%)21 (43.8)12 (50)9 (38)0.56Prior TDxD—n (%)4 (8.3)3 (12.5)1 (4.2)0.60Visceral mets at Baseline—n (%)40 (83.3)21 (87.5)19 (79)0.69Number of different sites of disease, median (IQR)3 (2–3)3 (3–3)3 (2–4)0.7Brain Mets—n (%)11 (22.9)5 (21)6 (25)1Number of treatments – median (IQR)9.5 (6–26)10 (6–23)9.5 (7–22)0.92
The cohort was predominantly White (64.6%). Most patients were initially diagnosed at TNM stages I or II (45.8%), and the majority (70.8%) had TNBC.
Trastuzumab deruxtecan (T-DXd) cohort
We analyzed data from 66 mBC patients who received T-DXd (Table 2). Their median age at time of receiving T-DXd was 67 years (IQR 62.0 to 74.7), with a median age at diagnosis of 57.5 years (IQR 47.0 to 64.0). The median follow-up was 111 months (IQR 65.2 to 174.2) from initial breast cancer diagnosis, 62.7 months (IQR 30.1–104.2) from the mBC diagnosis, and 16.8 months (IQR 8.8–26.5 months) from initial T-DXd.Table 2. Demographic characteristics of the overall cohort and stratified by standard versus reduced dose regimens for the trastuzumab deruxtecan (T-DXd) cohortCharacteristicOverallStandard doseReduced dosep-valuen = 66n = 37n = 29Age in years—median (IQR)67 (62.0–74.7)67.0 (57.0–73.0)69.0 (65.0–79.0)0.04Age at diagnosis in years—median (IQR)57.5 (47.0–64.0)52.0 (43.0–64.0)60.0 (54.0–67.0)0.07Race—n (%)Black17 (25.8)9 (24.3)8 (27.6)0.93White47 (71.2)27 (73.0)20 (69.0)Hispanic000Asian000Other2 (3.0)1 (2.7)1 (3.4)Stage at Initial Diagnosis—n (%)I-II19 (34.5)12 (38.7)7 (29.2)0.74III12 (21.8)6 (19.4)6 (25.0)IV24 (43.6)13 (41.9)11 (45.8)HER2 +—n (%)27 (40.9)16 (43.2)11 (37.9)0.85ER +—n (%)47 (71.2)24 (64.9)23 (79.3)0.31HER2 + /ER-10 (15.1)7 (18.9)3 (10.3)0.49HER2 + /ER + 17 (25.7)9 (24.3)8 (27.5)0.78HER2 low/ER + 30 (45.4)15 (40.5)15 (51.7)0.45TNBC—n (%)7 (10.6)5 (13.5)2 (6.9)0.64BRCA 1/2 mutated—n (%)2 (3)02 (6.9)-No prior neo/adjuvant chemo—n (%)9 (13.6)6 (16.2)3 (10.3)0.78Visceral mets at Baseline—n (%)49 (74.2)26 (70.2)23 (79.3)0.71Number of different sites of disease, median (IQR)3.0 (2.0–4.0)3.0 (2.0–4.0)3.0 (2.0–3.0)0.10Brain Mets—n (%)18 (27.7)14 (37.8)4 (13.8)0.05Pneumonitis—n (%)3 (4.5)3 (8.1)0-Number of treatments – median (IQR)11 (6–26)14 (4–36)11 (8–16)0.54
The majority of patients were White (71.2%). Most (43.6%) were diagnosed at TNM stage IV, and the cohort was predominantly ER + (71.2%), with 40.9% being diagnosed with HER2 + disease.
Treatment regimen and characteristics
In the SG cohort (Table 1), 45.8% of patients had received prior neo/adjuvant chemotherapy, 22.9% had the KN-522 regimen, and 47.9% had prior anthracyclines/taxanes [32]. In addition, 44% had prior PD-1 mAb in the metastatic setting.
Of the 48 SG patients, 24 (50%) received an initial RD of SG at 8 mg/kg; the other 50% received an initial SD of SG at 10 mg/kg. Two patients (1 RD, 1 SD) received only one cycle of treatment (two administrations). The median time on SG was 3.5 months (IQR 1.5–7.2) for RD and 3.3 months (IQR 2.3–8.1) for SD (p = 0.42). When comparing these two groups (Table 1), the RD group had a higher rate of TNM stage IV at diagnosis (21% vs. 8.3%, p = 0.03). Patients who received the SD SG were more likely to have received prior neo/adjuvant chemotherapy (75% vs. 17%, p < 0.001). Among TNBC patients, those who received SD SG were less likely to have KN-522 regimen (0% vs. 46%, p < 0.001). Furthermore, the RD group had a higher median of prior lines of therapy in the metastatic setting (3 [IQR 2–4] vs 1 [IQR 0–2], p = 0.002). From cycle 1 day 8 onward, subsequent dose reductions occurred in 9 of 24 RD patients (37.5%) and 13 of 24 SD patients (54.2%), while the remaining patients in each group maintained their initial dose. The difference in dose reduction rates between groups was not statistically significant (p = 0.38). Myeloid growth factor use was significantly higher in patients receiving an initial SD of SG (58% vs. 0; p < 0.01). Moreover, we also observed that SD patients had higher rates of hospitalization due to SG toxicity compared to RD (20.8% vs. 4.3%, p = 0.20).
For the T-DXd cohort (Table 2), 13.6% of patients had no prior neo/adjuvant chemotherapy. Of the 66 T-DXd patients, 29 (43.9%) received an initial RD at 4.4 mg/kg. Compared to the SD group (Table 2), those started on the RD of T-DXd were older (median age of 69 years [IQR 65.0–79.0] vs. 67 years [IQR 57.0–73.0], p = 0.04). The median time on T-DXd was 9.8 months (IQR 2.0–18.8) for RD and 7.8 months (IQR 4.5–13.2) for SD (p = 0.88). Nine patients (4 RD, 5 SD) received only 1–2 cycles of treatment. From cycle 2 onward, subsequent dose reductions occurred in none of the RD patients and 5 of 37 SD patients (13.5%), while the remaining patients in each group maintained their initial dose. The difference in dose reduction rates between groups was not statistically significant (p = 0.11).
No dose escalations were observed among patients who initiated treatment at RD of SG or T-DXd. Among patients who started at SD and subsequently required dose reductions, treatment was continued at the RD level, with no attempts at dose re-escalation.
Survival
At the last follow-up, 16.7% of SG patients were alive. The median PFS from the time of SG initiation was 3 months for both SD (95% CI, 2–10) and RD (95% CI, 2–8, showing no statistical difference between the two doses (p = 0.8; Fig. 2). Similarly, the median survival (Table 3) did not significantly differ between SD (10 months; 95% CI 7–13) and RD (11 months; 95% CI 5–30; p = 0.4; Fig. 2) groups. From initial breast cancer diagnosis, the median survival was 68 months (95% CI 49–123), and 29 months (95% CI 19–68) from the date of initial mBC diagnosis. The 12-month and 24-month survival rates for the overall SG cohort and by dose regimen are shown in Table 4.Fig. 2. Kaplan–Meier curves for real-world overall survival (OS) and progression-free survival (PFS) comparing standard-dose (yellow) and reduced dose (blue) treatments: A OS for sacituzumab govitecan, B PFS for sacituzumab govitecan, C OS for trastuzumab deruxtecan, and D PFS for trastuzumab deruxtecanTable 3Median real-world progression-free survival (PFS) and median real-world survival from treatment initiation for the overall cohort, stratified by dose regimen across treatment cohorts and subgroups of interestOverallStandard doseReduced dosep-valueSGn = 48n = 24n = 24Median PFS (95% CI)3.4 (2.6–5.7)3.4 (2.6–9.5)3.5 (1.9–7.7)0.9Median Survival (95% CI)10.6 (8.0–14.1)10.6 (7.6–13.3)11.1 (5.4–30.5)0.4TNBC (n = 34)Median PFS (95% CI)3.2 (2.6–7.8)3.2 (2.4–9.8)3.9 (2.6-NA)0.1Median Survival (95% CI)11.5 (8.6–25.4)10.9 (8.0–17.2)25.4 (8.4-NA)0.2ER + (n = 14)Median PFS (95% CI)3.5 (1.6–10.7)5.7 (4.9-NA)1.6 (1.4-NA)0.09Median Survival (95% CI)6.4 (4.3-NA)6.7 (6.0-NA)4.9 (3.7-NA)0.8ER + /HER2 low (n = 14)Median PFS (95% CI)3.5 (1.6–10.7)5.7 (4.9-NA)1.6 (1.4-NA)0.09Median Survival (95% CI)6.4 (4.3-NA)6.7 (6.0-NA)4.9 (3.7-NA)0.8T-DXdn = 66n = 37n = 29Median PFS (95% CI)10.4 (7.0–14.6)10.4 (7.0–14.5)11.2 (5.4–31.1)0.8Median Survival (95% CI)21 (14.9-NA)18.4 (14.0-NA)28.2 (18.3-NA)1TNBC (n = 7)Median PFS (95% CI)5.9 (2.8-NA)5.9 (2.8-NA)12.0 (5.4-NA)0.5Median Survival (95% CI)9.9 (6.7-NA)9.9 (6.7-NA)-0.1ER + (n = 47)Median PFS (95% CI)10.4 (7.0–17.4)9.9 (7.0–14.7)11.2 (4.6-NA)0.9Median Survival (95% CI)21.0 (14.9-NA)NA (14.1-NA)19.2 (8.3-NA)0.5HER2 + (n = 27)Median PFS (95% CI)14.7 (9.4-NA)11.5 (7.0-NA)20.1 (7.1-NA)0.5Median Survival (95% CI)37.7 (18.3-NA)NA (17.3-NA)28.2 (18.3-NA)0.4HER2 low/ER + (n = 30)Median PFS (95% CI)7.8 (5.2–12.3)7.6 (6.1–12.3)10.0 (2.2-NA)0.5Median Survival (95% CI)14.2 (9.0-NA)14.2 (9.4-NA)19.2 (4.9-NA)0.9HER2 + /ER- (n = 10)Median PFS (95% CI)11.5 (5.1-NA)10.9 (5.1-NA)NA (2-NA)0.5Median Survival (95% CI)NA (10.3-NA)NA (10.2-NA)NA (3.0-NA)0.94HER2 + /ER- (n = 17)Median PFS (95% CI)14.7 (9.4-NA)14.7 (9.4-NA)17.3 (7.1-NA)0.69Median Survival (95% CI)NA (37.7-NA)NA (NA-NA)37.7 (18.2-NA)0.11Table 412- and 24-month survival rates from treatment initiation for the overall cohort, stratified by dose regimen across treatment cohorts and subgroups of interestSurvival rate, % (95% CI)OverallStandard doseReduced doseSGn = 48n = 24n = 2412-month43.7 (31.6–60.2)37.5 (22.3–62.8)50.0 (33.5–74.6)24-month24 (14.0–41.1)12.7 (3.9–40.9)35.1 (19.8–62.20TNBC (n = 34)12-month46.9 (32.7–67.1)36.8 (20.4–66.4)60.0 (39.7–90.7)24-month29.9 (17.5–51.2)12.6 (3.5–44.5)52.5 (32.3–85.6)ER + (n = 14)12-month35.7 (17.7–72.1)40 (13.7–100.0)33.3 (13.2–84.0)24-month–––ER + /HER2 low (n = 29)12-month35.7 (17.7–72.1)40 (13.7–100.0)33.3 (13.2–84.0)24-month–––T-DXdn = 66n = 37n = 2912-month67.8 (57.3–80.2)69.5 (56.0–86.3)65.3 (50.0–85.2)24-month49.6 (38.3–64.2)45.3 (31.2–65.7)56.0 (39.8–78.7)TNBC (n = 7)12-month47.6 (18.8–100.0)30.0 (6.3–100.0)100.0 (100.0–100.0)24-month–––ER + (n = 47)12-month70.0 (58.0–84.5)78.7 (63.8–97.1)60.9 (43.9–84.5)24-month49.5 (36.4–67.3)50.9 (33.6–77.1)48.7 (31.0–76.4)HER2 + or PR + (n = 48)12-month68.5 (56.6–83.1)75.4 (60.1–94.6)60.9 (43.9–84.5)24-month48.4 (35.5–66.1)48.7 (31.9–74.5)48.7 (31.0–76.4)HER2 + (n = 27)12-month77.4 (63.1–95.1)80.8 (63.4–100.0)72.7 (50.6–100.0)24-month65.2 (49.1–86.5)67.3 (47.4–95.6)62.3 (38.9–99.9)HER2 low/ER + (n = 30)12-month60.0 (44.8–80.4)66.7 (46.6–95.3)53.3 (33.2–85.6)24-month34.4 (20.0–59.2)29.2 (12.3–69.0)42.7 (22.4–81.3)HER2 + /ER- (n = 10)12-month70.0 (46.7–100.0)71.4 (44.7–100.0)66.7 (30.0–100.0)24-month60.0 (36.2–99.5)57.1 (30.1–100.0)66.7 (30.0–100.0)HER2 + /ER + (n = 17)12-month87.8 (73.4–100.0)100.0 (0–100.0)75 (50.3–100.0)24-month74.3 (55.4–99.7)87.5 (11.7–67.3)60 (33.1–100.0)
Among TNBC patients treated with SG, the median PFS was 3.4 months (95% CI, 2.6–7.8) and the median OS was 11.5 months (95% CI, 8.6–25.4), with no statistically significant differences between RD and SD for either outcome (PFS p = 0.10; OS p = 0.20; Table 3). Similarly, in ER + /HER2 − mBC patients, the median PFS was 3.5 months (95% CI, 1.6–10.7) and the median OS was 6.42 months (95% CI, 4.3–NA), with no statistically significant differences between RD and SD (PFS p = 0.09; OS p = 0.80; Table 3).
At last follow-up, 50% of T-DXd patients were alive. The median PFS from the time of T-DXd initiation was 10.4 months for SD (95% CI 7.0–14.5) and 11.2 months for RD (95% CI 5.4–31.1), indicating no statistically observable significant difference between both dosing regimens (p = 0.8; Fig. 2). Similarly, the median OS was not statistically different between SD (18.3 months; 95% CI 13.9–NA) and RD (28.1 months; 95% CI 18.2–NA; p = 0.9; Fig. 2) groups. The overall median OS from the time of initial T-DXd initiation was 21 months (95% CI 14.9–15). The 12-month and 24-month survival rates for the overall T-DXd cohort and by dose regimen are shown in Table 4.
For HER2 + mBC patients, the median PFS from date of T-DXd initiation was 14.6 months (95% CI 9.4-NA), without any observable statistically significant differences between RD and SD (p = 0.5; Table 3). The median OS from date of T-DXd initiation was 37.7 months (95% CI 18.2-NA). For ER + /HER2- mBC patients, the overall median PFS was 7.8 months (95% CI 5.2- 12.2), without any significant statistical differences observed between RD and SD (p = 0.5; Table 3), while the median OS for TDxD was 14.1 months (95% CI 9.0-NA). For HER2 + /ER- mBC patients, the median PFS was 11.5 months (95% CI: 5.1–NA) and the 24-month survival rate was 60.0% (95% CI: 36.2–99.5). For HER2 + /ER + mBC patients, the median PFS was 14.7 months (95% CI: 9.4–NA) with a 12-month survival rate of 87.8% (95% CI: 73.4–100.0). In all these subgroups, no statistically significant differences were observed between RD and SD for either PFS or OS (Table 3).
Real-world response rates
The real-world overall response rate (rwORR) for the entire SG cohort was 20.8%. RD SG had a rwORR of 25%, compared to 16.7% for SD SG (p = 0.72). For specific subtypes, the rwORR among TNBC patients was 23.5% (33.3% RD vs. 15.8% SD, p = 0.42) and 14.3% (11.1% RD vs. 20% SD, p = 1.00) in patients with ER + /HER2- mBC.
The observed rwORR for the entire T-DXd cohort was 16.7% (24.1% RD vs. 10.8% SD, p = 0.26). For patients with HER2 + mBC the observed rwORR was 18.5% (18.8% SD vs. 18.2% RD, p = 1.00). For ER + /HER2- mBC the rwORR was 15.6% (6.2% SD vs. 25% RD, p = 0.32).
Discussion
This retrospective cohort study aimed to explore the impact of RD T-DXd or SG, two FDA-approved ADCs for the treatment of mBC. We hypothesized that RD SG and T-DXd would have comparable real-world outcomes to SD in mBC, based on prior randomized trials with cytotoxic chemotherapy showing similar clinical outcomes with lower-dose intensity. We analyzed two cohorts: 48 patients treated with SG (24 RD, 24 SD) and 66 patients treated with T-DXd (29 RD, 37 SD). Our results did not find any statistically significant differences in real-world OS, PFS, or rwORR when comparing RD and SD, either overall or by HER2 and hormone receptor status. Moreover, RD of SG was associated with lower rates of hospitalization and growth factor use.
The goal of systemic therapy in metastatic cancer is not is not to administer the highest dose by default, but rather the most effective dose that will be best tolerated by patients, maximizing their chances of successful treatment, while at the same time preserving QoL and minimizing harm [33, 34]. This aligns with the FDA’s Project Optimus, which aims to develop strategies for dose-finding and optimization by leveraging both nonclinical and clinical data, including randomized evaluations of multiple dose levels in clinical trials [35]. The randomized phase 3 E1193 trial compared doxorubicin, paclitaxel, or combination doxorubicin and paclitaxel plus granulocyte colony-stimulating factor as first-line therapy [36]. Patients receiving single-agent doxorubicin or paclitaxel were crossed over to the other agent at time of progression [36]. This well-designed trial demonstrated while the combination of doxorubicin and paclitaxel was associated with higher ORR and time to treatment failure compared to each drug alone, combination therapy did not improve either survival or QoL compared to sequential single-agent therapy [36]. Just as polychemotherapy does not necessarily translate to better outcomes in mBC, the dose intensification of single agent chemotherapy may not translate to better clinical outcomes.
In the current era of ADCs and targeted delivery of chemotherapy, the overarching therapeutic goal in mBC should be to administer drugs at doses that provide the greatest average benefit with the least potential for toxicities, thereby maximizing patient QoL [33, 34]. Dose reduction strategies for antibody–drug conjugates like SG and TDxD in mBC represent a promising approach to optimize the therapeutic index by maintaining clinical efficacy while minimizing treatment-limiting toxicities [37]. Clinical evidence suggests that these agents often require dose modifications due to adverse events such as neutropenia, diarrhea, and interstitial lung disease, which can compromise treatment adherence and QoL [19–24]. Emerging pharmacokinetic and pharmacodynamic data indicate that the steep dose–response relationship traditionally assumed for cytotoxic agents may not apply to ADCs, where the targeted delivery mechanism and prolonged tumor exposure through linker technology may allow for sustained antitumor activity at reduced doses [4, 38–42]. Furthermore, retrospective analyses and small prospective studies have suggested that reduced dose intensity of ADCs do not negatively impact PFS or ORR while at the same time reduce the potential for adverse toxicities, suggesting that a more conservative dosing approach could preserve long-term treatment options and improve patient outcomes without compromising oncologic benefit [43–47].
Our study helps to address this knowledge gap of the impact of RD intensity of ADCs in mBC which poses a challenge to clinicians who must weigh the risks and benefits of dose reduction, particularly in physiologically vulnerable adults. Our results are consistent with previous published findings which have shown similar clinical outcomes with reduced dose intensity, which may be beneficial for treatment adherence and patient QoL [37, 44–47]. Attempts to maintain ADC dose intensity, such as the PRIMED trial which maintained SG dose at 10 mg/kg by giving primary granulocyte colony-stimulating factor prophylaxis runs counter to the clinical trial literature in mBC that has shown that dose de-intensification of chemotherapy may be associated with more favorable side effect profile, and at the same time maintaining similar efficacy as higher chemotherapy doses [48, 49]. In this regard, less may indeed be more and when it comes to ADC’s, and the time has come to clinically test this approach in mBC.
Our study has several limitations. First, the single-institution, retrospective real-world design may introduce selection bias, as the findings could reflect only the patient population seen at this institution. The retrospective nature also increases the risk of missing and/or inaccurate data points. Regarding toxicities, for example, data in the EHR were not systematically graded using the standardized Common Terminology Criteria for Adverse Events criteria, and clinical documentation may vary between providers and encounters. As a result, we were unable to provide a comprehensive overview or direct comparison of toxicities between the SD and RD groups. Treatment patterns and supportive care protocols unique to this institution and its providers may have influenced outcomes, limiting generalizability. Selection bias may arise from physician-driven decisions regarding dose reduction and patient management. The inclusion periods differed between cohorts (patients receiving T-DXd were included from February 2020, while those receiving SG were included from April 2021), which could introduce temporal bias. Outcomes such as PFS and OS were derived from EHR, and thus may not align precisely with clinical trial–defined endpoints. The results are based on univariable analysis, therefore, they were not adjusted for other factors (e.g., tumor characteristics) that could influence the outcomes. Furthermore, statistical analyses were limited to unadjusted comparisons and did not account for potential confounders through multivariable modeling. Finally, the relatively small sample size may limit statistical power, particularly in subgroup analyses.
In conclusion, this retrospective cohort real-world data provides foundational evidence supporting the hypothesis that a RD of SG or T-DXd offers similar outcomes to the current SD. Given the relationship between toxicity, QoL, and treatment adherence, this evidence, corroborated by prior findings in the ADC field, supports the prospective evaluation of dose-reduced SG or T-DXd as a potential dose optimization strategy in mBC. Such an approach could have a meaningful impact on clinical practice and quality of care. Future studies should focus on employing multicentric, prospective, randomized designs, adjusted for confounders and with larger sample sizes, to validate and expand upon the findings of our study.
The part of the results of this manuscript were presented as poster at: 1. 2025 ASCO Quality Care Symposium (DOI 10.1200/OP.2025.21.10_suppl.569) 2. 2024 San Antonio Breast Cancer Symposium (DOI 10.1158/1557-3265.SABCS24-P3-12-14).
The reference list from the paper itself. Each links out to its DOI / PubMed record.
- 1Swain SM, Nishino M, Lancaster LH, Li BT, Nicholson AG, Bartholmai BJ, et al. 2022 Multidisciplinary clinical guidance on trastuzumab deruxtecan (T-D Xd)–related interstitial lung disease/pneumonitis—Focus on proactive monitoring, diagnosis, and management. Cancer Treat Rev [Internet]. [cited 2025 Aug 25];106. Available from: https://www.cancertreatmentreviews.com/article/S 0305-7372%2822%2900042-1/fulltext
- 2$name [Internet]. [cited 2025 Aug 25]. Available from: https://www.uhgiving.org/publications/annual-report
- 3R: The R Project for Statistical Computing [Internet]. [cited 2025 Aug 25]. Available from: https://www.r-project.org/
- 4Posit [Internet]. [cited 2025 Aug 25]. Posit. Available from: https://www.posit.co/
- 5Commissioner O of the. Project optimus. FDA [Internet]. 2024 Dec 6 [cited 2025 Sept 25]; Available from: https://www.fda.gov/about-fda/oncology-center-excellence/project-optimus
- 6Research C for DE and. Clinical pharmacology considerations for antibody-drug conjugates guidance for industry [Internet]. FDA; 2024 [cited 2025 Aug 26]. Available from: https://www.fda.gov/regulatory-information/search-fda-guidance-documents/clinical-pharmacology-considerations-antibody-drug-conjugates-guidance-industry
- 7Pérez-García JM, Gion M, Ruiz-Borrego M, Blancas I, López-Miranda E, Blanch S, et al. 2025 Prevention of sacituzumab govitecan-related neutropenia and diarrhea in patients with HER 2-negative advanced breast cancer (PRIMED): an open-label, single-arm, phase 2 trial. e Clinical Medicine [Internet]. [cited 2025 Sept 25];85. Available from: https://www.thelancet.com/journals/eclinm/article/PIIS 2589-5370(25)00241-X/fulltext