A diverse satellite DNA repertoire in Limnoperna fortunei: insights into genome structure and chromosomal organization
Jonathan Pena Castro, Tiago Marafiga Degrandi, Allan Oliveira Leal, Augusto Luiz Ferreira Júnior, Mara Cristina de Almeida, Roberto Ferreira Artoni

TL;DR
This study explores repetitive DNA in the invasive Golden Mussel, revealing diverse satellite DNA patterns that may contribute to its success as an invader.
Contribution
The first comprehensive characterization of satellite DNA families in Limnoperna fortunei, revealing their genomic distribution and evolutionary implications.
Findings
129 distinct satellite DNA families identified, comprising ~9.1% of the genome.
Most satellite DNA families show low divergence, suggesting recent amplification.
FISH analysis revealed contrasting chromosomal distribution patterns for two satellite DNA families.
Abstract
The Golden Mussel, Limnoperna fortunei, represents one of the most successful aquatic invaders in South America, causing significant ecological and economic impacts. Repetitive DNA sequences, particularly satellite DNAs (satDNAs), play crucial roles in genome architecture and evolution, yet the satDNA landscape of this invasive species remains largely uncharacterized. This study aimed to comprehensively analyze the satellitome of L. fortunei using integrated computational and cytogenetic approaches. We employed a read-clustering approach (RepeatExplorer2) to identify satDNA families from short-read genomic data. The identified families were then mapped onto the chromosome-level reference genome in silico to determine their chromosomal distribution. The physical localization of two representative satDNA families with contrasting distribution patterns was validated through fluorescence…
Genes, proteins, chemicals, diseases, species, mutations and cell lines named across the full text — each resolved to its canonical identifier and authoritative record.
Click any figure to enlarge with its caption.
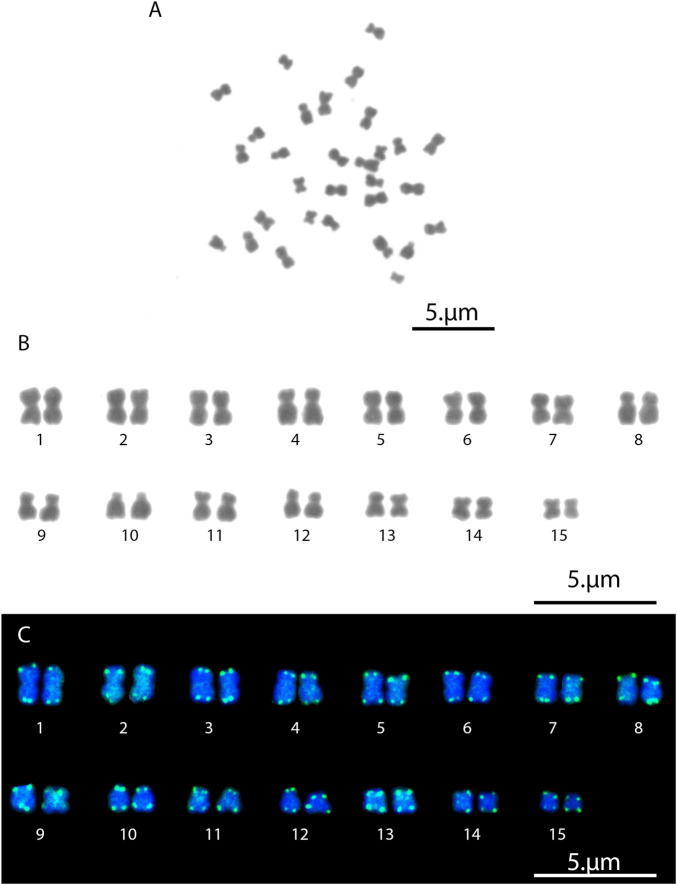 FIGURE 1
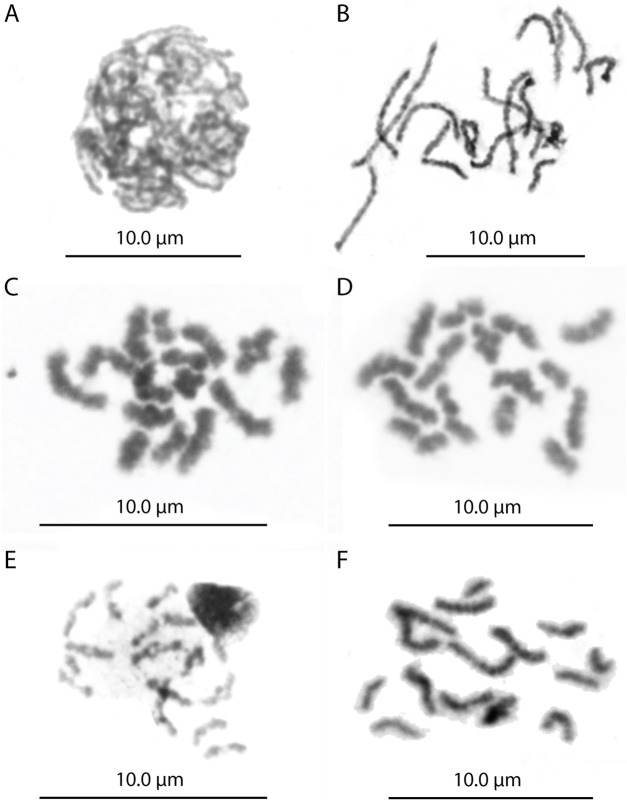 FIGURE 2
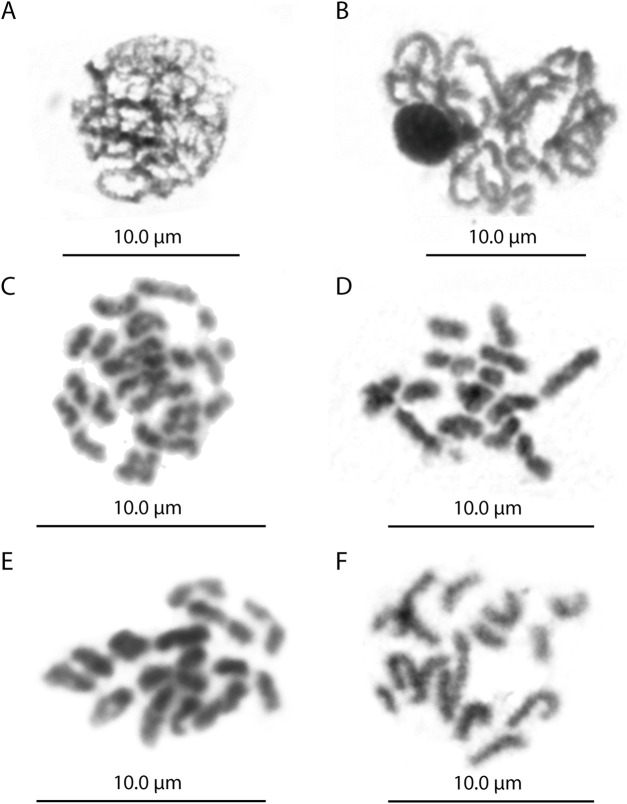 FIGURE 3
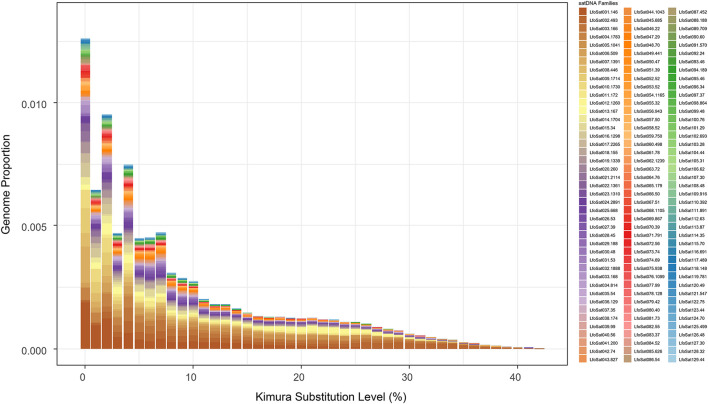 FIGURE 4
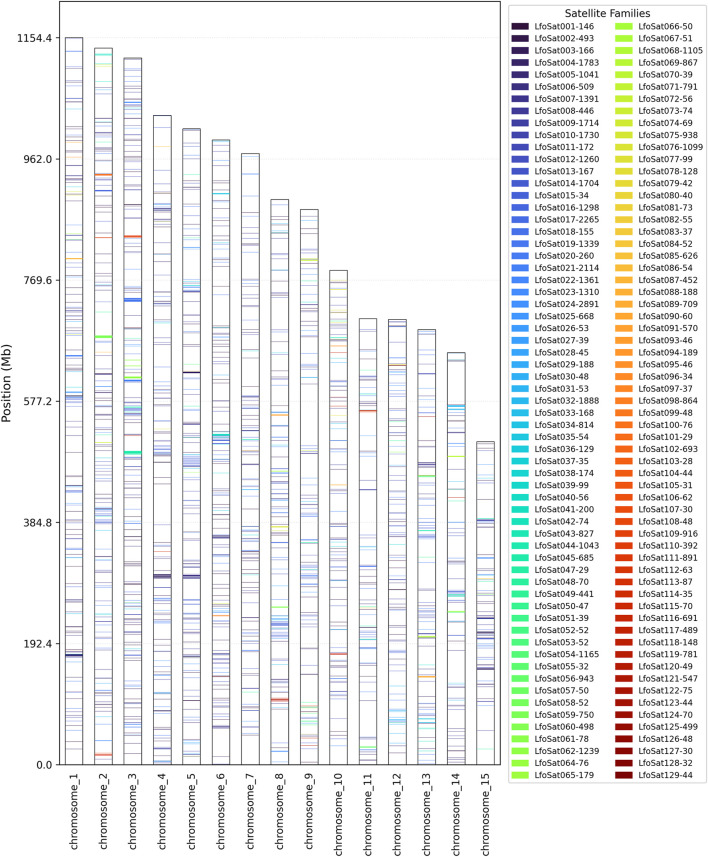 FIGURE 5
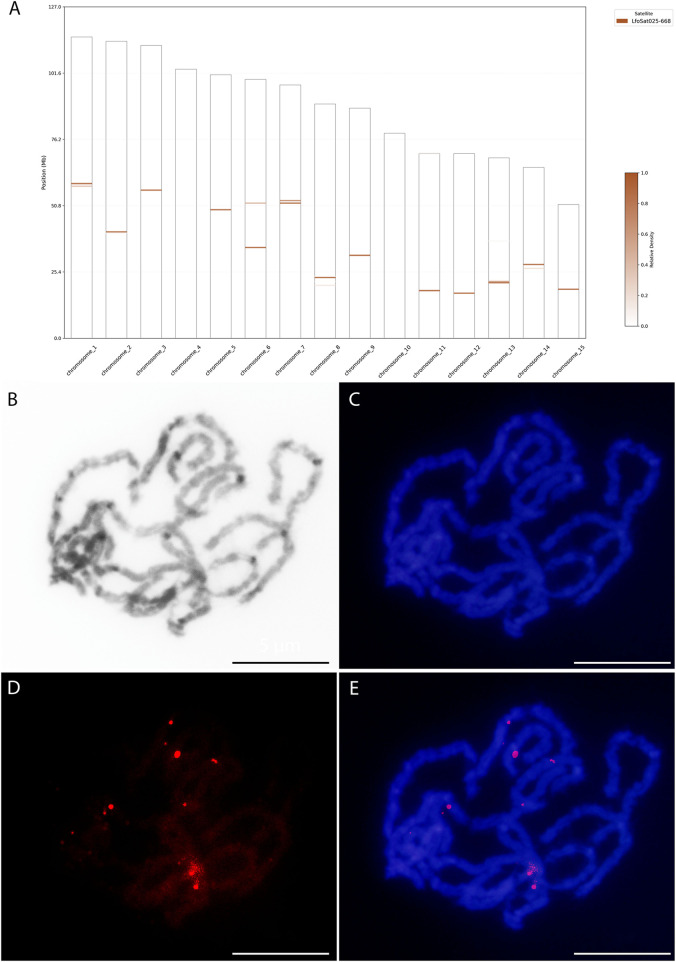 FIGURE 6
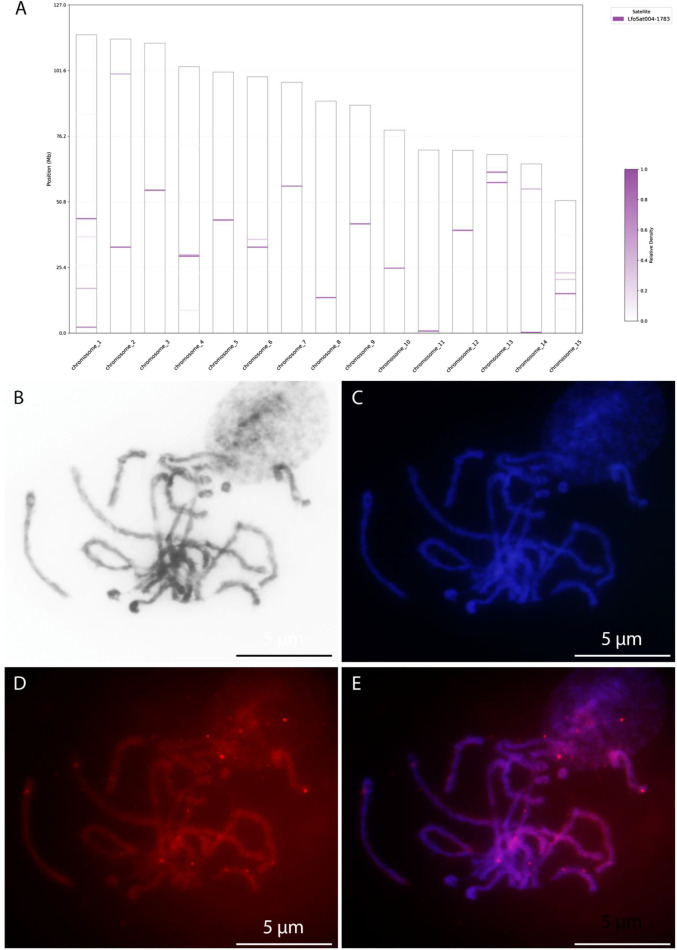 FIGURE 7
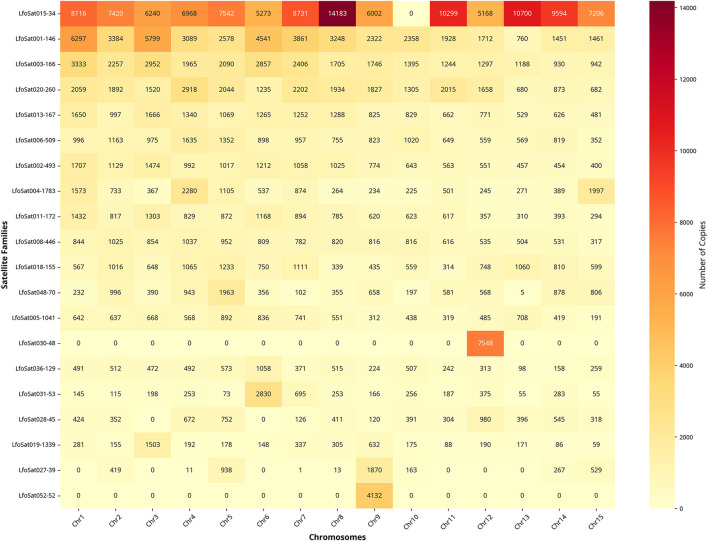 FIGURE 8
Peer Reviews
No public reviews on file for this paper yet. If you reviewed it on a platform where reviews are public (OpenReview, ICLR, NeurIPS, ICML), you can paste yours below so the community can read it here.
Videos
No videos yet. Explain this paper in a talk, walkthrough, or lecture? Add one.
Taxonomy
TopicsAquatic Invertebrate Ecology and Behavior · Environmental DNA in Biodiversity Studies · Aquatic Ecosystems and Phytoplankton Dynamics
Introduction
1
The golden mussel, Limnoperna fortunei (Dunker, 1857), is a bivalve mollusk native to Southeast Asia that has become one of the most aggressive aquatic invaders in South America since its accidental introduction through ship ballast water in the 1990s (Pastorino et al., 1993; Darrigran and Pastorino, 1995). Following its establishment in the Rio de la Plata estuary, this species has rapidly colonized diverse freshwater systems across Brazil, Argentina, Uruguay, and Paraguay, causing extensive ecological disturbances and economic losses amounting to millions of dollars annually (Darrigran and Damborenea, 2011; Boltovskoy, 2015). The remarkable invasive success of L. fortunei has been associated with its broad phenotypic plasticity, efficient dispersal capacity, and rapid adaptation to novel environments.
Repetitive DNA sequences, once regarded as “junk DNA,” are now recognized as key components of genome architecture, influencing gene regulation, chromosomal organization, and evolutionary dynamics (Biscotti et al., 2015; Bourque et al., 2018). Among these elements, satDNAs represent tandemly repeated sequences that can occupy substantial portions of eukaryotic genomes and play essential roles in heterochromatin formation, centromere function, and meiotic chromosome pairing (Shatskikh et al., 2020). These sequences are also frequently involved in processes of rapid genomic change and may facilitate adaptation under environmental stress—a condition often faced by invasive species (Stapley et al., 2015; Schrader and Schmitz, 2019).
Genomic analyses of L. fortunei have revealed that approximately 32% of its nuclear genome consists of repetitive DNA, including about 9% of LINE-type transposable elements (Uliano-Silva et al., 2018). However, a substantial portion of this repetitive fraction remains unclassified, which may result from various factors including species-specific variants, genome assembly gaps, complex repeat structures, and methodological limitations in repeat detection algorithms, particularly challenging in bivalve genomes (Chen et al., 2025). Studies focused satDNAs in bivalves, encompassing 48 species from the Mytilidae, Ostreidae, and Veneridae have identified a total of 26 distinct satDNA families (Šatović et al., 2018). Among these groups, oysters (Ostreidae) exhibit the highest satDNA abundance, with counts ranging from 33 families in Crassostrea virginica to 61 in C. angulata, representing a genomic contribution of approximately 6%–7%. In C. gigas, satellitome analysis revealed an unusual, highly scattered organization of relatively short satDNA arrays across the whole genome (Tunjić-Cvitanić et al., 2021; Tunjić-Cvitanić et al., 2024).
From a cytogenetic perspective, L. fortunei presents a diploid number of 2n = 30 chromosomes, with a karyotype composed of 10 pairs of metacentric chromosomes, four submetacentric chromosomes, and one subtelocentric pair, resulting in a fundamental number (NF) of 60 (Ieyama, 1996). Notably, there is no evidence of morphologically differentiated sex chromosomes (Reis et al., 2023). Although the gonadal morphology of this species has been described (Dei Tos et al., 2016), its meiotic behavior of chromosomes during gametogenesis remains unknown. In this context, the present study investigates the composition and chromosomal distribution of satDNAs in the L. fortunei genome. By integrating genomic and cytogenetic analyses, we aim to elucidate the structural and functional roles of satDNAs within the satellitome in chromosomal stability and species adaptation.
Materials and methods
2
Sample collection and maintenance
2.1
Specimens of the L. fortunei were collected from the Iguaçu River basin, at the locality of Capanema, Paraná State, Brazil (25° 30′ 29.7″S, 53° 40′ 07.7″W). After collection, the organisms were transported under controlled conditions to the laboratory at Universidade Estadual de Ponta Grossa, Paraná, located approximately 473 km from the sampling site. In the laboratory, mussels were maintained in aerated aquaria with controlled temperature (26 °C) to ensure their survival and acclimatization. Individuals were fed daily with a mixture of microalgae, ensuring adequate nutritional support until the experimental procedures were performed. All procedures were conducted in accordance with institutional guidelines for invertebrate research.
Mitotic chromosomes
2.2
Mitotic chromosomes were obtained from branchial and gonadal tissues of 30 individuals (15 males and 15 females) following a modified protocol of (Ebied and Aly, 2004). Mitotic arrest was induced using 0.005% colchicine solution for 72 h at 26 °C. Samples were subjected to hypotonic treatment with 0.075 M KCl for 90 min at 28 °C and subsequently fixed three times in methanol:acetic acid (3:1). The material was dissociated in 50% acetic acid and the resulting cell suspension was dropped onto heated slides (35 °C–40 °C). Finally, slides were stained with 10% Giemsa solution (pH 6.8) for 6 min. Analyses were conducted using light microscopy (100×) for karyotyping.
Meiotic chromosomes
2.3
Meiotic chromosome preparations were obtained from gonadal tissues of 30 adult males and females (15 males and 15 females) following a modified protocol of (Almeida et al., 2000). Dissected gonads were subjected to hypotonic treatment in deionized water for 1 h at room temperature and subsequently fixed in Carnoy I (methanol:acetic acid, 3:1) for 30 min. Fixed material was stored in fresh Carnoy I at 4 °C until use. For slide preparation, gonadal fragments (∼3 mm) were macerated in 45% acetic acid, spread onto slides, and dried on a heated plate (35 °C–40 °C). The chromosomal preparations were stained with 3% Giemsa solution (47 mL of distilled water, 1.5 mL of Giemsa, and 1.5 mL of phosphate buffer pH 6.8) for 12 min. Meiotic cells were analyzed and photographed using light microscopy (100×) and epifluorescence microscopy for FISH using an Olympus BX41 epifluorescence microscope equipped with a DP-71 CCD camera.
Nuclear DNA content analysis
2.4
Nuclear DNA content analysis was performed using a CyFlow® Ploidy Analyser flow cytometer (Sysmex, Germany) to compare genome size between males and females of L. fortunei. For each individual, branchial and gonadal tissues were dissected and mechanically fragmented in a lysis buffer containing Triton X-100. The resulting suspensions were filtered through a 30 µm nylon mesh to remove debris and ensure homogeneity of nuclei. The samples were stained with 4′,6-diamidino-2-phenylindole (DAPI, 4 μg/mL) and kept on ice until analysis. As an internal reference, fibroblasts and sperm cells from the fish Astyanax mexicanus were included in each run, a species with a genome size previously established by flow cytometry and sequencing approaches, ensuring reliable calibration of fluorescence intensities. For each sample, at least 5,000 nuclei were measured, with three independent replicates per individual. Fluorescence histograms were processed using FlowMax® software (Sysmex).
Genomic DNA extraction and sequencing
2.5
Total genomic DNA was extracted from an adult female collected from the Iguaçu River basin using the DNeasy Blood & Tissue Kit (Qiagen, Germany) following manufacturer’s recommendations. DNA quality and concentration were verified by spectrophotometry (NanoDrop 2000; Thermo Fisher Scientific) and 1% agarose gel electrophoresis, ensuring A260/280 ratios between 1.8 and 2.0. DNA libraries were constructed using the TruSeq DNA PCR-Free Library Preparation Kit (Illumina, USA) to minimize amplification bias. Libraries were sequenced in paired-end mode (2 × 150 bp) on the Illumina HiSeq 2000 platform, generating approximately 2.3 Gb of raw data with ∼1.4× genome coverage.
Satellitome analysis
2.6
Read processing and quality control
2.6.1
Raw reads were initially assessed using FastQC v0.11.9 and filtered for minimum quality scores of Q > 30. Low-quality bases (trim <20) and residual adapters were removed using Trimmomatic v0.39 with parameters “SLIDINGWINDOW:4:20″ and “MINLEN:50”. High-quality reads were then subsampled to create libraries of 1 million paired-end reads (∼1M paired-end reads) using Seqtk v1.3 (seqtk sample -s100 input.fastq 1000000). Each sublibrary corresponded to approximately 0.2× estimated genome coverage, meeting RepeatExplorer2 pipeline requirements for repeat detection in intermediate-sized genomes.
RepeatExplorer2 analysis
2.6.2
Sublibraries were uploaded to the Galaxy platform (https://repeatexplorer-elixir.cerit-sc.cz/galaxy/) and submitted to the RepeatExplorer2 pipeline (Novák et al., 2013). RepeatExplorer2 performs graph-based clustering analysis of reads, identifying characteristic clusters of repetitive families, including satDNAs families. Each candidate satellite cluster was extracted as a preliminary consensus sequence (satDNA catalog). To increase detection rates of low-abundance families, multiple iterative rounds were conducted using RepeatExplorer2, as described by (Ruiz-Ruano et al., 2016), reapplying the protocol to unclassified reads from previous rounds.
In silico satDNA localization
2.7
The in silico analysis was conducted to investigate the chromosomal distribution of the identified satDNA families. Consensus sequences from the satDNAs families were used as queries in BLASTn (e-value ≤ 1e-05, minimum identity 80%, minimum overlap 80% of query length, with overlapping hits merged to prevent double counting) searches against the chromosome-level genome assembly of L. fortunei (assembly xbLimFort5), available at the National Center for Biotechnology Information (NCBI). For each detected satDNA copy, the corresponding chromosome and genomic coordinates were annotated. These data were then employed to construct ideograms representing both chromosome length and the physical positions of the satDNA families. Ideograms and positional visualizations were generated using custom Python scripts developed with artificial intelligence–assisted tools (Manus ver. 1.5). Subsequently, we quantified the copy number of each satDNA family per chromosome based on discrete BLASTn hits. It is important to note that this copy number metric is distinct from the genome-wide abundance percentage estimated by RepeatExplorer2, which is based on read clustering. This allowed us to identify families with potential chromosome-specific distributions and compare abundance patterns across methods.
For FISH validation, two satDNA families were selected based on chromosomal distribution patterns predicted by in silico mapping, representing contrasting organizational strategies. LfoSat025 was selected for its pattern of localized enrichment on specific chromosomes, suggesting chromosome-specific pericentromeric localization. LfoSat004 was selected to represent pan-chromosomal satDNAs, as it showed localized enrichment across all 15 chromosomes, demonstrating that broad chromosomal distribution can be associated with regional specificity. The selection strategy prioritized families showing localized enrichment over those with highly dispersed distribution, as the former are more amenable to cytogenetic visualization and typically yield clearer FISH signals. Additionally, monomer size was considered as a technical criterion, with both selected families having intermediate-length monomers (668 bp for LfoSat025, 1,783 bp for LfoSat004) that facilitate efficient PCR amplification and probe labeling.
Fluorescence in situ hybridization (FISH) and probe preparation
2.8
FISH experiments were conducted to determine the chromosomal localization of telomeric sequences and to validate our computational predictions for a selected high-copy-number satDNA family, LfoSat004, and LfoSat025, which showed a pattern of local enrichment. The probes of Telomeric and SatDNA sequences were amplified by polymerase chain reaction (PCR) using primers Telomeric (F: 5′- TTAGGGTTAGGGTTAGGGTTAGGGTTAGGG-3′, R: 5′- CCCTAACCCTAACCCTAACCCTAACCCTAA - 3′), TM = 55 °C, LfoSat25: (F: 5′- ACTGACGCCAAACTAAGCCA-3′, R: 5′- TGCGTTTGAAGGTGCAATGT-3′) TM = 56 °C and LfoSat004 (F: 5′- TGTCGATGGAAGTGGTAAGCC-3′, R: 5′- AAGTGTTCGGTGTGACAGGG-3′) TM = 56 °C, designed from previously identified consensus sequences of the target satDNAs families. Each PCR reactions were carried out in a total volume of 50 µL containing genomic DNA, 0.2 mM of each dNTP, 1× PCR buffer, 1.5 mM MgCl_2_, 0.5 µM of each primer, and 1 U of Taq DNA polymerase. The cycling conditions consisted of an initial denaturation at 94 °C for 3 min, followed by 30 cycles of 94 °C for 30 s, annealing at 55 °C–56 °C for 30 s (depending on primer Tm), and extension at 72 °C for 1 min, with a final extension at 72 °C for 5 min. PCR products were labeled with 0,02 mM digoxigenin-dUTP (Roche) nucleotides via PCR incorporation.
FISH experiments were conducted on both mitotic and meiotic chromosomes. Mitotic chromosomes were used to determine the chromosomal localization of telomeric sequences using the (TTAGGG)n probe. Meiotic chromosomes (pachytene stage) were used to validate our computational predictions for the selected high-copy-number satDNA families, LfoSat004 and LfoSat025. The slides were previously pretreated with RNase A (100 μg/mL in 2× SSC, 1 h at 37 °C) to remove RNA and subsequently treated with pepsin (0.005% in 10 mM HCl, 10 min at 37 °C) to improve probe accessibility. After, they were post-fixed in 1% paraformaldehyde, and dehydrated in an ethanol series (70% 2 min, 90% 2 min, 100% 4 min). The chromosomal denaturation was made in 70% formamide/2× SSC at 72 °C for 3 min. The FISH experiments were performed under high-stringency conditions. Labeled probes were denatured at 75 °C for 10 min prior to being applied to the slides. The hybridization was performed overnight at 37 °C in a humid chamber hybridization. Post-hybridization washes were performed in 2× SSC at 42 °C, followed by detection using an anti-digoxigenin–rhodamine antibody (Roche Diagnostics, Germany; 1:200 dilution) for the satDNA probe, and Alexa Fluor 488 (Invitrogen; 1:200 dilution) for the telomeric probe, according to the manufacturer’s instructions. Chromosomes were counterstained with DAPI and mounted in antifade medium.
Results
3
Mitotic and meiotic characterization
3.1
The L. fortunei exhibits a diploid chromosome number of 2n = 30 with karyotype formulae (KF) = 20m + 8sm + 2st (Figures 1A,B). FISH with the telomeric probe (TTAGGG)n revealed strong signals at the terminal regions of all mitotic chromosomes (Figure 1C). In addition to the expected terminal signals, dispersed signals were also observed in interstitial regions of several chromosome pairs. Notably, these interstitial signals showed consistent patterns among homologous chromosomes, suggesting they represent genuine (TTAGGG)n repeats rather than background noise. To investigate this further, we performed a comprehensive in silico search for tandem arrays of the (TTAGGG)n repeat throughout the chromosome-level genome assembly. This analysis did not identify significant interstitial telomeric sequence (ITS) arrays of substantial length, which may be attributed to assembly quality limitations and the frequent collapse of short repetitive sequences during genome assembly. Nevertheless, the consistent FISH signals in interstitial regions indicate that short (TTAGGG)n repeats or fragmented arrays are present at these loci, even if they are not captured in the current genome assembly. Meiotic chromosome analysis in both males and females confirmed the presence of 15 bivalents (Figures 2, 3). Nuclear DNA content estimation revealed values of 1.4 pg for diploid cells and 0.69 pg for haploid cells from gonadal tissues of both sexes.
Mitotic chromosomes of Golden Mussel (Limnoperna fortunei). (A) Representative metaphase spread. (B) Karyotype of 2n = 30 chromosomes. (C) Karyotype after fluorescence in situ hybridization (FISH), showing the telomeric (TTAGGG)8 sequences (green signals) on DAPI-stained chromosomes (blue).
Meiotic cells of female the Limnoperna fortunei. (A) Zygotene. (B) Pachytene with 15 bivalents. (C) Diplotene. (D) Diakinesis. (E) Metaphase I with 15 bivalents. (F) Metaphase II with 15 chromosomes.
Meiotic cells of male the Limnoperna fortunei. (A) Zygotene. (B) Pachytene with bivalents in bouquet configuration. (C) Diplotene. (D) Diakinesis. (E) Metaphase I with 15 bivalents. (F) Metaphase II with 15 chromosomes.
Comparative meiotic analysis demonstrated an identical pattern of chromosome segregation in males and females (Figures 2, 3), with no evidence of behaviour or pairing that would suggest the presence of heteromorphic sex chromosomes. During the early meiotic stages (leptotene and zygotene), chromatin condensation and the start of homologous pairing were observed, with bivalents appearing as interlocked structures (Figures 2A, 3A).
At pachytene, both males and females showed the presence of 15 individualized and thicker and more individualized filaments, with different sizes, interpreted as bivalent. Several pachytene nuclei exhibited the typical bouquet configuration (Figures 2B, 3B). Diplotene and diakinesis stages also showed 15 bivalents, corresponding to the meiotic formula 2n = 15II, with one or two chiasma per bivalent (Figures 2C,D, 3C,D). In some diplotene cells, premature segregation of the three bivalents has been observed. At metaphase I (Figures 2E, 3E), bivalents were aligned on the meiotic spindle, while metaphase II cells consistently exhibited 15 chromosomes in both males and females (Figures 2F, 3F).
Satellitome characterization
3.2
The initial analysis with RepeatExplorer2 identified 129 distinct satDNA families, which were named LfoSat001-129 according to their abundance rankings in the raw sequencing reads. This analysis estimated a total satDNA content of approximately 9.1% of the genome. The top 20 most abundant families identified by RepeatExplorer2 accounted for approximately 6.2% of the genome, with LfoSat001 being the most abundant (0.9%), followed by LfoSat002 (0.7%) and LfoSat003 (0.6%) (Supplementary Table S1). Subsequently, we performed an in silico mapping of these 129 families against the chromosome-level reference genome. This second approach successfully mapped 126 families, which collectively represented approximately 5.3% of the assembled genome (Supplementary Table S2). In this mapping-based analysis, the genomic abundances of individual families varied up to approx. 0.42%, with the top 20 families accounting for approximately 3.9% of the genome. The remaining 106 mapped families contributed an additional 1.4%.
Most families in both analyses are concentrated at low divergence levels (0%–5% Kimura substitutions) (Figure 4 and Supplementary Figure S1, for the top 30 most abundant families.). Three families (LfoSat046, LfoSat063, LfoSat092) were not detected in the chromosomal assembly, likely due to assembly gaps or collapse of highly repetitive regions during genome assembly, despite being more abundant than some chromosome-specific families (Figure 5).
Abundance satDNAs families in Golden Mussel (Limnoperna fortunei) relative to the Kimura substitution level. The graph shows the genomic proportion of the satDNA families at different levels of divergence from the consensus sequences. Nomenclature follows RepeatExplorer2 abundance rankings according to Ruiz-Ruano et al. (2016).
In silico mapping of the 126 satDNA families across the 15 chromosomes of Golden Mussel (Limnoperna fortunei), based on the reference genome assembly (xbLimFort5.1, NCBI). The distribution pattern highlights the widespread presence of satDNA families throughout the genome, with some exhibiting chromosome-specific enrichment while others are dispersed across multiple chromosomes. Three families (LfoSat046, LfoSat063, and LfoSat092) showed no significant chromosomal mapping, likely due to very low abundance or high sequence divergence below the detection threshold (e-value ≤ 1e-05).
In silico and in situ chromosome distribution of satDNAs
3.3
Chromosome-specific analysis of all 126 mapped families (Figure 5) revealed 32 families (25.4%) showing exclusive chromosomal localization, distributed across 10 of the 15 chromosomes (Supplementary Table S2). The most abundant chromosome-specific families include LfoSat030 (chromosome 12, 0.0236%), LfoSat059 (chromosome 2, 0.0232%), LfoSat119 (chromosome 8, 0.0174%), and LfoSat078 (chromosome 10, 0.0167%). While these families individually represent lower genomic abundances compared to multi-chromosomal families, they represent potential candidates for chromosome-specific markers, pending experimental validation through FISH or other cytogenetic approaches in future studies.
Among the 126 mapped families, LfoSat025 and LfoSat004 were selected for FISH validation due to their distinctive distribution patterns. LfoSat025 showed local enrichment across 13 chromosomes (absent on chromosomes 4 and 10), with a pattern suggesting pericentromeric localization (Figure 6). LfoSat004, one of the most abundant families (0.29% of the genome, 11,595 copies), exhibited local enrichment across all 15 chromosomes, demonstrating that pan-chromosomal distribution can be associated with regional specificity (Figure 7). Fluorescence in situ hybridization confirmed the in silico predictions for both families. LfoSat025 (Figure 6) showed preferential localization in the pericentromeric regions of pachytene bivalents (Figures 6B–E). LfoSat004 (Figure 7) displayed multiple localized signals across pachytene bivalents, with regional accumulation (Figures 7B–E). Furthermore, the in silico analysis also allowed evaluation of the copy number of each satDNA family, with the 20 most abundant highlighted in Figure 8.
In silico and in situ chromosomal mapping of the satDNA family LfoSat025 in the Limnoperna fortunei. (A) In silico distribution of LfoSat025 across the 15 chromosomes; the intensity of the color shading corresponds to the relative density of the satDNA sequences according to the scale on the right. (B) Pachytenic bivalents with Giemsa. (C) counterstained with DAPI (blue). (D) FISH signals of the LfoSat025 probe (red), revealing multiple hybridization sites. (E) Merged image of DAPI and FISH signals, showing the bivalent localization of LfoSat025. Scale bars = 5 µm.
In silico and in situ chromosomal mapping of the satDNA family LfoSat004 in the Limnoperna fortunei. (A) In silico distribution of LfoSat004 across the 15 chromosomes; the intensity of the color shading corresponds to the relative density of the satDNA sequences according to the scale on the right. (B) Pachytenic bivalents with Giemsa. (C) counterstained with DAPI (blue). (D) FISH signals of the LfoSat004 probe (red), revealing multiple hybridization sites. (E) Merged image of DAPI and FISH signals, showing the bivalent localization of LfoSat025. Scale bars = 5 µm.
Chromosomal distribution of the top 20 satDNA families ranked by total copy number according to in silico analysis of Limnoperna fortunei. Color intensity represents copy number per chromosome (scale 0–14,183). Families ordered by decreasing total copy number, which differs from nomenclature ranking based on RepeatExplorer2 abundance estimates. BLAST analysis: e-value ≤ 1e-05, minimum identity 80%, minimum overlap 80%.
The satellite LfoSat015-34 was the most abundant element, with 113,442 copies distributed across 14 of the 15 chromosomes analyzed (absent only on chromosome 10), suggesting a significant role in genomic structure unrelated to centromeric or telomeric regions (Figure 8). This sequence showed no matches in public databases (NCBI, Repbase), indicating it is likely species-specific with a function yet to be determined. The diversity of satDNA families per chromosome varied considerably, with chromosome 2 presenting the highest richness (65 families), while chromosome 1 concentrated the largest absolute number of copies (36,450).
Discussion
4
This study integrates cytogenetic validation through FISH with genome-wide bioinformatic analysis to characterize the chromosomal distribution of satDNAs in the L. fortunei genome. Our results reveal that the species possesses a diversified and widely distributed repertoire of these repetitive elements in its genome and chromosomes. The apparent paradox between the adaptive success of an invasive species and the reduction in genetic variability caused by population bottlenecks, as observed in the case of this Asian mussel in South American environments, can now be reinterpreted in light of karyotypic microevolution.
Diversity and evolutionary dynamics of the satellitome
4.1
The identification of 129 distinct satDNA families in L. fortunei reveals a rich and complex satellitome, contributing to the growing body of knowledge on repetitive elements in bivalve mollusks. This diversity is comparable to that found in other well-studied bivalves, where satellitomes can be highly dynamic and structurally diverse (e.g., Tunjić-Cvitanić et al., 2021).
The relatively moderate satDNA content in L. fortunei (approx. 9.1% of the genome) falls within the range reported for other bivalve species, such as the Pacific oyster Crassostrea gigas (5%–8%), but contrasts with some terrestrial mollusks where satellitomes can exceed 20% of the genome, suggesting potential ecological or physiological constraints on repetitive DNA accumulation in aquatic bivalves. Similarly, in the hard clam Mercenaria mercenaria (Veneridae), satellite DNA elements were found to represent approximately 10% of the genome (Farhat et al., 2022).
These abundance estimates, however, must be interpreted in light of important methodological considerations. Both abundance values and divergence estimates differ significantly between the two methods employed in this study. RepeatExplorer2 provides genome-wide estimates based on read clustering, which is sensitive to all repetitive DNA in the raw data, including highly divergent and ancient copies. In contrast, in silico mapping quantifies discrete copies on the assembled chromosomes using BLAST with stringent parameters (e-value ≤ 1e-05, minimum identity 80%, minimum overlap 80%). This approach is susceptible to two main biases: (i) underestimation of abundance due to assembly gaps or the collapse of highly repetitive regions in the reference genome, and (ii) underestimation of divergence due to mapping bias, as BLAST preferentially maps more conserved copies while excluding highly divergent variants that fail to meet the identity threshold. Consequently, the in silico approach captures a younger, more homogeneous subset of each satDNA family, resulting in systematically lower divergence values (mean: 3.98% vs. 7.21% in RepeatExplorer2) and altered abundance rankings. These methodological differences explain why some families with higher nomenclature numbers (lower abundance in RepeatExplorer2) appear among the most abundant in the chromosomal mapping analysis, and why divergence values are consistently lower in the in silico analysis (Supplementary Tables S1,S2).
LfoSat025 showed localized accumulation in specific regions of pachytene bivalents, with a pattern consistent with pericentromeric localization. While we did not functionally prove their role, this pattern suggests that LfoSat025 could be involved in the organization of pericentromeric heterochromatin. About this, it is crucial to recognize that this is not the only possible distribution for satDNA. Recent studies have increasingly challenged the paradigm that satDNAs are exclusively confined to heterochromatic regions. For instance, a substantial portion of the satellitome in C. gigas, is highly scattered across the genome, suggesting potential roles in gene regulation or other functions beyond structural heterochromatin (Tunjić-Cvitanić et al., 2021). Similarly, a study in Neuropteran insects also revealed that abundant satDNAs acmulated in euchromatin, providing further evidence that satDNA distribution patterns are highly species-specific and not universally linked to heterochromatin (Cabral-de-Mello et al., 2025).
Our in silico mapping also reveals families in L. fortunei with pan-chromosomal distribution, such as LfoSat004, which is present on all 15 chromosomes with localized regional enrichment. The chromatin context and potential functional significance of these pan-chromosomal families remain to be determined through additional approaches such as ChIP-seq or chromatin immunoprecipitation experiments.
The divergence profile reveals distinct evolutionary patterns within the L. fortunei satellitome. The predominance of low-divergence variants (0%–5% Kimura substitutions) across most families indicates recent amplification events, a pattern consistent with the “molecular drive” model of satDNA evolution (Dover, 1982; Ruiz-Ruano et al., 2016; João Da Silva et al., 2023). This recent expansion could be associated with population bottlenecks during South American colonization or adaptive responses to novel environments (Lower et al., 2018).
The presence of higher-divergence variants in the same families suggests either: (1) multiple amplification events separated in time, reflecting cycles of amplification and degeneration (Camacho et al., 2022); (2) differential evolutionary rates within satellite arrays, where some regions evolve faster than others (Vittorazzi et al., 2014); or (3) remnants of ancestral sequences undergoing gradual decay (Camacho et al., 2022). This complex pattern, with both recent and older variants coexisting, differs from some bivalve species where ancient, highly divergent satellite families dominate the satellitome, such as the BIV160 satDNA found across multiple bivalve clades (Plohl et al., 2010; Šatović et al., 2018) This suggests a more dynamic and recent evolutionary history of repetitive elements in L. fortunei compared to species with more ancient satDNA profiles.
Notably, some satellite families demonstrated pan-chromosomal distribution, being present in all 15 chromosomes of the species’ standard complement, indicating possible functional and/or structural importance. The significant variation in abundance and diversity between chromosomes suggests specific patterns of genomic organization, possibly related to differential evolution of repetitive elements or chromosome-specific selective pressures. The asymmetric abundance distribution observed, where few families dominate the satellite landscape, reflects the stochastic nature of satDNA amplification and decay processes. This pattern suggests that satDNA families undergo cycles of expansion and contraction over evolutionary time, with successful families expanding rapidly while others diminish through mutational decay or deletion events (Camacho et al., 2022).
The size of repetitive units, ranging from 22 to 2,891 bp, encompasses a wide range typical of satDNA in eukaryotes (Garrido-Ramos, 2017; Thakur et al., 2021) The satDNAs with shorter monomer sizes may represent ancestral elements that underwent deletions or fragmentation over evolutionary time, while larger ones may have resulted from internal duplications or fusions of smaller units (Camacho et al., 2022) This size diversity suggests multiple mechanisms of satDNA origin and evolution in L. fortunei, including unequal crossing-over, replication slippage, transposon-mediated duplications, and de novo emergence from tandem duplications of simple sequences (Plohl et al., 2008; Garrido-Ramos, 2017).
The low divergence observed in most L. fortunei satellite families contrasts with patterns found in some bivalve species where ancient satDNA with high divergence is common, such as in certain Veneridae species where satDNA subfamilies can differ by up to 11% (Plohl and Cornudella, 1996; Plohl et al., 2010). However, it aligns with patterns observed in other Mytilidae, where satDNAs show greater conservation among closely related species (Martínez-Lage et al., 2002; Martínez-Lage et al., 2005), suggesting family-specific evolutionary dynamics of satDNA (García-Souto et al., 2015; Šatović et al., 2018).
Chromosomal organization and functional implications
4.2
The karyotype and diploid number of L. fortunei 2n = 30 observed in this work is consistent with other studies and species of the Mytilidae family (now assigned to the family Modiolidae, following a recent taxonomic revision by Tan and Tan, 2024), in which diploid numbers vary from 2n = 22 to 2n = 32 chromosomes (Thiriot-Quievreux, 2002). There is extensive literature describing patterns of satDNA distribution in bivalves and other taxa (Šatović et al., 2018; Cabral-de-Mello et al., 2021; Šatović-Vukšić and Plohl, 2023). The relatively uniform distribution of satDNAs across the 15 chromosomes in L. fortunei, revealed by in silico mapping, is comparable to the scattered organization observed in C. gigas (Tunjić-Cvitanić et al., 2021) and reflects the diversity of satDNA distribution patterns documented across bivalve species (Šatović et al., 2018). While some species show highly localized satDNA distributions restricted to specific chromosomes or regions (Biscotti et al., 2007; Petrović et al., 2009), others, like L. fortunei, exhibit more widespread patterns across multiple chromosomes (Martínez-Lage et al., 2002; Vojvoda Zeljko et al., 2020).
The identification of 32 chromosome-specific satDNA families (25.4% of mapped families) in L. fortunei provides a valuable resource for chromosome identification and cytogenetic studies (Wei et al., 2020; Marková et al., 2025). While these families tend to have lower individual abundances compared to the highly abundant multi-chromosomal families, their chromosome specificity makes them particularly useful as molecular cytogenetic markers, a principle well-established in bivalve cytogenetics (Clabby et al., 1996; Thiriot-Quievreux, 2002). This proportion of chromosome-specific families is comparable to patterns observed in other bivalve species (Šatović et al., 2018) and suggests that satDNA evolution in L. fortunei involves both chromosome-specific amplification events and genome-wide dispersal mechanisms (Thakur et al., 2021).
The presence of low-copy satDNA occurrences (1-5 copies per chromosome, represented by light yellow in Figure 8) raises intriguing questions about satDNA evolutionary dynamics and genome organization in L. fortunei. These sporadic distributions may reflect several evolutionary processes that have shaped the current satellitome architecture. First, they could represent evolutionary remnants of once-larger satellite arrays that have been progressively disrupted through transposable element insertions, chromosomal rearrangements, or gradual sequence divergence beyond recognition thresholds. Such degradation processes have been documented in other species where satDNA families undergo cycles of amplification and subsequent decay (Plohl et al., 2008; Garrido-Ramos, 2017).
Alternatively, these low-copy occurrences might indicate recent transposition or recombination events that have dispersed satellite sequences to new chromosomal locations, potentially representing early stages of satellite colonization of previously unoccupied genomic regions. This interpretation is supported by studies in Drosophila and other organisms where satDNA mobility contributes to genome evolution (Jagannathan et al., 2018). However, it cannot be excluded that some of these occurrences represent assembly artifacts inherent to the challenges of accurately assembling highly repetitive genomic regions, particularly in complex satDNA landscapes. To distinguish between biologically meaningful satellite distributions and potential background noise, some authors assume a conservative threshold of 10 copies per chromosome (Satović et al., 2016). This approach allows focus on satellite families with substantial chromosomal presence while acknowledging that low-copy occurrences may harbor important evolutionary information worthy of future investigation using more sensitive detection methods or experimental validation approaches.
The LfoSat025 family (Figure 6) showed a clear accumulation in condensed, DAPI-positive regions of pachytene bivalents, which is consistent with a pericentromeric localization. While we did not functionally prove their role, this pattern suggests that LfoSat025 could be involved in the organization of pericentromeric heterochromatin. This hypothesis is in line with current models where pericentromeric satDNAs are considered important for maintaining centromere integrity and ensuring proper chromosome segregation, often through the formation of specialized chromatin domains (Brändle et al., 2022; Ugarković et al., 2022). In contrast, LfoSat004 (Figure 7) exhibited localized enrichment between the bivalents without clear pericentromeric restriction, demonstrating that satDNAs in L. fortunei can show diverse distribution patterns. This diversity, with some families showing chromosome-specific pericentromeric localization and others showing pan-chromosomal regional accumulation, reflects the complex organizational landscape of the L. fortunei satellitome.
Meiotic behavior and reproductive biology
4.3
Meiotic analysis revealed normal chromosomal behavior with regular pairing and segregation, confirming the presence of 15 bivalents (2n = 15II) in both males and females. This pattern indicates genomic stability and normal meiotic processes, suggesting that the satDNA content, while significant, does not grossly disrupt chromosomal behavior during gametogenesis. It is important to note, however, that the ∼9.1% of the genome represented by satDNAs in L. fortunei is moderate compared to many other species where this fraction can exceed 50% and is often distributed across all chromosomes (Garrido-Ramos, 2017). The presence of normal meiotic behavior is consistent with observations across diverse taxa, where meiosis functions effectively regardless of satellitome size, indicating that satDNA content per se does not necessarily disrupt chromosomal behavior during gametogenesis.
Recent studies have shown that satDNAs are not merely structural components but can be actively involved in cellular responses to environmental stress. For example, in the beetle Tribolium castaneum, the major satDNA (TCAST1) is transcribed in response to heat stress, and its transcripts are involved in modulating the expression of stress-related genes (Feliciello et al., 2015; Sermek et al., 2020). The controlled abundance and organization of the L. fortunei satellitome might represent an evolutionary trade-off, maintaining genomic stability while allowing for a degree of plasticity in cellular stress responses (Fonseca-Carvalho et al., 2024).
The absence of sex chromosome differentiation confirms previous cytogenetic observations and provides insights into the reproductive biology of this economically important species (Reis et al., 2023). L. fortunei is predominantly gonochoristic (dioecious), with approximately equal ratios of males and females and external fertilization. However, occasional hermaphroditism has been documented in less than 0.6% of populations, with some studies reporting higher frequencies during early invasion periods (Fernandes de Oliveira et al., 2025). This reproductive mode, combined with the absence of sex-specific chromosomal markers, suggests that sex determination in L. fortunei likely involves environmental factors or subtle genetic mechanisms not detectable through conventional karyotyping.
The bouquet configuration observed during pachytene is a conserved phenomenon in many eukaryotes and is associated with efficient homologous pairing and recombination (Scherthan, 2007). The presence of this configuration in L. fortunei suggests conserved meiotic mechanisms and may contribute to the observed genomic stability. Bouquet formation may also facilitate the resolution of chromosomal entanglements caused by repetitive sequences (Scherthan, 2001). The observation of early segregation in some bivalents during diplotene may indicate occasional meiotic irregularities, but its low frequency suggests it does not significantly compromise the species’ reproductive viability. This meiotic stability may contribute to the reproductive success of L. fortunei in diverse environments. Furthermore, the presence of one chiasma per bivalent is consistent with the minimum necessary to ensure adequate pairing and segregation during meiosis I (Page and Hawley, 2003). This conservative recombination pattern may reflect an evolutionary strategy for maintaining genomic integrity in the face of the abundant repetitive fraction of the observed genome.
Satellitome and adaptive potential in invasive species
4.4
The relationship between satellitome characteristics and invasive success represents an emerging area of research in invasion biology. While direct causal relationships are difficult to establish, several aspects of the L. fortunei satellitome may contribute to the species’ adaptive potential. The high diversity of satDNA families (129) and evidence of recent amplification events suggest an active and dynamic repetitive DNA landscape that could facilitate genomic plasticity.
Repetitive sequences, including satDNA, can contribute to adaptive evolution through several mechanisms: (1) they can promote chromosomal rearrangements that generate genetic variability (George and Alani, 2012; Liao et al., 2023), (2) they can influence gene regulation through position effects or epigenetic modifications (Fedoroff, 2012; Ferreira et al., 2019), and (3) they can serve as substrates for the evolution of new genes or regulatory elements (Stewart and Rogers, 2019; Snowbarger et al., 2024). The recent amplification of multiple satDNA families in L. fortunei, evidenced by low divergence levels (João Da Silva et al., 2023; Pita et al., 2025), may be related to population bottleneck events during South American colonization (Yao et al., 2020) or to specific selective pressures encountered in new environments (Lavergne and Molofsky, 2007; Mounger et al., 2021).
Studies have demonstrated that repetitive elements can be activated during stress conditions or colonization events in various organisms (Casacuberta and González, 2013). While we cannot directly demonstrate such activation in L. fortunei, the patterns of recent satDNA amplification observed in our study are consistent with genomic responses to environmental challenges. The dispersed distribution of satDNAs across chromosomes may also contribute to genome-wide regulatory effects that could influence adaptive responses.
The identification of chromosome-specific satDNA markers in L. fortunei provides valuable tools for population genetic studies that could help elucidate the role of genomic factors in invasion success. These markers could be used to trace invasion routes, identify source populations, and monitor genetic changes during establishment in new environments.
Conclusion
5
This study provides the first comprehensive characterization of the satDNA landscape in the invasive golden mussel Limnoperna fortunei, revealing a remarkably diverse satelitome comprising 129 distinct families. The predominance of recently amplified satellite sequences indicates ongoing satDNA turnover in the L. fortunei genome. The integrated in silico and in situ approaches provide a framework for future genomic and cytogenetic studies of repetitive DNA organization in this invasive species. Specifically, our findings contribute to the understanding of repetitive DNA in successful aquatic invaders by: (i) delivering the first comprehensive satellitome for this ecologically critical species; (ii) establishing a new set of molecular markers for population and invasion-route studies; and (iii) revealing patterns of recent satDNA amplification that suggest dynamic genomic responses to colonization events.
The reference list from the paper itself. Each links out to its DOI / PubMed record.
- 1Almeida M. C. Zacaro A. A. Cella D. M. (2000). Cytogenetic analysis of epicauta atomavia (Meloidae) and palembus dermestoides (Tenebrionidae) with xyp sex determination system using standard staining, C-Bands, NOR and synaptonemal complex microspreading techniques. Hereditas 133, 147–157. 10.1111/j.1601-5223.2000.00147.x 11338427 · doi ↗ · pubmed ↗
- 2Biscotti M. A. Canapa A. Olmo E. Barucca M. Teo C. H. Schwarzacher T. (2007). Repetitive DNA, molecular cytogenetics and genome organization in the king scallop (Pecten maximus). Gene 406, 91–98. 10.1016/j.gene.2007.06.027 17706376 · doi ↗ · pubmed ↗
- 3Biscotti M. A. Canapa A. Forconi M. Olmo E. Barucca M. (2015). Transcription of tandemly repetitive DNA: functional roles. Chromosome Res. 23, 463–477. 10.1007/s 10577-015-9494-4 26403245 · doi ↗ · pubmed ↗
- 4Boltovskoy D. (2015). Distribution and colonization of limnoperna fortunei: special traits of an odd mussel. In: Limnoperna fortunei. Cham: Springer International Publishing, 301–311. 10.1007/978-3-319-13494-9_16 · doi ↗
- 5Bourque G. Burns K. H. Gehring M. Gorbunova V. Seluanov A. Hammell M. (2018). Ten things you should know about transposable elements. Genome Biol. 19, 199. 10.1186/s 13059-018-1577-z 30454069 PMC 6240941 · doi ↗ · pubmed ↗
- 6Brändle F. Frühbauer B. Jagannathan M. (2022). Principles and functions of pericentromeric satellite DNA clustering into chromocenters. Semin. Cell Dev. Biol. 128, 26–39. 10.1016/j.semcdb.2022.02.005 35144860 · doi ↗ · pubmed ↗
- 7Cabral-de-Mello D. C. ZrzaváM. KubíčkováS. Rendón P. Marec F. (2021). The role of satellite DN As in genome architecture and sex chromosome evolution in crambidae moths. Front. Genet. 12, 661417. 10.3389/fgene.2021.661417 33859676 PMC 8042265 · doi ↗ · pubmed ↗
- 8Cabral-de-Mello D. C. Gasparotto A. E. Rico-Porras J. M. Ferretti A. B. S. M. Mora P. Alves-Gomes R. T. (2025). First insights into the satellitomes and new evidence for the absence of canonical insect telomere in the Neuroptera order. Genome 68, 1–12. 10.1139/gen-2025-0018 40446331 · doi ↗ · pubmed ↗