VILMIR is a trans-acting long noncoding RNA that enhances the host interferon response in human epithelial cells
Kristen John, Ethan Smith, Alexandra Istishin, Nasif Mahmood, Kayleigh Diveley, Tammy S. Tollison, Susan Carpenter, Xinxia Peng

TL;DR
VILMIR is a long noncoding RNA that enhances the body's interferon response in human lung cells, potentially offering new antiviral treatment strategies.
Contribution
The study identifies VILMIR as a novel trans-acting lncRNA that enhances the host interferon response and proposes potential mechanisms for its action.
Findings
VILMIR interacts with nuclear proteins FUBP1 and PUF60, and cytoplasmic proteins IFIT1, IFIT3, QARS1, and KARS1.
Overexpression of VILMIR enhances interferon response genes in A549 cells.
VILMIR knockdown and overexpression consistently regulate a core set of interferon-stimulated genes.
Abstract
Long noncoding RNAs (lncRNAs) have been found to play significant regulatory roles within antiviral and immune responses. We previously identified the novel lncRNA virus-inducible lncRNA modulator of interferon response (VILMIR), which was found to broadly regulate the host transcriptional response to interferon-beta (IFN-β) treatment in A549 human lung epithelial cells. Here, we investigated the mechanism by which VILMIR regulates the host interferon response in trans by identifying interacting proteins and gene regulatory networks of VILMIR. Through an RNA pull-down assay, we found that VILMIR interacted with both nuclear and cytoplasmic proteins in vitro, including the transcriptional regulators FUBP1 and PUF60 in the nucleus, as well as the antiviral proteins IFIT1 and IFIT3 and the aminoacyl-tRNA synthetases QARS1 and KARS1 in the cytoplasm. In addition, we found that the…
Genes, proteins, chemicals, diseases, species, mutations and cell lines named across the full text — each resolved to its canonical identifier and authoritative record.
Click any figure to enlarge with its caption.
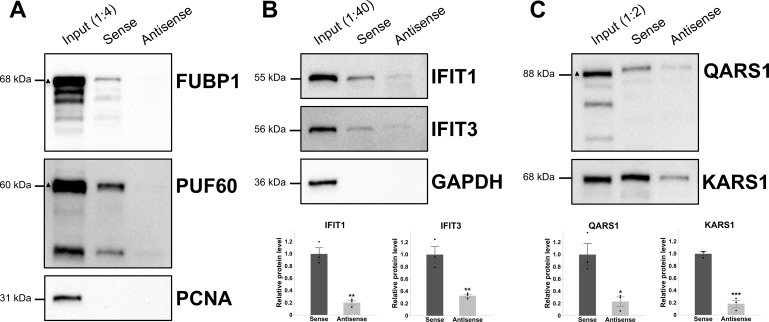 Fig 1
Fig 1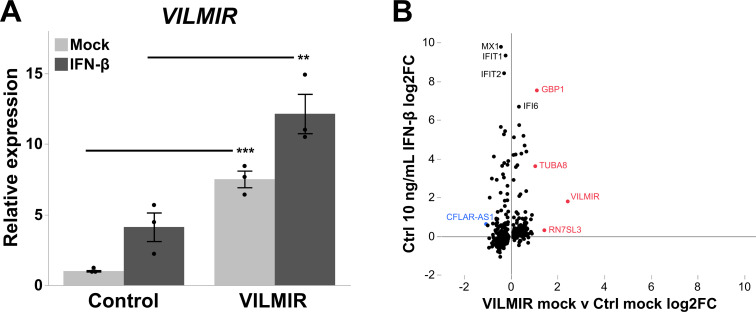 Fig 2
Fig 2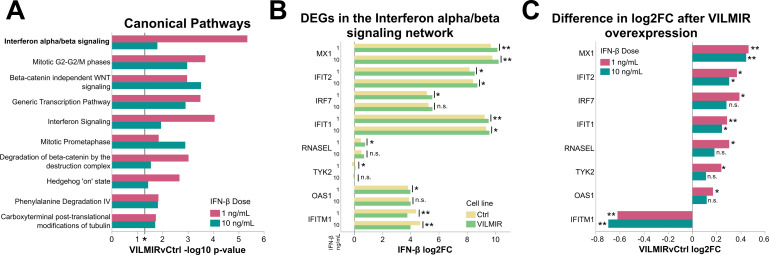 Fig 3
Fig 3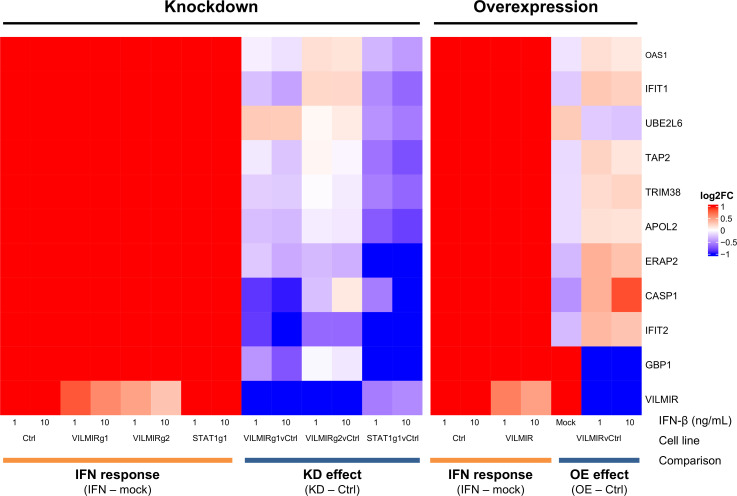 Fig 4
Fig 4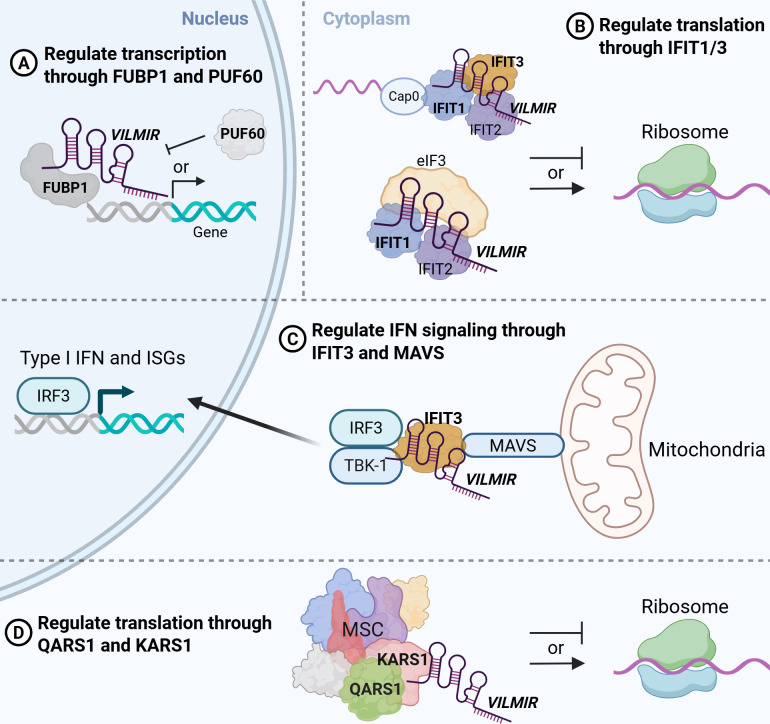 Fig 5
Fig 5| Protein ID | Mass (kDa) | Sense | Antisense | Enrichment | ||||
|---|---|---|---|---|---|---|---|---|
| LRPPRC | 158 | 19 | 15 | 15 | 0 | 0 | 0 | N/A |
| PCBP2 | 39 | 10 | 8 | 2 | 0 | 0 | 0 | N/A |
| CSTF3 | 83 | 10 | 9 | 10 | 0 | 0 | 0 | N/A |
| CELF1 | 52 | 11 | 9 | 7 | 0 | 0 | 0 | N/A |
| CSTF2 | 61 | 6 | 5 | 5 | 0 | 0 | 0 | N/A |
| TARDBP | 45 | 6 | 5 | 3 | 0 | 0 | 0 | N/A |
| CPSF7 | 52 | 5 | 4 | 4 | 0 | 0 | 0 | N/A |
| FUBP1 | 68 | 24 | 24 | 23 | 5 | 2 | 2 | 7.9 |
| KHSRP | 73 | 87 | 91 | 84 | 15 | 12 | 9 | 7.3 |
| FUBP3 | 62 | 8 | 7 | 5 | 0 | 0 | 1 | 6.7 |
| ELAVL1 | 36 | 6 | 3 | 3 | 0 | 0 | 2 | 6.0 |
| CSTF1 | 48 | 122 | 133 | 135 | 27 | 26 | 18 | 5.5 |
| SYMPK | 141 | 4 | 7 | 5 | 1 | 0 | 0 | 5.3 |
| SF1 | 68 | 54 | 61 | 65 | 14 | 15 | 14 | 4.2 |
| HNRNPM | 78 | 20 | 23 | 19 | 6 | 5 | 4 | 4.1 |
| PUF60 | 60 | 46 | 55 | 52 | 16 | 18 | 15 | 3.1 |
| CPSF1 | 161 | 29 | 28 | 35 | 10 | 10 | 10 | 3.1 |
| CPSF2 | 88 | 39 | 40 | 38 | 15 | 14 | 13 | 2.8 |
| SCAF11 | 165 | 85 | 89 | 72 | 36 | 37 | 33 | 2.3 |
| Protein ID | Mass (kDa) | Sense | Antisense | Enrichment | ||||
|---|---|---|---|---|---|---|---|---|
| IFIT3 | 56 | 4 | 7 | 4 | 0 | 0 | 0 | N/A |
| LARS1 | 134 | 16 | 16 | 9 | 1 | 0 | 0 | 13.7 |
| IFIT1 | 55 | 10 | 12 | 11 | 1 | 1 | 1 | 11.0 |
| QARS1 | 88 | 15 | 14 | 14 | 2 | 1 | 2 | 8.6 |
| AIMP1 | 34 | 8 | 9 | 5 | 1 | 0 | 1 | 7.3 |
| MARS1 | 101 | 17 | 16 | 10 | 2 | 2 | 3 | 6.1 |
| HNRNPK | 51 | 22 | 22 | 17 | 5 | 5 | 3 | 4.7 |
| RARS1 | 75 | 23 | 13 | 15 | 3 | 3 | 5 | 4.6 |
| KARS1 | 68 | 48 | 35 | 45 | 12 | 9 | 9 | 4.3 |
| PCBP2 | 39 | 4 | 3 | 4 | 0 | 1 | 0 | 3.7 |
| FUBP1 | 68 | 31 | 38 | 37 | 12 | 10 | 11 | 3.2 |
| IARS1 | 145 | 36 | 40 | 34 | 13 | 10 | 13 | 3.1 |
| SART3 | 110 | 12 | 11 | 7 | 4 | 3 | 3 | 3.0 |
| PUF60 | 60 | 16 | 22 | 20 | 7 | 6 | 10 | 2.5 |
| U2AF2 | 54 | 13 | 11 | 11 | 6 | 6 | 2 | 2.5 |
| DARS1 | 57 | 21 | 19 | 20 | 9 | 7 | 10 | 2.3 |
| LRPPRC | 158 | 138 | 141 | 141 | 68 | 62 | 55 | 2.3 |
| EPRS1 | 171 | 35 | 35 | 18 | 12 | 14 | 13 | 2.3 |
| SF3B3 | 136 | 8 | 11 | 7 | 3 | 4 | 5 | 2.2 |
| Gene | Function | Literature |
|---|---|---|
|
| Oligoadenylate synthetase 1; recognizes viral dsRNA and activates RNase L degradation and inhibit translation | ( |
|
| Binds with eukaryotic initiation factor 3 (eIF3) to block translation; also binds directly to non-self RNAs to inhibit their translation | ( |
|
| Ubiquitin-conjugating enzyme E2 L6; role in protein degradation and ISGylation | ( |
|
| Transporter associating with antigen processing; transports cytosolic peptides into the ER for presentation by MHC class I molecules | ( |
|
| E3 ubiquitin ligase; negatively regulates TLR3-mediated type I IFN signaling by targeting TRIF for degradation | ( |
|
| Involved in lipid transport and metabolism; also involved in maintaining airway epithelial layer integrity | ( |
|
| ER-localized aminopeptidase that plays a role in antigenic peptide editing quality control | ( |
|
| Cysteine-aspartic acid protease; proteolytically cleaves and activates the pro-inflammatory cytokines IL-1β and IL-18 | ( |
|
| Binds with eukaryotic initiation factor 3 (eIF3) to block translation; also binds directly to non-self RNAs to inhibit their translation | ( |
|
| GTPase guanylate-binding protein; forms an antimicrobial coat to capture cytosol-invasive bacteria and pathogen-containing vacuoles | ( |
- —National Institute of Allergy and Infectious Diseaseshttp://dx.doi.org/10.13039/100000060
Peer Reviews
No public reviews on file for this paper yet. If you reviewed it on a platform where reviews are public (OpenReview, ICLR, NeurIPS, ICML), you can paste yours below so the community can read it here.
Videos
No videos yet. Explain this paper in a talk, walkthrough, or lecture? Add one.
Taxonomy
TopicsCancer-related molecular mechanisms research · interferon and immune responses · RNA regulation and disease
INTRODUCTION
Noncoding RNAs are known to be major regulators of cellular processes, such as ribosomal RNA (rRNA) and transfer RNA (tRNA), which are critical for protein synthesis (1, 2), as well as small nuclear RNA (snRNA) and small nucleolar RNA (snoRNA), which are critical for splicing and RNA modification (3, 4). The largest class of noncoding RNAs is long noncoding RNAs (lncRNAs), defined as transcripts greater than 500 nucleotides in length with low translational potential (5). The recent GENCODE V47 release estimates 35,934 lncRNA genes in the human genome (6). However, despite the large number of annotated lncRNAs, their functions are still widely unknown.
Individual lncRNAs have been identified to have significant functions within biological processes such as cell development (7), cancer (8), and inflammation (9) by regulating processes such as gene transcription and protein translation (10). There is also growing evidence that lncRNAs play important roles within antiviral and immune responses (11). For example, a recent study in 2023 identified that the overexpression of an lncRNA, LncRNA#61, inhibited influenza A virus (IAV) replication in human cells and even reduced viral replication in vivo after lipid nanoparticle-encapsulated delivery of LncRNA#61 in mice (12). As regulatory RNAs such as lncRNAs have low translational potential, they often function by interacting with RNA-binding proteins (RBPs) to regulate transcription (13) or act as scaffolds for protein interactions (14). While many lncRNAs have been found to act as cis regulators by regulating the expression of neighboring protein-coding genes (15), lncRNAs have also been found to function as trans regulators by regulating transcription on different chromosomes (16). Some lncRNAs can act in both cis and trans, such as lincRNA-Cox2 that was found to regulate its neighboring gene, Ptgs2, as well as a subset of immune genes in trans using mouse models (17). In addition, a single lncRNA can have multiple functions in different cellular compartments, such as PYCARD-AS1 that facilitates DNA methylation at the PYCARD promoter in the nucleus, as well as interacts with PYCARD mRNA in the cytoplasm to inhibit ribosome assembly (18). Therefore, understanding the RBP interactions of an lncRNA can help elucidate how it functions within the cell.
We previously identified a novel lncRNA named virus-inducible lncRNA modulator of interferon response (VILMIR) that was found to regulate the host transcriptional response to both interferon-beta (IFN-β) treatment and IAV infection in A549 human lung epithelial cells (19). We found that VILMIR did not regulate transcription of its neighboring protein-coding genes but rather had a broad transcriptional regulation; however, the exact mechanism of this regulation was not explored. Therefore, in this study, we aimed to identify interacting proteins and gene regulatory networks of VILMIR to better understand its molecular interactions and how it regulates the interferon response in trans. Using an RNA-pull down assay, we found that VILMIR interacts with several proteins in A549 nuclear and cytoplasmic lysates, including the transcriptional regulators FUBP1 and PUF60, as well as antiviral proteins IFIT1 and IFIT3 and aminoacyl-tRNA synthetases (ARSs) QARS1 and KARS1. In addition, we overexpressed VILMIR in A549 cells and found that the overexpression resulted in an overall enhancement of host interferon response genes, supporting our hypothesis that VILMIR plays an activating role in the host interferon response. By combining RNA-seq analyses from both VILMIR knockdown (KD) and overexpression studies, we further identified a core set of genes that are consistently regulated by VILMIR perturbation in trans. Finally, we proposed several potential models of VILMIR function, suggesting that VILMIR may function in both the nucleus and the cytoplasm to regulate host interferon responses.
MATERIALS AND METHODS
Cell culture
The human cancer cell line, A549 lung epithelial (CCL-185), was purchased from American Type Culture Collection (ATCC, Manassas, VA, USA). Human embryonic kidney (HEK) epithelial 293 FT cells were ordered from Invitrogen (ThermoFisher Scientific). A549 cells were maintained in F-12K media with 10% fetal bovine serum (FBS). HEK 293 FT cells were maintained in DMEM media plus 1% GlutaMAX and 10% FBS. All cell lines were kept at 37°C in a 5% CO_2_ incubator and maintained in culture, as recommended by the ATCC.
Protein extraction
In order to collect protein lysates for subsequent RNA pull-down assay, confluent T182 flasks of A549 cells were washed with 1X Dulbecco’s phosphate-buffered saline and treated with fresh A549 media containing 1 ng/mL human IFN-β recombinant protein (R&D Systems 8499IF010) for 6 hours. Nuclear and cytoplasmic protein lysates of the cells were extracted using NE-PER Nuclear and Cytoplasmic Extraction Reagents (Thermo Scientific) according to the manufacturer’s instructions. Relative protein quantification was determined using absorbance at 280 nm by comparison with a bovine serum albumin (BSA) standard curve.
RNA pull-down assay and mass spectrometry
Full-length VILMIR (Table S1) or its antisense sequence was cloned into the pGEM-3Z vector (Promega) downstream of the T7 promoter using EcoRI and BamHI restriction enzyme sites. The plasmids were linearized with BamHI on the 3′ end in order to facilitate in vitro transcription. Biotinylated RNA probes were *in vitro-*transcribed by the T7 RNA polymerase using the TranscriptAid T7 High Yield Transcription Kit (Thermo Scientific) and a 1:39 molar ratio of Biotin-16-UTP (ApexBio Technology) to standard UTP. Subsequent RNA was purified using the RNeasy Plus Mini Kit (Qiagen) with a genomic DNA eliminator column, and the size was determined with an Agilent Bioanalyzer or TapeStation 4150.
The pull-down assay was adapted for RNA from Springer Protocols (20). Briefly, 1.5 mg of prewashed Dynabeads M-280 Streptavidin (Invitrogen) was incubated with 25 µg of VILMIR sense or antisense RNA probes at room temperature with agitation for 30 min. Excess biotinylated RNA probe was removed from the bead-probe complex by several washes. Approximately 3.6 mg of nuclear or 5.3 mg of cytoplasmic protein lysate from A549 cells was incubated with 12.5 µg of antisense bead:probe complexes at 4°C, with agitation for 30 min as a preclearing step. Precleared lysates were then incubated with VILMIR sense or antisense bead:probe complexes with 50 µg tRNA competitor (Thermo Scientific) and 300 U of SUPERase·In RNase Inhibitor (Invitrogen) at 4°C with agitation for 1 h. Bead:probe:protein complexes were washed three times in washing buffer, eluted in water at 70°C for 5 min, and boiled in Laemmli buffer at 95°C for 10 min. The pull-down assay was performed in triplicate for both sense and antisense reactions.
The supernatant was run on a 6% SDS-PAGE gel for approximately 10 min, and then the gel was stained with Coomassie blue and destained to excise and prepare the samples for protein identification by mass spectrometry. Mass spectrometry was performed by the BIDMC-Harvard Mass Spectrometry Facility and Asara Laboratory using the Thermo Scientific QExactive HFx Orbitrap nano HR-LC-MS/MS following in-gel digestion of proteins with Trypsin/LysC.
To identify VILMIR sense-specific binding proteins in the nucleus or cytoplasm, we first averaged the peptide spectrum counts in the sense and antisense replicates and then calculated an approximate fold-change (FC) value by taking the difference between the sense and antisense peptide counts (sense/antisense). Proteins that were evenly distributed between the sense and antisense samples (i.e., FC of 1), enriched in the antisense samples (FC <1), or whose replicates had inconsistent counts were eliminated. VILMIR sense-specific bound proteins were identified as those proteins that had protein peptide spectrum counts in all three replicates of the sense RNA but none in the antisense replicates (unique binding), or whose peptide spectrum counts were enriched (FC >1) in the sense replicates over the antisense replicates (enriched binding). These remaining proteins were narrowed down further by removing proteins with an FC <2 in the sense replicates, as well as focusing on proteins with known associations with interferon and antiviral responses.
Western blotting
Identified proteins from mass spectrometry were confirmed by Western blot after a pull-down assay, as described above. The starting protein lysate for VILMIR sense and antisense pull-down assay was standardized before pull-down. After pull-down, an equal volume of the eluted protein from the sense and antisense pull-down was loaded into 10% SDS-PAGE gels and transferred to polyvinylidene difluoride (PVDF) membranes (Invitrogen). Membranes were blocked for either 1 h at room temperature or 4°C overnight in 1× Tris-Buffered Saline (TBS) with 1% (wt/vol) casein and then incubated in primary antibody diluted in blocking buffer for 1 h at room temperature. The following primary antibodies were used: anti-FUBP1 1:1,000 (Proteintech, 24864-1-AP), anti-PUF60 1:1,000 (Proteintech 10810-1-AP), anti-PCNA 1:5,000 (Proteintech, 10205-2-AP), anti-IFIT1 1:500 (Cell Signaling Technology, #14769), anti-IFIT3 1:2,000 (Proteintech, 15201-1-AP), anti-GlnRS (or QARS1) 1:2,000 (Proteintech 12645-1-AP), anti-KARS 1:1,000 (Proteintech 14951-1-AP), and anti-GAPDH 1:5,000 (Proteintech, 10494-1-AP). Membranes were rinsed 2× and washed 2× for 5 min each in TBS buffer with 0.05% Tween 20 (TBS-T) and then incubated in Goat anti-Rabbit IgG (H + L) secondary antibody, HRP conjugate (Invitrogen #31460) diluted 1:5,000 in blocking buffer for 30 min at room temperature. Membranes were rinsed 3× and washed 3× for 5 min each in TBS-T buffer and then detected by chemiluminescence using either Pierce ECL Substrate (Thermo Scientific) for the FUBP1 and PCNA blots or SuperSignal West Atto Ultimate Sensitivity Substrate (Thermo Scientific) for the remaining blots, according to the detection limits of the protein. The blots were visualized using a Bio-Rad ChemiDoc MP Imaging System. Densitometry analysis was performed using ImageJ software where applicable. Briefly, the background was subtracted, and the density of each band was measured. In order to estimate a relative FC between the sense and antisense protein interactions, the sense and antisense bands were then normalized to their input band, and the average FC of three independent replicates was calculated. With FUBP1, PUF60, and QARS1 that displayed several bands, all bands were included so as to not bias the analysis. FUBP1 and PUF60 were not included in the densitometry analysis as the antisense band was too low to obtain an accurate density.
Interferon treatment
Following the same methods as 19, A549 cells were seeded overnight between 150,000 and 175,000 cells per well in 12-well plates in 1.5 mL media. The following day, the cell monolayer was washed with 1× DBS and treated with fresh A549 media with or without human IFN-β recombinant protein at the indicated concentrations. All cells were harvested at 6 hours after treatment according to the TRIzol Reagent User Guide (Invitrogen).
RNA isolation and quantitative PCR
Total RNA was isolated from cells following the TRIzol isolation method (Invitrogen) and quantified using NanoDrop spectrophotometry. One microgram of RNA was reverse-transcribed into cDNA using the QuantiTect Reverse Transcription Kit (Qiagen) containing both oligo-dT and random primers. Quantitative PCR (qPCR) was performed on the cDNA using PowerUp SYBR Green Master Mix (Applied Biosystems). Relative expression of the indicated RNAs was determined using the ΔΔCt method with GAPDH as an endogenous control. Statistical analysis of significance was performed in JMP Pro 16 software (SAS Institute Inc., Cary, NC). The primer sequences used in this study are as follows: GAPDH F: GGTATCGTGGAAGGACTCATGAC; GAPDH R: ATGCCAGTGAGCTTCCCGTTCAG (21); VILMIR F: GCTCCACCCTGAAAGTC; VILMIR R: CTACACAGTGCTGAGGAAA (19).
Plasmid construction and overexpression of VILMIR
The pSico bidirectional expression vector was a gift from Susan Carpenter and described in 22. Full-length VILMIR was cloned into the pSico vector with an EF1a promoter expressing zeocin resistance and GFP as a selection marker, using PspXI and NotI restriction enzyme sites. The sequence was confirmed by Sanger sequencing. To produce lentivirus, HEK-293FT cells were co-transfected with the pSico vector expressing VILMIR and lentiviral vectors, psPAX2 (Addgene #12260) and pMD2.G (Addgene #12259) using the Lipofectamine 3000 Reagent (Invitrogen). In addition, an empty pSico vector was transfected as a negative control. The viral supernatant was collected 72 h post-transfection and filtered through a 0.22 µM syringe filter. A549 cells were transduced with the lentivirus, and stable integrants were sorted based on GFP expression at the UNC Flow Cytometry Core Facility (Chapel Hill, North Carolina) using a Becton Dickinson FACSAria II. The successful overexpression of VILMIR was confirmed by RT-qPCR.
cDNA library construction, RNA-sequencing, and Ingenuity Pathway Analysis (IPA)
mRNA sequencing was performed in biological triplicate in A549 VILMIR-overexpressing and control cell lines treated with mock or either 1 ng/mL or 10 ng/mL human IFN-β for 6 h. Total RNA was isolated from cells following the TRIzol isolation method (Invitrogen). All samples were quantified and assayed to confirm a minimum RNA integrity number of at least 9.7 using an Agilent TapeStation 4150. Next, 500 ng of total RNA per sample underwent mRNA capture and was then fragmented at 94°C for 6 min. Sequencing libraries were prepared according to the manufacturer’s protocol using 11 cycles of final amplification (KAPA mRNA HyperPrep Kit, catalog no. KK8580 and KAPA UDI Adapter Kit, catalog no. KK8727). Libraries underwent QC prior to sequencing using an Agilent TapeStation 4150. Next-generation sequencing was performed on a Complete Genomics DNBSEQ-G400C (150 bp paired end) to a targeted depth of ~20 million reads per sample. The sequencing data from VILMIR KD in 19 were also incorporated.
Complete genomics RNA-seq reads were mapped against the Hg38 using STAR version 2.7.9 a (23). Custom STAR parameters were set as follows: limitOutSAMoneReadBytes: 1,000,000, outSAMprimaryFlag: AllBestScore, outFilterType: BySJout, alignSJoverhangMin: 8, alignSJDBoverhangMin: 3, outFilterMismatchNmax: 999, alignIntronMin: 20, alignIntronMax: 1,000,000, alignMatesGapMax: 1,000,000, and outFilterMultimapNmax: 20; otherwise, default STAR parameters were used. Following read mapping, a count matrix was generated from the STAR results using R. Genes were removed from the matrix if they did not have at least 30 reads in a minimum of three samples from either the perturbation group (KD or overexpression) or the control group. Counts were normalized using the TMM normalization method via the calcNormFactors function in edgeR version 3.40.2 (24).
To conduct our differential gene expression analysis, we utilized the limma-trend approach from Limma version 3.54.2 (25). For each dose level of the IFN-β treatment, we assessed differential expression by comparing each KD or overexpression condition to its respective mock treatment. We then contrasted the differential expression results of each KD or overexpression (STAT1g1/1 ng IFN-β vs STAT1g1/Mock, VILMIRg1/1 ng IFN-β vs VILMIRg1/Mock, etc.) against that of its corresponding control (Ctrl/1 ng IFN-β vs Ctrl/Mock, Ctrl/10 ng IFN-β vs Ctrl/Mock). Genes were considered differentially expressed in a given contrast if their unadjusted P-value was less than 0.05 with no FC requirement. To identify IFN-responsive genes, we further filtered these results by requiring a log2FC greater than 1.25 following IFN-β treatment in the control cell lines for each experiment. Differential expression results were visualized using the ComplexHeatmap R package version 2.14.0 (26).
Pathway enrichment analysis was generated using QIAGEN Ingenuity Pathway Analysis (IPA) (27). A raw P-value cutoff of <0.05 was used to define genes with significant expression changes after VILMIR overexpression in each IFN-β treatment. Canonical pathways analysis identified the pathways from the QIAGEN IPA library of canonical pathways that were most significant to the data set. Differentially expressed genes from the data set that met the P-value cutoff of 0.05 (−log10 P-value 1.3) and were associated with a canonical pathway in the QIAGEN Knowledge Base were considered for the pathway analysis. A right-tailed Fisher’s exact test was used to calculate a P-value determining the probability that the association between the genes in the data set and the canonical pathways is explained by chance alone.
RESULTS
LncRNA VILMIR can interact with nuclear and cytoplasmic proteins from A549 epithelial cells in vitro, including FUBP1, PUF60, IFIT1, IFIT3, QARS1, and KARS1
To identify potential protein interactions of VILMIR, we performed an RNA pull-down assay. As VILMIR was localized in both nuclear and cytoplasmic compartments in A549 human lung epithelial cells (19), we investigated its potential protein interactions in both compartments. *In vitro-*transcribed biotinylated VILMIR as well as antisense VILMIR control RNA were incubated with nuclear or cytoplasmic lysates of A549 cells treated with IFN-β to mimic cellular interactions during a host interferon response. Interacting RBPs were then identified by mass spectrometry. The full list of identified proteins was narrowed down by prioritizing proteins that either uniquely interacted with VILMIR sense RNA compared to antisense RNA or were greater than two times enriched in the VILMIR sense RNA compared to antisense RNA according to peptide spectrum counts (see Materials and Methods). From these criteria, we identified 19 proteins in each compartment that were either unique to or enriched in the VILMIR sense RNA ([Tables 1 and 2](#T1 T2)). This suggests that VILMIR may have functions in both compartments.
In the nuclear A549 lysate, VILMIR sense RNA was found to interact with several proteins involved in pre-mRNA splicing and processing (CSTF1, CSTF2, CSTF3, CELF1, CPSF7, SYMPK, SF1, HNRNPM, CPSF1, CPSF2, and SCAF11), as well as transcriptional regulation (TARDBP, FUBP1, KHSRP, FUBP3, and PUF60). Using Western blot analysis, we confirmed the interaction of VILMIR sense RNA with FUBP1 and PUF60 (Fig. 1A). FUBP1, or Far Upstream Element-Binding Protein 1, acts as a transcriptional regulator and is a well-known activator of the c-Myc oncogene (28). While FUBP1 is primarily located in the nucleus, it has been found to translocate to the cytoplasm (29) and was also identified in our cytoplasmic mass spectrometry results (Table 2). To negatively control the expression of c-Myc, FUBP1 also interacts with the FUBP-Interacting Repressor (FIR), which is an alternatively spliced variant of Poly(U)-Binding Splicing Factor 60 (PUF60), meaning that FUBP1 can be involved in both positive and negative regulation of gene expressions (28).
*VILMIR sense RNA interacts with nuclear and cytoplasmic proteins from the A549 lysate. An RNA pull-down assay was performed by incubating in vitro-transcribed VILMIR sense RNA or antisense RNA (negative control) with nuclear or cytoplasmic lysates from IFN-treated A549 cells. Interacting proteins were identified by mass spectrometry. The full list of identified proteins can be found in Tables 1 and 2. (A) The interaction of VILMIR sense RNA with FUBP1 and PUF60 was confirmed by Western blot. PCNA was used as a negative nuclear control, and the input protein was diluted 1:4. (B) The interaction of VILMIR sense RNA with IFIT1 and IFIT3 was confirmed by Western blot with GAPDH as a negative cytoplasmic control, and the input protein was diluted 1:40. Densitometry analysis of IFIT1 and IFIT3 protein bands in the Western blots is displayed below the blots. (C) The interaction of VILMIR sense RNA with QARS1 and KARS1 was confirmed by Western blot, and the input protein was diluted 1:2. Densitometric analysis of QARS1 and KARS1 protein bands in the Western blots is displayed below the blots. All Western blots are representative of three independent replicates. An equal volume of the sense and antisense pull-down protein was loaded into the gel, and the input lane was included to estimate a relative FC between sense and antisense protein interaction. The labeled size in kilodaltons (kDa) denotes the major band for each protein, as well as a triangle for proteins that display multiple bands. FUBP1 has known shorter isoforms (30), while the additional bands for PUF60 and QARS1 are likely background bands. All bands were included so as not to bias the analysis. Proteins were detected by chemiluminescence using either Pierce ECL Substrate (Thermo Scientific) for the FUBP1 and PCNA blots (A) or SuperSignal West Atto Ultimate Sensitivity Substrate (Thermo Scientific) for the remaining blots (PUF60 in A and B–C). Densitometry analysis was not performed for panel A as the antisense band was too low to obtain an accurate density. *P < 0.05, **P < 0.01, and **P < 0.001 (Student’s t-test).
Interestingly, in the cytoplasmic A549 lysate, VILMIR sense RNA interacted with IFIT1 and IFIT3 proteins more than the antisense RNA (Table 2). The IFIT protein family, or IFN-induced protein with tetratricopeptide repeats, includes IFN-stimulated genes (ISGs) that get induced during antiviral immune responses and consist of IFIT1, IFIT2, IFIT3, and IFIT5 in humans (31). The IFIT proteins are well-known to inhibit translation of both cellular mRNA and viral RNA by either interacting with eukaryotic initiation factor 3 (eIF3) to block translation (32) or by binding directly to the 5′ end of nonself RNAs (33, 34). While IFIT2 and IFIT5 were not identified as VILMIR-interacting proteins in the mass spectrometry, the interaction of VILMIR sense RNA with IFIT1 and IFIT3 proteins was confirmed by Western blot and densitometry analysis (Fig. 1B). In addition, VILMIR sense RNA was found to interact with eight ARSs, which are enzymes responsible for pairing tRNAs with amino acids during translation, as well as ARS-interacting multifunctional protein 1 (AIMP1), which helps form the multi-tRNA synthetase complex (35) (Table 2). Two of these ARSs were confirmed by Western blot and densitometry analysis, QARS1 or glutaminyl-tRNA synthetase 1, and KARS1 or lysyl-tRNA synthetase 1 (Fig. 1C). Therefore, while several nuclear and cytoplasmic protein interactions were confirmed in vitro and in the cells, these results suggest that VILMIR could function in the nucleus by interacting with proteins such as FUBP1 and PUF60 to regulate transcription or in the cytoplasm by interacting with IFIT1 and IFIT3 and/or QARS1 and KARS1 to regulate translation.
VILMIR overexpression results in minimal fold change differences before interferon-β treatment in A549 epithelial cells
As our pull-down assay suggested that VILMIR could function through the transcript itself, we were interested in whether the overexpression of VILMIR in cells would cause significant changes in expression, both before and after IFN-β treatment. Therefore, we generated an A549 cell line overexpressing ectopic VILMIR and performed RNA-sequencing (RNA-seq) analysis of overexpressing cells treated with or without two separate concentrations of human IFN-β. Compared to the control cell line with an empty vector, we observed a 7.5-fold increase in the baseline expression of VILMIR (Fig. 2A). We first examined if VILMIR alone caused significant expression differences outside of an IFN response by comparing gene expression in the mock-treated cell lines. Using an adjusted P-value < 0.05, the only gene with a significant expression difference in the mock-treated cells after VILMIR overexpression was VILMIR itself. Therefore, the control cell line and VILMIR-overexpressing cell line appeared very similar in gene expressions before IFN-β treatment. When this analysis was expanded to use a relaxed criterion for differential expression analysis (raw P-value < 0.05 and no FC cutoff), we identified 459 genes that showed altered expression changes in the VILMIR-overexpressing cell line compared to the control cell line in the mock treatment (Fig. 2B).
*Overexpression of VILMIR. (A) A549 cells were transduced with a vector expressing ectopic VILMIR or an empty-vector control and treated with mock or 10 ng/mL human IFN-β for 6 h. Relative expression of VILMIR was determined by RT-qPCR and normalized to the mean of the mock-treated control cell line. Data were normalized to GAPDH using the ΔΔCt method and expressed as means ± SE (n = 3). **P < 0.01; **P < 0.001 (Student’s t-test). (B) RNA-seq analysis was performed to identify genes that showed altered expression changes after VILMIR overexpression in the mock- and IFN-treated cells. Displayed are points representing 459 genes that exhibited significant changes in expression in the VILMIR-overexpressing cell line compared to the control cell line in the mock-treated cells (raw P-value < 0.05). The x-axis indicates the log2FC difference between each gene in the VILMIR-overexpressing cells versus the control cells in the mock (VILMIR mock v Ctrl mock log2FC), while the y-axis represents the log2FC of those same genes after 10 ng/mL IFN-β treatment in the control cell line. The five most differentially expressed genes are labeled in either red (upregulation) or blue (downregulation), as well as four other interferon-stimulated genes (ISGs) of interest in black.
Interestingly, there were several ISGs impacted by VILMIR overexpression in the mock-treated cells, including MX1, IFIT1, and IFIT2, the expressions of which were slightly downregulated, as well as IFI6, the expression of which was slightly upregulated (Fig. 2B). This may suggest that VILMIR expression regulates ISGs before IFN treatment. However, when plotting these same genes against their log2 fold change (log2FC) after IFN-β treatment in the control cell line, we observed that the log2FC differences between the mock-treated cell lines were relatively small in comparison. In fact, only 14% of the total 459 genes exhibited absolute FC greater than 1.5, and five genes exhibited an absolute FC greater than 2 (Fig. 2B). Apart from VILMIR itself, which was the highest upregulated gene as expected, the expressions of RNS7SL3, GBP1, and TUBA8 were upregulated and that of CFLAR-AS1 was downregulated with an FC greater than 2 (Fig. 2B). As VILMIR was transcribed ectopically from an overexpression vector, this suggests that VILMIR can function through its transcript, rather than just transcription at its genomic locus. In addition, these results suggest that VILMIR may have a regulatory role outside of the IFN response, particularly with transcription of RNS7SL3, GBP1, TUBA8, and CFLAR-AS1. However, as the majority of expression differences caused by VILMIR in the mock-treated cells were relatively small, we sought to determine the impact of VILMIR overexpression on host transcription in response to IFN-β treatment.
Overexpression of VILMIR enhances the host transcriptional response to interferon-β treatment in A549 epithelial cells
Next, we determined the impact of VILMIR overexpression on the host transcriptional response to IFN-β treatment using the same RNA-seq analysis described above. When using an adjusted P-value < 0.05, the only gene that showed an altered expression change to IFN-β treatment after VILMIR overexpression was VILMIR itself. Therefore, to investigate the potentially broad regulatory roles of VILMIR, similarly as in our previous study (19), we used a relaxed criterion for differential expression analysis, i.e., raw P-value < 0.05, which allowed us to observe the overall trend of the transcriptional response after VILMIR overexpression. Using this criterion, we identified 731 genes that showed altered expression changes to IFN-β treatment after VILMIR overexpression in at least one of the two doses of IFN-β (Table S2). When analyzing the host transcriptional response to IFN-β, we observed larger FC differences after VILMIR overexpression, with 33%–35% of differentially expressed genes (DEGs) exhibiting absolute FCs greater than 1.5 in either IFN-β treatment, compared to 14% in the mock treatment, indicating that VILMIR overexpression has larger impacts during an IFN response. However, similarly to our previous study (19), the magnitude of expression changes was relatively small, with gene expression changing by an average of 1.4-fold after VILMIR overexpression compared to the control.
To identify canonical pathways enriched in the DEGs impacted by VILMIR overexpression, QIAGEN IPA was performed (27). There were 17 canonical pathways significantly enriched in the overexpression cell line in both IFN-β treatments with a raw enrichment P-value < 0.05 (−log10 P-value > 1.3), with the most significant of these pathways being the interferon alpha/beta signaling pathway (Fig. 3A; Table S3). In addition, IPA predicted an overall activation of this pathway, with positive z-scores of 2.121 and 1 for the 1 ng/mL and 10 ng/mL IFN-β treatments, respectively. The majority of the genes represented in this pathway, such as MX1, IFIT2, IRF7, IFIT1, RNASEL, TYK2, and OAS1, had higher FCs after VILMIR overexpression compared to the control cell line, besides IFITM1, which had a lower FC (Fig. 3B and C). However, it is possible that IFITM1 could serve as a negative regulator as it has previously been found to be a negative regulator in certain contexts, with suppression of IFITM1 inhibiting proliferation in glioma cells (36). The overall enhancement of genes within the IFN pathway after VILMIR overexpression is consistent with our previous findings that VILMIR KD suppressed ISGs (19), supporting our hypothesis that VILMIR plays an activating role in the host interferon response.
*Overexpression of VILMIR results in the enhancement of ISGs after IFN-β treatment in A549 cells. (A) RNA-seq analysis was performed to identify genes that showed altered expression changes to IFN-β treatment after VILMIR overexpression in at least one of two doses of IFN-β (raw P-value < 0.05). QIAGEN IPA was then performed to identify canonical pathways significantly enriched in the DEGs impacted by VILMIR overexpression after 1 ng/mL or 10 ng/mL IFN-β. Shown are the top 10 out of 17 significant pathways shared between both IFN-β treatments (Table S3). Enriched pathways that met the raw enrichment P-value < 0.05 (−log10 P-value cutoff of 1.3) using a right-tailed Fisher’s exact test and were associated with a canonical pathway in the QIAGEN Knowledge Base were included here (*P < 0.05 included as the reference). (B) Displayed are the DEGs in the interferon alpha/beta signaling network according to IPA, along with their log2FC values after both IFN-β treatments in the Ctrl and VILMIR overexpression cell lines. (C) The difference in log2FC of the same genes is shown between VILMIR and Ctrl cell lines (VILMIRvCtrl). *P < 0.05; *P < 0.01.
VILMIR knockdown and overexpression consistently regulate the transcription of a core set of interferon-stimulated genes in A549 epithelial cells
In order to identify a core set of genes that were differentially expressed in response to IFN-β treatment after both VILMIR overexpression and KD, we next combined the RNA-seq analysis of VILMIR overexpression with our previous analysis of VILMIR KD (19), which included two A549 VILMIR KD cell lines (VILMIRg1 and VILMIRg2) as well as a STAT1 KD cell line (STAT1g1) as a positive control for interferon response, treated with the same two IFN-β doses. To obtain a more robust set of genes that are IFN-responsive, we applied an additional filtering step of an FC greater than 1.25 after IFN-β treatment in the control cell lines for each experiment. After applying this criterion, we then examined expression changes after VILMIR KD or overexpression with a raw P-value < 0.05. This gave us a list of 132 IFN-responsive genes that showed altered expression changes to IFN-β treatment after either VILMIR KD or overexpression, in at least one of the two IFN-β doses (Fig. S1). Out of these genes, 96 were only differentially expressed after VILMIR KD, whereas 25 genes were only differentially expressed after VILMIR overexpression. This difference in the number of DEGs may be because the KD study contained two VILMIR KD cell lines, whereas the overexpression experiment only had a single VILMIR overexpression cell line. Another reason could be due to the difference in the method of gene perturbation as the KD targeted endogenous VILMIR, whereas the overexpression produced ectopic VILMIR transcripts lacking modifications. The remaining 11 out of 132 genes impacted by VILMIR perturbation were differentially expressed after both VILMIR KD and overexpression, which is what we chose to focus on (Fig. 4). One of these genes included VILMIR itself, which was expected.
Subset of ISGs that are differentially expressed after VILMIR knockdown and overexpression in A549 cells. Heatmap overview of the RNA-seq analysis of two independent experiments: VILMIR KD (VILMIRg1 and VILMIRg2), STAT1 KD (STAT1g1), or control (Ctrl) A549 gRNA cell lines; and VILMIR overexpression (VILMIR) or control (Ctrl) A549 cell lines, all of which were treated with mock or either 1 ng/mL or 10 ng/mL human IFN-β for 6 h (n = 3). The heatmap displays 11 human genes that exhibited significant changes in their responses to IFN-β treatment after both VILMIR KD and overexpression (OE), in at least one of two doses of IFN (raw P-value < 0.05). Rows are genes, and columns are conditions and comparisons. As shown by the labels at the bottom, the log2FC after IFN-β treatment in each cell line was first calculated (“IFN response”), and then the “KD effect” or “OE effect” was calculated by comparing the “IFN response” log2FC of each KD/OE line to the “IFN response” log2FC of the control cell line. Red color indicates a positive log2FC value (i.e., upregulation) in columns above the label “IFN response,” or higher log2FC values in KD/OE cells compared to that of control cells in columns above the label “KD effect.” The blue color indicates lower log2FC values in KD/OE cells compared to that of control cells in columns above the label “KD/OE effect.”
The 10 genes that were consistently impacted by VILMIR perturbation were OAS1, IFIT1, UBE2L6, TAP2, TRIM38, APOL2, ERAP2, CASP1, IFIT2, and GBP1, which have all been associated with interferon and antiviral responses in literature (Table 3). As expected, the expressions of these genes were all upregulated after IFN-β treatment in our A549 cell lines. However, after VILMIR KD, we observed an overall suppression of the expression of these genes, whereas after VILMIR overexpression, these same genes showed an increase in expression (Fig. 4). The opposite trend was true for UBE2L6, which showed an increase in the VILMIR KD lines and a decrease in the VILMIR overexpression line. However, one reason for this opposite trend may be that UBE2L6, a ubiquitin-conjugating enzyme, can be a negative regulator in certain contexts, such as inhibiting autophagy in cancer cells (37). Additionally, GBP1 was decreased in both VILMIR KD and overexpression after IFN-β treatment. However, as GBP1 was already upregulated in response to VILMIR overexpression before IFN-β treatment, it is possible that VILMIR upregulates GBP1 independently of IFN responses (Fig. 4, “Overexpression” mock column, as well as in Fig. 2B), which explains why the addition of IFN in the overexpression cell line results in a smaller FC. This is also true of VILMIR itself, which shows a negative FC difference in the IFN-treated overexpression cells. However, because VILMIR is already highly upregulated before IFN-β treatment in the overexpression cells, the addition of IFN-β does not result in a higher FC compared to the control cells. Finally, as all 10 genes consistently regulated by VILMIR are located on different chromosomes than VILMIR, these results suggest that VILMIR is a trans regulator of gene expression.
DISCUSSION
We previously identified the human lncRNA VILMIR as a novel ISG during viral infection and found that KD of VILMIR in A549 cells resulted in a suppression of the host transcriptional response to IFN-β treatment and IAV infection. However, the mechanism by which VILMIR regulates the host interferon response was not explored. Therefore, in this study, we aimed to identify potential protein interactions as well as gene regulatory networks of VILMIR to better understand its molecular interactions and propose models of how it may function during an interferon response.
Using an RNA pull-down assay and mass spectrometry, we found that VILMIR RNA interacted with several proteins in nuclear and cytoplasmic lysate from A549 epithelial cells treated with IFN-β. As we previously determined that VILMIR is distributed in both the nucleus and the cytoplasm (19), these new results further support that VILMIR may function in both compartments through protein interactions. Several lncRNAs have also been found to have dual functions in the nucleus and cytoplasm (18, 46–48). For example, lncRNA HOTAIR can function in the nucleus to regulate gene expression by interacting with histone methyltransferases (46), whereas in the cytoplasm, it can act as a competing endogenous RNA (ceRNA) by interacting with microRNAs (miRNAs) and regulating translation (47). Therefore, it is possible that VILMIR could function through different mechanisms in each compartment as well.
Since the KD of VILMIR in A549 cells resulted in a suppression of the host transcriptional response to IFN-β treatment and IAV infection, we predicted that VILMIR may activate the host IFN-β response (19). Here, we analyzed the impact of VILMIR overexpression during IFN-β treatment. Using RNA-seq analysis, we identified 731 genes that showed altered expression changes to IFN-β treatment after VILMIR overexpression in at least one of the two doses of IFN-β. These DEGs were enriched for the interferon alpha/beta signaling pathway and displayed an overall enhancement of several ISGs after VILMIR overexpression, strongly supporting our hypothesis that VILMIR activates the host IFN response.
By combining our VILMIR KD and overexpression RNA-seq analysis, we obtained a list of 10 IFN-responsive genes with significant expression changes after both VILMIR knockdown and overexpression. Interestingly, seven of the ten genes have known functions related to translational regulation, post-translational regulation by ubiquitination, or protease activity*—OAS1*, IFIT1, UBE2L6, TRIM38, ERAP2, CASP1, and IFIT2. This may mean that VILMIR has a regulatory role within translational control or protein processing, which are important cellular processes during a viral infection, as the host translation is tightly regulated in order to limit viral propagation (49). These results were also interesting given our pull-down assay that confirmed the interaction of VILMIR with several proteins involved in translation regulation in vitro, such as IFIT1, IFIT3, QARS1, and KARS1. Therefore, it is possible VILMIR could be regulating ISG expression in the nucleus to modulate their protein abundances, as well as interacting with translational machinery in the cytoplasm. Future work is necessary to determine the potential impact of VILMIR on global translation, such as by proteomic analysis or ribosome profiling (50).
Proposed models of VILMIR function
Taking these results together, we suggest several potential models for the function of VILMIR that should be further explored. First, as VILMIR was found to interact with FUBP1 and PUF60 in vitro, known transcriptional regulators in the nucleus (28), we suggest a mechanism by which VILMIR interacts with proteins such as FUBP1 and PUF60 to regulate gene transcription in trans (Fig. 5A), as we also observed that VILMIR KD and overexpression impacts the expression of genes through RNA-seq analysis. FUBP1 has been found to be both a positive regulator of transcription as well as a negative regulator through interacting with the repressor protein FIR or PUF60 (28) and has also been associated with virus infection (29, 51). A different lncRNA, NR-109, was previously found to interact with FUBP1 by preventing ubiquitin-mediated degradation of FUBP1 and thus activating c-Myc transcription (52). Therefore, as VILMIR overexpression resulted in an activation of ISGs, VILMIR may either act as a guide to recruit FUBP1 to enhance transcription or VILMIR could act as a decoy to prevent FIR/PUF60 from negatively regulating transcription.
Schematic diagram of potential models of VILMIR function in the nucleus and cytoplasm to regulate host interferon responses. (A) VILMIR may interact with FUBP1 and PUF60 in the nucleus to regulate gene transcription, either by acting as a guide to recruit FUBP1 to enhance transcription or as a decoy to prevent PUF60/FIR from negatively regulating transcription. (B) In the cytoplasm, VILMIR may interact with IFIT1 and/or IFIT3 to regulate the translation of cellular mRNA and viral RNA, either by the association of IFIT proteins with the 5′ end of RNAs or association with eIF3. (C) Additionally, VILMIR may act as a scaffold to help bridge the mitochondrial antiviral signaling (MAVS) complex and the TNFR-associated factor family member-associated NF-κB activator-binding kinase 1 (TBK1), which leads to phosphorylation of interferon response factor 3 (IRF3) and induction of IFN-β and ISG expression. (D) Finally, VILMIR may interact with QARS1 and KARS1 in the MSC to either positively or negatively regulate translation (figure created in https://BioRender.com).
In the cytoplasmic lysate, we confirmed the interaction of VILMIR with IFIT1 and IFIT3 in vitro. IFIT1 and IFIT3 are known to inhibit translation of both cellular mRNA and viral RNA by either interacting with eIF3 to block translation (32) or by binding directly to the 5′ end of non-self RNAs (33, 34). Therefore, we suggest a second model by which VILMIR either stabilizes the functions of IFIT1/3 to inhibit translation or interferes with their function to enhance translation (Fig. 5B). Apart from regulating translation, IFIT3 can also modulate interferon signaling by acting as a bridge between the MAVS complex and the TNFR-associated factor family member-associated NF-κB activator-binding kinase 1 (TBK1), which leads to phosphorylation of IRF3 and induction of IFN-β and ISG expression (53). Therefore, we suggest a third model by which VILMIR acts as a scaffold to help bridge IFIT3 to MAVS and TBK1, thus enhancing ISG expression, as we observed that VILMIR overexpression resulted in an activation of ISGs (Fig. 5C). Although the IFIT proteins often act in a complex (32), we did not identify IFIT2 or IFIT5 proteins in the mass spectrometry, so it is unknown whether this is due to the sensitivity of the assay or if VILMIR does not directly interact with these two proteins. In addition, as IFIT1 and IFIT3 were identified individually by mass spectrometry, the possibility that VILMIR interacts with these proteins in a complex needs to be further explored. While previous studies have reported lncRNAs that regulate the transcription of IFIT genes (54, 55) and another study reported that a segment of the lncRNA NORAD binds to IFIT proteins (56), to our knowledge, this is the first reported case of a full-length lncRNA interacting with IFIT proteins.
Finally, we also confirmed the interaction of VILMIR with two ARSs in vitro, QARS1 and KARS1. As stated above, ARSs are enzymes responsible for pairing tRNAs with amino acids during translation and also help form the MSC (35). A study in 2020 found that mascRNA, a small RNA derived from the lncRNA MALAT1, binds to QARS1 in the MSC in order to promote global protein translation by regulating QARS1 protein levels (57). Similarly, we suggest a final model by which VILMIR either stabilizes QARS1 and/or KARS1 in the MSC to promote translation or interferes with their function to negatively regulate translation (Fig. 5D). While these potential models need to be investigated further, they suggest that VILMIR may regulate host interferon responses through protein partners in both the nucleus and cytoplasm, which provides important foundational work in interrogating the specific mechanism of VILMIR.
As the pull-down assay was performed in vitro, future work is needed to confirm these protein interactions in cells, such as by an RNA immunoprecipitation (RIP) or RNA antisense purification (RAP) assay to establish their biological significance (58). Additional interacting molecules of VILMIR may also be determined by assays such as chromatin isolation by RNA purification (ChIRP) that can identify both chromatin and protein associations (58). This could also help determine if VILMIR is directly regulating the transcription of specific genes. In addition, immunoprecipitation assays could determine if VILMIR was binding to a unique protein or interacting with a protein complex. Finally, the biological significance of these protein interactions could be investigated by blocking or mutating the binding site on either VILMIR or the protein, such as in previous studies (14, 59).
In summary, we found that VILMIR interacts with multiple proteins in nuclear and cytoplasmic lysate. We also confirmed that VILMIR plays an activating role in the host interferon response in trans through the establishment of an overexpression cell line. Finally, by compiling RNA-seq analyses, we identified a core set of genes that are consistently differentially expressed after both VILMIR KD and overexpression. We have proposed several potential models for how VILMIR may function in the host interferon response. We expect these results will serve as a guide in probing the molecular mechanisms of VILMIR in detail, providing new insights into the biological significance of VILMIR during antiviral and interferon responses.
The reference list from the paper itself. Each links out to its DOI / PubMed record.
- 1Catalanotto C, Barbato C, Cogoni C, Benelli D. 2023. The RNA-binding function of ribosomal proteins and ribosome biogenesis factors in human health and disease. Biomedicines 11:2969. doi:10.3390/biomedicines 1111296938001969 PMC 10669870 · doi ↗ · pubmed ↗
- 2Schuntermann DB, Jaskolowski M, Reynolds NM, Vargas-Rodriguez O. 2024. The central role of transfer RN As in mistranslation. J Biol Chem 300:107679. doi:10.1016/j.jbc.2024.10767939154912 PMC 11415595 · doi ↗ · pubmed ↗
- 3Valadkhan S, Gunawardane LS. 2013. Role of small nuclear RN As in eukaryotic gene expression. Essays Biochem 54:79–90. doi:10.1042/bse 054007923829528 PMC 11246792 · doi ↗ · pubmed ↗
- 4Huang ZH, Du YP, Wen JT, Lu BF, Zhao Y. 2022. sno RN As: functions and mechanisms in biological processes, and roles in tumor pathophysiology. Cell Death Discov 8:259. doi:10.1038/s 41420-022-01056-835552378 PMC 9098889 · doi ↗ · pubmed ↗
- 5Mattick JS, Amaral PP, Carninci P, Carpenter S, Chang HY, Chen L-L, Chen R, Dean C, Dinger ME, Fitzgerald KA, et al.. 2023. Long non-coding RN As: definitions, functions, challenges and recommendations. Nat Rev Mol Cell Biol 24:430–447. doi:10.1038/s 41580-022-00566-836596869 PMC 10213152 · doi ↗ · pubmed ↗
- 6Mudge JM, Carbonell-Sala S, Diekhans M, Martinez JG, Hunt T, Jungreis I, Loveland JE, Arnan C, Barnes I, Bennett R, et al.. 2025. GENCODE 2025: reference gene annotation for human and mouse. Nucleic Acids Res 53:D 966–D 975. doi:10.1093/nar/gkae 107839565199 PMC 11701607 · doi ↗ · pubmed ↗
- 7Flynn RA, Chang HY. 2014. Long noncoding RN As in cell-fate programming and reprogramming. Cell Stem Cell 14:752–761. doi:10.1016/j.stem.2014.05.01424905165 PMC 4120821 · doi ↗ · pubmed ↗
- 8Ma Y, Zhang J, Wen L, Lin A. 2018. Membrane-lipid associated lnc RNA: a new regulator in cancer signaling. Cancer Lett 419:27–29. doi:10.1016/j.canlet.2018.01.00829330108 · doi ↗ · pubmed ↗