Comparative analysis of blood trace elements in Egyptian hemodialysis patients and their relatives in the same geographical area, is dialysis still guilty?
Dalia Younis, Ahmed Abd Elwahab, Radwa Sehsah, Mahmoud M. Zakaria, Sameha A. Omar, Ekramy Elmorsy, Mostafa Abdelsalam

TL;DR
This study compares trace element levels in Egyptian hemodialysis patients and their relatives, finding environmental and health-related influences on element imbalances.
Contribution
The study identifies specific trace element disturbances in hemodialysis patients linked to environmental and health factors.
Findings
HD patients had elevated Ba and Mg levels, while relatives had higher Cr levels.
Hypertensive individuals showed reduced Cr and elevated Ni and As levels.
Zinc levels in HD patients were independently associated with hemoglobin levels.
Abstract
Hemodialysis (HD) patients are at theoretical risk for deficiency of essential trace elements and excess potentially toxic elements. The present study aimed to evaluate the influence of environmental and geographical factors on these alterations. This comparative cross-sectional study analyzed the blood concentrations of 22 trace elements in 137 participants (HD patients and their relatives) from the same geographical region. Dialysis and tap water samples were analyzed for the same trace elements panel. All samples underwent microwave-assisted acid digestion with nitric acid to ensure complete mineralization before inductively coupled plasma optical emission spectrometry analysis. Trace element analysis indicated significantly elevated levels of Ba (p = 0.008) and Mg (p = 0.028) in HD patients, while Cr (p = 0.013) was significantly higher in their relatives. Other trace elements…
Genes, proteins, chemicals, diseases, species, mutations and cell lines named across the full text — each resolved to its canonical identifier and authoritative record.
Click any figure to enlarge with its caption.
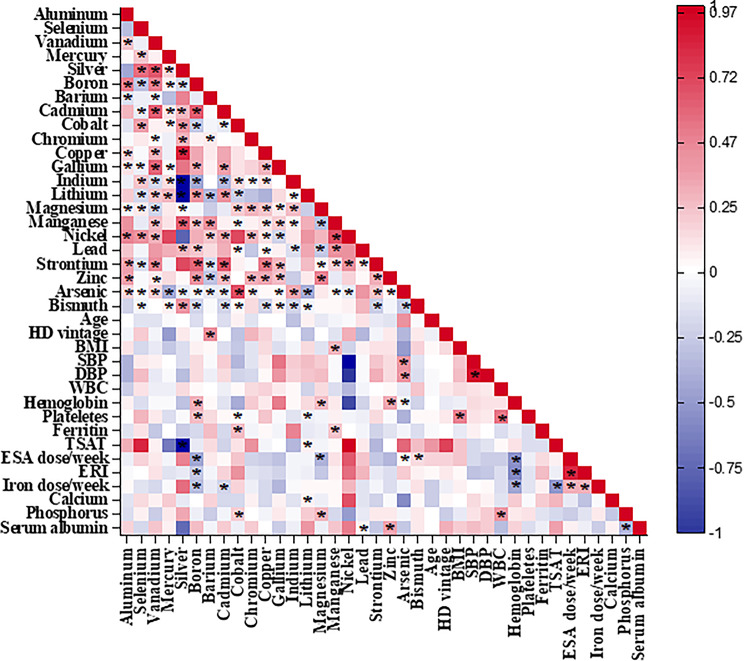 Figure 1
- —Mansoura University
Peer Reviews
No public reviews on file for this paper yet. If you reviewed it on a platform where reviews are public (OpenReview, ICLR, NeurIPS, ICML), you can paste yours below so the community can read it here.
Videos
No videos yet. Explain this paper in a talk, walkthrough, or lecture? Add one.
Taxonomy
TopicsHeavy Metal Exposure and Toxicity · Magnesium in Health and Disease · Parathyroid Disorders and Treatments
Introduction
Kidney failure is a major global health problem and significant contributor to morbidity, mortality, and health care cost. The global median prevalence of kidney failure treated with maintenance hemodialysis (MHD) or peritoneal dialysis (PD) continues to rise, and most recent estimates put it at 823 per million population [1]. The most recent available estimate for the prevalence of dialysis in Egypt is in 2019 and is reported to be 0.61 per 1000 people with an incidence estimate of 0.19 per 1000 people [2]. Patients on MHD are at theoretical risk of accumulation of potentially toxic elements (PTEs) [3]. In addition, disturbances of trace element metabolism might occur in patients undergoing MHD because of gastrointestinal absorption alterations, uremia-affected appetite, and transport during the dialysis procedure [3].
In recent decades, increasing evidence has grown about disturbances in trace-element homeostasis and their contribution to the clinical outcomes of MHD patients. This has intensified interest in both deficiency and accumulation of trace elements, given their potential toxicological and pathophysiological consequences. Maintaining optimal trace element balance is critical for physiological function; for example, zinc deficiency impairs immune competence and tissue repair, whereas copper excess promotes oxidative stress and angiogenesis, thereby accelerating disease progression. Despite the existence of intrinsic regulatory mechanisms, other contributors including inadequate nutritional intake, genetic predisposition, and environmental exposures can disrupt trace elements equilibrium [4]. A further limitation in this field is the lack of universally accepted reference ranges for trace elements in MHD patients that adequately reflect global diversity in diet, environmental exposures, and genetic background. Although monitoring of certain trace elements is mandatory in hemodialysis (HD) water, direct measurement of patient body burdens remains infrequent, representing an underexplored aspect of clinical care.
Tonelli et al. 2018 study included 1278 patients on incident HD, and assessed blood concentrations of 25 trace elements with 2-year prospective follow up for mortality, cardiovascular events, systemic infection and hospitalization. They demonstrated low levels of Zn and Mn and high concentrations of Pb, As, and Hg in HD patients. Moreover, lower concentrations of Se were strongly and independently associated with the risks of death and hospitalization [3]. A recent study involved 200 Egyptian children with end stage renal disease (ESRD) undergoing regular HD exhibited decreased serum levels of Cu and Zn, while Pb levels increased, with no significant changes in Se levels, with notable correlations between Zn and Pb levels and body mass index (BMI) [5]. Several studies have further indicated that administering such elements to patients on MHD, positively influences their clinical and laboratory parameters e.g. BMI, erythropoietin responsiveness index (ERI), and nutritional status [6–8].
Although not established, it is plausible that environmental pollution contributes to the health of MHD patients. Along with expanding urbanization and industrialization, environmental pollution has been rising quickly, negatively affecting the surroundings. As a result, it induces PTEs contamination, which poses a serious threat to humans [9, 10]. Pb has been noted to accumulate in MHD patients in some Asian countries [11, 12], despite the very low Pb levels in the dialysis reverse osmosis water and dialysate in those countries [11]. In Africa, people are exposed to the highest levels of PTEs from different sources [13]. However, the influence of environmental and geographical factors on blood trace elements concentrations in HD patients has not been comprehensively studied.
This study quantified the total levels of twenty-two trace elements in the blood samples of Egyptian ESRD patients undergoing MHD, along with their relatives from the same geographical region. Our objective was to document the impact of occupational, geographical, and environmental factors on these elements to investigate if HD itself is a determinant, within the same environmental and genetic context. Furthermore, we aimed to demonstrate the independent association between the concentrations of these elements in blood and the primary clinical and laboratory parameters of the HD patients.
Population & methods
This comparative cross-sectional study was conducted in the Mansoura Nephrology and Dialysis Unit of Mansoura University Hospitals throughout the period from 2023 to 2024. The study population included all patients who attended dialysis with a relative, and a written informed consent to participate was obtained from all of the participants in the study. A total of 137 subjects were assigned to two groups. The study subjects (n = 69) consisted of all adult stable ESRD patients undergoing MHD using bicarbonate-based dialysate for more than 6 months during the study period. The comparison group included 68 adult participants (subjects’ relatives with the same environmental exposure) with normal renal functions. The inclusion criteria for the HD group comprised patients who had been undergoing regular HD for more than six months, for 4 h per session, three times a week. The exclusion criteria for this group included malignancy and autoimmune diseases. Regarding the control group, the inclusion criteria comprised subjects who were apparently healthy and the exclusion criteria included subjects with a history of malignancy or autoimmune diseases. The study adhered to the Declaration of Helsinki and was approved by Institutional Research Board of Mansoura Faculty of Medicine, No. R.23.01.2013.
Charts of patients were reviewed, and all study participants completed an interviewer-administered questionnaire to collect the following data: demographic details (age, gender, residence, educational level, smoking status, height, and weight), occupation, environmental exposures (residency near plastic or fertilizer factories, source of drinking water, and the use of aluminum utensils), medical history and medications (anemia, hypertension (HTN), diabetes mellitus (DM), chronic liver disease (CLD), or ischemic heart disease (IHD), and mineral supplementations taken).
Patients were categorized based on their clinical diagnoses obtained from medical records and clinical assessments. The categories included HTN, DM, CLD, and IHD. These classifications were used to analyze the differences in trace elements levels among the patient subgroups.
Then, all participants underwent an initial clinical examination, and laboratory investigations were performed. Blood samples were collected once from all participants. For hemodialysis patients, whole blood samples were consistently obtained prior to the commencement of a midweek dialysis session (pre-dialysis), from the venous port of the permanent catheter or HD fistula before heparin was added, to mitigate acute variations in trace element concentrations induced by dialysis. According to the center’s standard procedure, all patients had a dialysate magnesium concentration of 0.5 mmol/L, which made sure that all patients were exposed to the same amount of magnesium. Investigations included complete blood count, serum calcium, serum phosphorus, liver function test, and analysis of trace elements.
Four water samples were also collected to analyze for trace elements; two tap water samples in two locations of participants’ residency, and two dialysis water samples, one before reverse osmosis and the other a final dialysis fluid sample.
Samples (blood and water) digestion was performed in Mansoura Urology and Nephrology Center of Mansoura University Hospitals. Samples digestion process followed EPA Method 3052 (EPA, 1996). Briefly, 1 ml of sample, 3 ml of nitric acid (HNO₃, 69%, Merck, Germany) and 1 ml of hydrogen peroxide (H₂O₂, 30%, Sigma-Aldrich, USA) were added to the vessels and stood for 15 min at room temperature. The vessels were heated in a microwave oven (Speed wave four, Berghof Products, Germany) using a one-stage digestion program: 1600 W (100%); 15-min ramp; at 200 °C temperature; 15-min hold; and 15-min cooling [14]. After cooling, the resulting solution was diluted to 10.0 ml with double distilled water (prepared in-house using a Milli-Q system). To prevent contamination, all labware was acid-cleaned with 10% HNO₃ overnight, rinsed with ultrapure water, and handled within a laminar flow hood, with procedural blanks included in each batch. Inductively coupled plasma optical emission spectrometry (ICP-OES) (Agilent technologies 720 ICPOES Series, Santa Clara, CA, USA) was used in Faculty of Agriculture, Mansoura University to analyze the samples for aluminum (Al), selenium (Se), vanadium (V), mercury (Hg), silver (Ag), boron (B), barium (Ba), cadmium (Cd), cobalt (Co), chromium (Cr), copper (Cu), gallium (Ga), indium (In), lithium (Li), magnesium (Mg), manganese (Mn), nickle (Ni), lead (Pb), strontium (Sr), zinc (Zn), arsenic (As), and bismuth (Bi). The operating parameters included a plasma power of 1.2 kW, nebulizer flow rate of 0.75 L/min, auxiliary gas flow of 0.2 L/min, and a spray chamber temperature maintained at 2 °C. Observation wavelengths were selected according to manufacturer recommendations for each element. Quality control and procedural performance were ensured by calculating the Limit of Detection (LOD) and Limit of Quantification (LOQ) using the standard deviation of ten procedural blanks (LOD = 3×SDblank, LOQ = 10×SDblank) and comparing these values to instrument-based measurements. A minimum of five calibration ranging from just above the limit of quantification (LOQ) to at least 2 to 10 times the highest concentration anticipated in the biological matrix. This method ensures effective trace detection and accurate quantification at high concentrations, maintaining linearity (R² ≥ 0.995) and minimizing matrix interferences (Table 1).
Table 1. Estimated limits of detection (LOD), quantification (LOQ), and recoveries of studied trace elements in whole blood using ICP-OESTrace ElementLOD (mg/L)LOQ (mg/L)Recovery (%)Calibration Range (mg/L)Al0.00050.001595–1020.001–2.0Se0.00010.000392–980.0005–1.0V0.00020.000690–1050.001–2.0Hg0.00010.000388–970.0005–1.0Ag0.00010.000390–1020.0005–1.0B0.00020.000693–1010.001–2.0Ba0.00050.001594–1030.001–2.0Cd0.00010.000389–960.0005–1.0Co0.00020.000691–1040.001–2.0Cr0.00020.000692–1010.001–2.0Cu0.00020.000693–1020.001–2.0Ga0.00010.000390–1010.0005–1.0In0.00010.000389–1000.0005–1.0Li0.00010.000391–1020.001–2.0Mg0.00050.001595–1040.01–10.0Mn0.00020.000690–1010.001–2.0Ni0.00020.000691–1020.001–2.0Pb0.00010.000392–1000.0005–1.0Sr0.00050.001593–1030.001–2.0Zn0.00020.000694–1020.001–2.0As0.00010.000390–990.0005–1.0Bi0.00010.000391–1010.0005–1.0
Certified reference materials (CRMs), specifically NIST SRM 1643f for trace elements in water, were assessed alongside the samples (n = 5) to evaluate accuracy. Table 2 presents the measured values, certified values, and corresponding percent recoveries. Each batch included procedural blanks and spiked samples. Precision was evaluated through the %RSD of replicate measurements (n = 5 for intra-day and n = 3 for inter-day). The acceptance criteria established were a recovery range of 80–120% and a relative standard deviation (%RSD) of less than 10%. Although inductively coupled plasma –mass spectrometry (ICP-MS) offers lower detection limits, the expected blood concentrations of Pb, Cd, Hg, and Se in our population were within the quantifiable range of ICP-OES, as verified by method validation using certified reference materials. The method provided sufficient accuracy and precision to compare trace element levels between hemodialysis patients and the control group.
Table 2. Comparison of certified and measured trace element concentrations with percent recoveryTrace ElementCertified (mg/L)HD group mean (mg/L)HD % RecoveryControl group mean (mg/L)Control % RecoveryAl0.110.12109.10.0981.8Se0.150.16106.70.17113.3V0.110.12109.10.13118.2Hg0.0370.04108.10.0254.1Ag0.0550.06109.10.0590.9B4.04.19104.85.01125.3Ba0.210.23109.50.1885.7Cd0.0360.04111.10.04111.1Co0.0270.03111.10.03111.1Cr1.952.12108.72.23114.4Cu0.740.79106.80.84113.5Ga0.0850.09105.90.0782.4In1.21.27105.81.1797.5Li0.090.10111.10.0777.8Mg33.036.04109.231.9496.8Mn0.0370.04108.10.04108.1Ni0.0090.01111.10.15166.7Pb0.110.12109.10.1090.9Sr0.0280.03107.10.04142.9Zn6.56.95106.96.2696.3As0.00.000.00.000.0Bi0.220.24109.10.1777.3
The collected data were coded, processed, and analyzed using the Statistical Package for Social Sciences (SPSS) for Windows. Categorized variables were presented as numbers and percentages, while continuous variables were expressed as mean ± standard deviation or median and range, depending on whether the variable is normally distributed or not, as detected by the Kolmogorov–Smirnov Z test. For comparison among the two groups, the Chi-square test was used for categorical data and the Mann–Whitney U test for continuous data with skewed distribution. Spearman correlation analysis was used for nonparametric correlations. A linear regression analysis was conducted to assess the significance of clinical data. To account for multiple comparisons, we applied the Benjamini–Hochberg false discovery rate (FDR) procedure across all tested associations, controlling the expected proportion of false positives at q < 0.05. Associations that remained significant after FDR correction were considered robust and reported in the results. A Spearman bivariate correlation analysis heatmap was created using OriginPro 2024. A p-value < 0.05 denotes that the variable is statistically significant.
Results
One hundred and thirty-seven subjects were included in the study: 69 chronic HD patients and 68 relatives from the same geographical area. On average, HD patients were older (50 ± 16 vs. 44 ± 14 years) and mostly male (58% vs. 20.6%) compared to the comparison group. Hemodialysis patients were more likely to engage in agriculture, pesticides, and marble work than their relatives. They smoked more (13% vs. 8.8%) and had more hypertension (59.4% vs. 17.7%), diabetes (17.4% vs. 8.8%), chronic liver disease (10% vs. 0%), and ischemic heart disease (23% vs. 4.4%) compared to the comparison group. The demographic data of the study population are shown in (Table 3).
Table 3. Demographic, occupational, environmental, and medical data for study populations (n = 137)CharacteristicsHD Patients(n = 69)Comparison Group(n = 68)Age,** years (mean ± SD)50 ± 1644 ± 14Gender**,** n (%)** Male40 (58.0)14 (20.6) Female29 (42.0)54 (79.4)Residency,** n (%)** Urban54 (78.0)53 (78.0) Rural15 (22.0)15 (22.0)Educational level,** n (%)** No19 (27.5)10 (14.7) High school12 (17.4)8 (11.8) Higher38 (55.1)50 (73.5)Smoking,** n (%)** Never50 (72.5)62 (91.2) Former10 (14.5)0 (0.0) Current9 (13.0)6 (8.8)BMI,** kg/m**^2^28.69 ± 7.7630.25 ± 5.07Occupation,** n (%)** Agricultural worker5 (7.0)2 (3.0) Gas worker2 (3.0)0 (0.0) Construction worker0 (0.0)2 (3.0) Pesticides factory worker2 (3.0)0 (0.0) Marble factory worker2 (3.0)0 (0.0) Smith worker4 (6.0)0 (0.0) Others54 (78.0)64 (94.0)Drinking water,** n (%)** Tap water54 (78.0)50(74.0) Purified water15 (22.0)18 (26.0)Nearby factories,** n (%)** None64 (92.5)63 (92.5) Plastic factory1 (1.5)1 (1.5) Fertilizer factory4 (6.0)4 (6.0)Use aluminum utensils,** n (%)59 (85.5)58 (85)History of HTN, n (%)41 (59.4)12 (17.7)History of DM, n (%)12 (17.4)6 (8.8)History of CLD, n (%)7 (10.0)0 (0.0)History of IHD, n (%)**16 (23.0)3 (4.4)BMI, body mass index; CLD, chronic liver disease; DM, diabetes mellitus; HD, hemodialysis; HTN, hypertension; IHD, ischemic heart disease
Ninety-three percent of the dialysis patients were receiving HD via arterio-venous fistula. The median length of HD vintage was sixty months. Calcium channel blockers were prescribed to 31.9% of HD patients with hypertension, whereas renin angiotensin aldosterone system (RAAS) blockers were prescribed to 27.5%. The mean hemoglobin level was found to be 10.97 g/dL, the dose of erythropoietin (ESA) and ESA resistive index (ERI) varied [5000 (0.00-15000) IU/week, and 6.63 (0.00-41.15) IU.w^− 1^.kg^− 1^.(g/dl^− 1^), respectively], and the median ferritin level was found to be 577 µg/L. Inconsistent treatment for mineral metabolism was administered, with a significant number of patients not receiving supplementation with calcium (60.9%), sevelamer (79.7%), or cinacalcet (94.2%). Almost one-fifth of HD patients (17.4%) tested positive for HCV.
Inductively coupled plasma optical emission spectrometry (Agilent Technologies 720 ICP-OES Series, Santa Clara, CA, USA) was employed to analyze the trace elements. Calibration curves were generated utilizing multi-element standards across the specified concentration ranges: Al: 0–0.005; Se: 0–0.002; V: 0–0.002; Hg: 0–0.001; Ag: 0–0.001; B: 0–0.200; Ba: 0–0.010; Cd: 0–0.001; Co: 0–0.001; Cr: 0–0.005; Cu: 0–0.005; Ga: 0–0.001; In: 0–0.002; Li: 0–0.001; Mg: 0–10.000; Mn: 0–0.002; Ni: 0–0.005; Pb: 0–0.002; Sr: 0–0.020; Zn: 0–0.020; As: 0–0.002; Bi: 0–0.002 (mg/L). All curves demonstrated excellent linearity, with correlation coefficients (R²) exceeding 0.998. The stability and accuracy of the instrument were assessed through multiple measurements of standards and blanks. The relative standard deviation (RSD) for all elements was below 5% on the same day and below 7% on the subsequent day.
Demographic and occupational characteristics associated with elevated whole blood trace element concentrations were analyzed using Chi-square testing. The use of aluminum utensils was significantly correlated with elevated aluminum levels (χ²=8.95, p = 0.003). Industry work correlated with elevated levels of vanadium, silver, gallium, indium, and bismuth (χ²=6.85, p = 0.009; χ²=5.95, p = 0.01; χ²=6.00, p = 0.01; χ²=7.15, p = 0.007; χ²=6.60, p = 0.01). Agricultural workers exhibited increased exposure to boron (χ²=8.25, p = 0.004) and arsenic (χ²=7.40, p = 0.006). Agricultural workers and individuals in proximity to fertilizer factories exhibited higher exposure levels to barium and boron (p < 0.05). The study identified a correlation between smoking and cadmium (χ²=12.10, p = 0.001), nickel (χ²=4.75, p = 0.03), and lead (χ²=9.35, p = 0.002). Increased levels of cadmium and lead correlated with age (χ²=4.85, p = 0.03; χ²=5.20, p = 0.02), whereas male sex was linked to elevated chromium (χ²=4.75, p = 0.03) and zinc (χ²=4.05, p = 0.04) levels. Elevated mercury levels correlated with urban environments (χ²=5.10, p = 0.02), whereas selenium levels were linked to rural settings (χ²=4.30, p = 0.04). Significant correlations were observed between clinical factors and trace element concentrations, including CLD and manganese (χ²=4.20, p = 0.04), as well as zinc (χ²=5.25, p = 0.02); HTN and magnesium (χ²=4.95, p = 0.03) (Table 4).
Table 4. Association between the different studied demographic variables and the levels of the studied trace elementsTrace elementAge GroupSexSmokingResidencyEducationOccupationWater SourceAl UtensilsHTNDMCLDIHDAlχ²=2.45 p = 0.12χ²=6.72 p = 0.01χ²=1.05 p = 0.30χ²=0.88 p = 0.34χ²=2.60 p = 0.11χ²=4.90 p = 0.03χ²=1.20 p = 0.27χ²=8.95 p = 0.003χ²=0.66p = 0.41χ²=0.21p = 0.64χ²=1.88p = 0.17χ²=2.10p = 0.15Seχ²=1.22p = 0.27χ²=0.54p = 0.46χ²=0.62 p = 0.43χ²=4.30 p = 0.04χ²=2.10p = 0.15χ²=0.92 p = 0.34χ²=0.58p = 0.45χ²=0.45 p = 0.50χ²=0.11 p = 0.74χ²=0.34 p = 0.56χ²=0.26 p = 0.61χ²=0.72 p = 0.39Vχ²=0.89 p = 0.35χ²=0.74p = 0.39χ²=0.68 p = 0.41χ²=1.11 p = 0.29χ²=0.92 p = 0.34χ²=6.85 p = 0.009χ²=0.75p = 0.38χ²=0.60 p = 0.44χ²=0.21p = 0.65χ²=0.30p = 0.58χ²=0.44 p = 0.51χ²=0.36p = 0.55Hgχ²=1.40 p = 0.24χ²=4.15 p = 0.04χ²=0.90 p = 0.34χ²=5.10 p = 0.02χ²=1.30 p = 0.25χ²=0.78 p = 0.37χ²=0.65 p = 0.42χ²=0.48 p = 0.49χ²=0.26p = 0.61χ²=0.55 p = 0.46χ²=0.71 p = 0.40χ²=0.62p = 0.43Agχ²=1.55 p = 0.21χ²=0.81 p = 0.36χ²=0.66 p = 0.41χ²=0.52 p = 0.47χ²=0.77 p = 0.38χ²=5.95 p = 0.01χ²=0.92p = 0.34χ²=0.63 p = 0.43χ²=0.33 p = 0.56χ²=0.41 p = 0.52χ²=0.44 p = 0.51χ²=0.70 p = 0.40Bχ²=1.18 p = 0.28χ²=0.64p = 0.42χ²=0.82 p = 0.36χ²=0.97 p = 0.32χ²=1.33 p = 0.25χ²=8.25 p = 0.004χ²=7.20 p = 0.007χ²=0.74 p = 0.39χ²=0.55 p = 0.46χ²=0.44 p = 0.51χ²=0.29 p = 0.59χ²=0.62 p = 0.43Baχ²=2.15 p = 0.14χ²=0.88 p = 0.34χ²=1.45 p = 0.22χ²=0.78 p = 0.37χ²=1.32 p = 0.25χ²=7.85 p = 0.005χ²=6.95 p = 0.008χ²=0.99 p = 0.32χ²=0.24p = 0.62χ²=0.51 p = 0.47χ²=0.19 p = 0.66χ²=1.10p = 0.29Cdχ²=4.85 p = 0.03χ²=0.59 p = 0.44χ²=12.10p = 0.001χ²=0.48 p = 0.49χ²=1.90 p = 0.17χ²=0.96 p = 0.33χ²=0.75 p = 0.38χ²=0.81 p = 0.36χ²=0.16 p = 0.69χ²=0.21 p = 0.65χ²=0.30 p = 0.58χ²=0.42 p = 0.52Coχ²=1.28 p = 0.26χ²=0.90 p = 0.34χ²=0.74 p = 0.39χ²=0.66 p = 0.41χ²=0.82 p = 0.36χ²=5.10 p = 0.02χ²=0.92 p = 0.34χ²=0.72 p = 0.40χ²=0.34 p = 0.56χ²=0.42 p = 0.52χ²=0.38 p = 0.54χ²=0.44 p = 0.51Crχ²=0.90 p = 0.34χ²=4.75 p = 0.03χ²=0.60 p = 0.44χ²=0.42 p = 0.52χ²=1.55 p = 0.21χ²=8.15 p = 0.004χ²=0.48 p = 0.49χ²=0.77 p = 0.38χ²=0.30 p = 0.58χ²=0.44 p = 0.51χ²=0.52 p = 0.47χ²=0.61 p = 0.43Cuχ²=0.95 p = 0.33χ²=0.61p = 0.43χ²=0.82 p = 0.36χ²=0.72 p = 0.40χ²=1.15 p = 0.28χ²=1.35 p = 0.24χ²=0.88 p = 0.34χ²=0.76 p = 0.38χ²=0.41 p = 0.52χ²=0.49 p = 0.48χ²=4.05 p = 0.04χ²=0.56 p = 0.45Gaχ²=1.10 p = 0.29χ²=0.75 p = 0.38χ²=0.58 p = 0.45χ²=0.88 p = 0.34χ²=1.00 p = 0.32χ²=6.00 p = 0.01χ²=0.62 p = 0.43χ²=0.71 p = 0.40χ²=0.30 p = 0.58χ²=0.44 p = 0.51χ²=0.49 p = 0.48χ²=0.53 p = 0.47Inχ²=1.40 p = 0.24χ²=0.82 p = 0.36χ²=0.62 p = 0.43χ²=0.99 p = 0.32χ²=1.05 p = 0.30χ²=7.15 p = 0.007χ²=0.54 p = 0.46χ²=0.72 p = 0.40χ²=0.42 p = 0.52χ²=0.60 p = 0.44χ²=0.55 p = 0.46χ²=0.65 p = 0.42Liχ²=1.25 p = 0.26χ²=0.77 p = 0.38χ²=0.55 p = 0.46χ²=0.62 p = 0.43χ²=1.30 p = 0.25χ²=0.91 p = 0.34χ²=0.82 p = 0.36χ²=0.65 p = 0.42χ²=5.35 p = 0.02χ²=0.58 p = 0.45χ²=0.61 p = 0.43χ²=0.70 p = 0.40Mgχ²=1.88 p = 0.17χ²=0.62 p = 0.43χ²=0.91 p = 0.34χ²=0.72 p = 0.40χ²=1.11 p = 0.29χ²=1.30 p = 0.25χ²=2.20 p = 0.14χ²=0.85 p = 0.36χ²=4.95 p = 0.03χ²=0.92 p = 0.34χ²=0.55 p = 0.46χ²=0.60 p = 0.44Mnχ²=0.85 p = 0.36χ²=0.55 p = 0.46χ²=0.72 p = 0.40χ²=0.63 p = 0.43χ²=0.91 p = 0.34χ²=0.80 p = 0.36χ²=0.78 p = 0.37χ²=0.70 p = 0.40χ²=0.62 p = 0.43χ²=0.70 p = 0.40χ²=4.20 p = 0.04χ²=0.71 p = 0.40Niχ²=0.96 p = 0.33χ²=0.62 p = 0.43χ²=4.75 p = 0.03χ²=0.70 p = 0.40χ²=0.77 p = 0.38χ²=6.30 p = 0.01χ²=0.58 p = 0.45χ²=0.66 p = 0.41χ²=0.40 p = 0.53χ²=0.35 p = 0.56χ²=0.42 p = 0.52χ²=0.48 p = 0.49Pbχ²=5.20 p = 0.02χ²=0.66 p = 0.41χ²=9.35 p = 0.002χ²=0.71 p = 0.40χ²=2.25 p = 0.13χ²=1.70 p = 0.19χ²=1.05 p = 0.30χ²=0.92 p = 0.34χ²=0.22 p = 0.64χ²=0.31 p = 0.57χ²=0.28 p = 0.60χ²=0.74 p = 0.39Srχ²=1.15 p = 0.28χ²=0.60 p = 0.44χ²=0.77 p = 0.38χ²=0.81 p = 0.36χ²=0.92 p = 0.34χ²=0.88 p = 0.34χ²=5.80 p = 0.02χ²=0.72 p = 0.40χ²=0.42 p = 0.52χ²=0.50 p = 0.48χ²=0.39 p = 0.53χ²=0.44 p = 0.51Znχ²=1.80 p = 0.18χ²=4.05 p = 0.04χ²=0.90 p = 0.34χ²=0.75 p = 0.38χ²=0.92 p = 0.34χ²=1.25 p = 0.26χ²=0.65 p = 0.42χ²=0.54 p = 0.46χ²=0.38 p = 0.54χ²=0.41 p = 0.52χ²=5.25 p = 0.02χ²=0.62 p = 0.43Asχ²=0.95 p = 0.33χ²=0.55 p = 0.46χ²=0.70 p = 0.40χ²=0.80 p = 0.36χ²=0.77 p = 0.38χ²=7.40 p = 0.006χ²=0.68 p = 0.41χ²=0.72 p = 0.40χ²=0.42 p = 0.52χ²=0.40 p = 0.53χ²=0.48 p = 0.49χ²=0.52 p = 0.47Biχ²=1.10 p = 0.29χ²=0.74 p = 0.39χ²=0.68 p = 0.41χ²=0.60 p = 0.44χ²=0.83 p = 0.36χ²=6.60 p = 0.01χ²=0.72 p = 0.40χ²=0.65 p = 0.42χ²=0.44 p = 0.51χ²=0.49 p = 0.48χ²=0.53 p = 0.47χ²=0.60 p = 0.44
Multivariable logistic regression, after accounting for potential confounding factors, validated several of these associations. The use of aluminum utensils significantly predicted elevated aluminum levels (aOR 2.9, 95% CI 1.5–5.8, p = 0.001). Smoking significantly predicted cadmium (aOR 3.2, 95% CI 1.6–6.5, p = 0.001), nickel (aOR 1.9, 95% CI 1.0–3.5, p = 0.04), and lead (aOR 2.5, 95% CI 1.2–5.3, p = 0.01). Individuals employed in factories exhibited elevated levels of vanadium (aOR 2.6, 95% CI 1.1–6.0, p = 0.03), silver (aOR 2.4, 95% CI 1.1–5.2, p = 0.03), nickel (aOR 2.8, 95% CI 1.2–6.5, p = 0.01), and bismuth (aOR 2.3, 95% CI 1.0–5.2, p = 0.04). Individuals employed in agriculture exhibited elevated levels of boron (aOR 2.7, 95% CI 1.3–5.7, p = 0.007) and arsenic (aOR 2.6, 95% CI 1.2–5.5, p = 0.01) independently. Clinical conditions were significantly associated with chronic liver disease: copper (aOR 2.1, 95% CI 1.0–4.4, p = 0.04), manganese (aOR 2.6, 95% CI 1.2–5.8, p = 0.01), and zinc (aOR 1.9, 95% CI 1.0–3.6, p = 0.04). Hemodialysis status independently predicted levels of aluminum, lithium, and magnesium (p < 0.05) (Table 5).
Table 5. Multivariable regression analysis of predictors of elevated whole blood trace element levels among study participants (n = 137)Trace elementSignificant PredictorsaOR (95% CI)p-valueAlAluminum utensil use2.9 (1.5–5.8)0.001HD status2.1 (1.1–3.9)0.020SeRural residence1.7 (1.0–2.9)0.050VIndustrial occupation2.6 (1.1–6.0)0.030HgUrban residence2.0 (1.1–3.6)0.020Female sex1.5 (1.0–2.4)0.050AgIndustrial occupation2.4 (1.1–5.2)0.030BAgricultural occupation2.7 (1.3–5.7)0.007Fertilizer factory nearby2.2 (1.0–4.8)0.040BaTap water source1.9 (1.1–3.3)0.020Agricultural occupation2.8 (1.3–6.0)0.010CdSmoking3.2 (1.6–6.5)0.001Older age (per 10 years)1.2 (1.0–1.5)0.040CoIndustrial occupation2.5 (1.0–6.2)0.050CrMale sex1.7 (1.0–2.9)0.040Factory worker3.1 (1.2–7.9)0.020CuCLD history2.1 (1.0–4.4)0.040GaIndustrial occupation2.3 (1.0–5.3)0.040InFactory worker2.9 (1.1–7.2)0.030LiHD status2.2 (1.2–4.0)0.010MgHD status2.4 (1.4–4.1)0.001Lower BMI1.6 (1.0–2.7)0.050MnCLD history2.6 (1.2–5.8)0.010NiSmoking1.9 (1.0–3.5)0.040Industrial occupation2.8 (1.2–6.5)0.010PbSmoking2.5 (1.2–5.3)0.010Older age (per 10 years)1.3 (1.1–1.6)0.020SrTap water source1.8 (1.0–3.1)0.040ZnCLD history1.9 (1.0–3.6)0.040Male sex1.5 (1.0–2.2)0.050AsAgricultural occupation2.6 (1.2–5.5)0.010Fertilizer factory nearby2.4 (1.0–5.7)0.050BiIndustrial occupation2.3 (1.0–5.2)0.040
The whole blood concentrations of trace elements did not show significant differences between the two groups, except for Ba (p = 0.008) and Mg (p = 0.028), which were significantly higher in HD patients, and Cr (p = 0.013), which was significantly higher in the comparison group. The remaining trace elements, including Al, Se, V, and Zn, exhibited nearby concentrations across both groups (Table 6). Supplementary Table S1 reporting the approximate median and interquartile range (IQR) for all analyzed trace elements in both hemodialysis patients and the comparison group. These values provide a more robust measure of central tendency and dispersion, mitigating the effect of extreme values on the descriptive statistics.
Table 6. Whole blood concentrations of trace elements (mg/L) in Hemodialysis patients and their comparison group (n = 137)GroupsHD PatientsComparison Groupp-value ^^Trace elementsMeanSDMinMaxMeanSDMinMaxAl0.120.170.000.390.090.300.000.500.321Se0.160.200.000.690.170.220.000.750.973V0.120.160.000.840.130.200.001.200.549Hg0.040.100.000.770.020.060.000.370.814Ag0.060.130.000.340.050.110.000.330.577B4.197.690.2341.815.019.940.2760.690.334Ba0.230.170.000.930.180.250.001.970.008Cd0.040.030.000.110.040.030.000.110.192Co0.030.030.000.130.030.040.000.170.815Cr2.120.590.863.392.230.910.005.300.013Cu0.790.550.001.930.840.620.002.250.596Ga0.090.310.001.950.070.700.005.290.299In1.271.810.006.351.171.830.006.220.438Li0.100.230.001.300.070.170.001.160.165Mg36.0411.4716.8978.1331.948.58115.6159.050.028Mn0.040.020.000.100.040.020.010.100.724Ni0.010.030.000.110.151.230.0010.260.934Pb0.120.140.000.400.100.120.000.380.494Sr0.030.030.000.140.040.030.000.120.783Zn6.953.343.5622.926.262.490.0012.080.374As0.000.010.000.020.000.010.000.020.561Bi0.240.300.001.490.170.250.000.870.334^^ Mann–Whitney testAl, Aluminum; Se, selenium; V, vanadium; Hg, mercury; Ag, silver; B, boron; Ba, barium; Cd, cadmium; Co, cobalt; Cr, chromium; Cu, copper; Ga, gallium; In, indium; Li lithium; Mg magnesium; Mn, manganese; Ni, nickle; Pb, lead; Sr, strontium; Zn, zinc; As, arsenic; and Bi, bismuth
Hypertensive participants had notably lower blood Cr concentrations (p = 0.038), higher blood Ni (p = 0.029) and blood As concentrations (p = 0.005), in comparison with non-hypertensive participants. Diabetic participants showed significantly lower blood Cr concentrations (p = 0.001) and higher blood Pb concentrations (p = 0.032) than non-diabetics in both groups.
Regarding the effect of geographic and environmental factors, the mean blood Ni levels of urban populations were significantly higher (p = 0.02) than those of rural populations. In contrast, the mean blood As levels of rural populations were significantly higher (p = 0.03) than those of urban populations. People living near plastic factories showed markedly higher blood Al levels (p = 0.048), compared with others, without significant differences in other measured blood trace elements concentrations. No significant differences in blood trace elements concentrations were detected according to drinking water, educational level, aluminum utensils use, or job history.
Supplementary table S2 shows the chemical analysis of two tap water samples in two locations of the participants′ residency. Tap water trace elements concentrations were all within the international standards at an acceptable level [15]. Supplementary table S3 shows the chemical analysis of two dialysis water samples, and the resulting metal concentrations were all within the normal values according to Association for the Advancement of Medical Instrumentation (AAMI) recommendations [16].
Excess blood concentrations of Al, Hg, Ag, Cd, Cu, Mg, Mn, Ni, Pb, Sr, Zn, As, and Bi were common in HD patients (39.1%, 34.8%, 20.3%, 79.7%, 11.6%, 82.6%, 92.0%, 11.6%, 30.4%, 46.4%, 11.6%, 29.0%, and 61.8%, respectively) and their comparison relatives (44.1%, 23.5%, 19.1%, 92.6%, 20.6%, 75.0%, 91.1%, 5.9%, 22.1%, 45.6%, 14.7%, 26.5%, and 49.3%, respectively). Low blood concentrations of Se, Ba, and Cu were common in HD patients (52.2%, 11.6%, and 52.2%, respectively) and their comparison relatives (51.5%, 13.4%, and 51.5%, respectively). No definite published data about the normal levels of Ga or In were found. Almost all participants have normal blood concentrations of V, Co, Cr, Li, and Mg (Table 7).
Table 7. The percentage and frequency-wise distribution of whole blood trace elements concentrations (mg/L) in Hemodialysis patients and their comparison group (n = 137)Trace elementsLevelsHD Patientsn (%)Comparison Groupn (%)p-value^^Al levelNormal level < 0.02 mg/L [17]HighNormal27 (39.1)42 (60.9)30 (44.1)38 (55.9)0.338Se levelNormal level (0.06–1.2) mg/L [18]NormalLow33 (47.8)36 (52.2)33 (48.5)35 (51.5)0.535V levelNormal level (0.1-1 mg/L) [19]HighNormal0 (0.0)69 (100.0)2 (2.9)66 (97.1)0.245Hg levelNormal level < 0.02 mg/L [20]HighNormal24 (34.8)45 (65.2)16 (23.5)52 (76.5)0.189Ag levelNormal level < 0.001 mg/L [21]HighNormal14 (20.3)55 (79.7)13 (19.1)55 (80.9)0.517B levelNormal level 0.05-10 mg/L [22]HighNormal4 (5.8)65 (94.2)5 (7.4)63 (92.6)0.713Ba levelNormal level 0.03–0.4 mg/L [23]HighNormalLow5 (7.2)56 (81.2)8 (11.6)6 (9.0)52 (77.6)9 (13.4)0.874Cd levelNormal level < 0.0025 mg/L [24]HighNormal55 (79.7)14 (20.3)63 (92.6)5 (7.4)0.028Co levelNormal level < 0.4 mg/L [19]Normal69 (100.0)68 (100.0)--Cr levelNormal level (0.4–3.5) mg/L [19]HighNormal0 (0.0)69 (100.0)1 (1.5)67 (98.5)0.312Cu levelNormal level (0.9–1.5) mg/L [24]HighNormalLow8 (11.6)25 (36.2)36 (52.2)14 (20.6)19 (27.9)35 (51.5)0.292Li levelNormal level ≤ 13.88 mg/L [25]Normal69 (100.0)68 (100.0)--Mg levelNormal level (17–24) mg/L [26]HighNormalLow57 (82.6)11 (15.9)1 (1.4)51 (75.0)15 (22.1)2 (2.9)0.529Mn levelNormal level (0.004–0.015) mg/L [27]HighNormalLow46 (92.0)3 (6.0)1 (2.0)41(91.1)4 (8.9)0 (0.0)0.557Ni levelNormal level < 0.002 mg/L [28]HighNormal8 (11.6)61 (88.4)4 (5.9)64 (94.1)0.237Pb levelNormal level < 0.2 mg/L [24]HighNormal21 (30.4)48 (69.6)15 (22.1)53 (77.9)0.265Sr levelNormal level < 0.034 mg/L [29]HighNormal32 (46.4)37 (53.6)31 (45.6)37 (54.4)0.926Zn levelNormal level (4.4–8.6) mg/L [24]HighNormal8 (11.6)61 (88.4)10 (14.7)58 (85.3)0.590As levelNormal level < 0.012 mg/L [30]HighNormal20 (29.0)49 (71.0)18 (26.5)50 (73.5)0.742Bi levelNormal level < 0.05 mg/L [31]HighNormal42 (61.8)26 (38.2)33 (49.3)34 (50.7)0.144 Chi-square testAl, Aluminum; Se, selenium; V, vanadium; Hg, mercury; Ag, silver; B, boron; Ba, barium; Cd, cadmium; Co, cobalt; Cr, chromium; Cu, copper; Ga, gallium; In, indium; Li lithium; Mg magnesium; Mn, manganese; Ni, nickle; Pb, lead; Sr, strontium; Zn, zinc; As, arsenic; and Bi, bismuth
A correlation matrix of the study cohort′s hematological, biochemical, and trace element characteristics is shown in the heatmap (Fig. 1). Significant positive correlations were observed between age and Bi (r = 0.275, p = 0.020); BMI and Mn (r = 0.312, p = 0.047); HD vintage and Ba (r = 0.432, p = 0.005); Hb level and B (r = 0.321, p = 0.012), Mg (r = 0.261, p = 0.042), Zn (r = 0.355, p = 0.005), and As (r = 0.258, p = 0.046); ferritin and Co (r = 0.366, p = 0.007), and Mn (r = 0.273, p = 0.044); systolic blood pressure (SBP) and As (r = 0.419, p = 0.015); diastolic blood pressure (DBP) and As (r = 0.391, p = 0.024); weekly ESA dose and Bi (r = 0.286, p = 0.028).
Fig. 1. Heatmap represents the correlation matrix among various hematological, biochemical, and trace element parameters in the study cohort. The color gradient indicates the strength and direction of the correlations: red shades denote positive correlations, while blue shades indicate negative correlations. The intensity of the color reflects the magnitude of the correlation coefficient, with darker shades representing stronger associations. Statistically significant correlations (p < 0.05) are marked with asterisks (*). BMI, body mass index; DBP, diastolic blood pressure; ERI, erythropoietin resistive index; ESA, erythropoietin stimulating agent; SBP, systolic blood pressure; TSAT, transferrin saturation ratio
Significant negative correlations were observed between platelets count and Co (r=-0.276, p = 0.038), and Li (r=-0.349, p = 0.006); Hb level and ERI (r=-0.561, p ≤ 0.001); TSAT and Ag (r=-0.517, p = 0.028); weekly ESA dose and B (r=-0.415, p = 0.001), Mg (-0.382, p = 0.002), and As (r=-0.277, p = 0.032); I.V. iron dose and Cd (r=-0.336, p = 0.008), and B (r=-0.321, p = 0.012); ERI and B (r=-0.267, p = 0.049).
Multiple linear regression analysis was used to define independent determinants of blood Hb level in HD patients. Zn, Mg, B, and As were incorporated into the model as independent variables. The R2 of the model was 0.070 with P = 0.023. The linear regression model revealed that Zn level was an independent predictor of blood Hb level. Furthermore, B, Mg, and As were incorporated into a linear regression model to define the independent predictors of weekly ESA dose. The R2 of the model was 0.128 with P = 0.005. The linear regression model revealed that the whole blood level of Mg was an independent predictor of ESA dose per week (Table 8).
Table 8. Regression analysis for defining the independent determinants of blood hemoglobin level and weekly erythropoietin doseDeterminantsβtp-value * I. Blood Hb level B (mg/L)0.0510.3790.706Mg (mg/L)0.1290.8600.393Zn (mg/L)0.2932.3370.023Arsenic (mg/L)0.2231.7910.079 II. ESA dose/week B (mg/L)-0.159-0.9390.352Mg (mg/L)-0.358-2.9160.005As (mg/L)-0.230-1.9120.061* Linear regression analysisESA, erythropoietin; Hb, hemoglobin
Discussion
This study examined whole blood concentrations of 22 trace elements in 137 people, including 69 chronic HD patients and 68 comparison relatives from the same geographical area. HD patients and their comparison relatives had excess blood concentrations of Al, Hg, Ag, Cd, Cu, Mg, Mn, Ni, Pb, Sr, Zn, As, and Bi. In addition, there were significant metal differences across urban and rural populations, hypertensive and non-hypertensive subjects, and diabetics and non-diabetics.
Hemodialysis patients are especially prone to trace elements concentration fluctuations due to reduced renal function and dialysis. Studies have found trace elements deficits and excesses in this group that can affect their clinical results. A comprehensive evaluation of 128 studies found that HD patients have higher levels of cd, Cr, Cu, Pb, and V and lower levels of Se, Zn, and Mn than healthy controls. These trace elements deviated more than 0.8 standard deviation units from control values [32]. Further research showed that HD patients had lower blood levels of Cu, Zn, and Se and greater amounts of Ni, As, and Pb than healthy people [33].
Chronic HD patients also have anomalies in trace elements such as Al, zinc, Mn, and Ni [19]. Several studies stressed the importance of monitoring and managing trace element levels in HD patients to reduce harmful effects and enhance therapeutic outcomes. Our investigations found no significant difference in Al levels between HD patients and their relatives. Prior studies showed that HD patients may accumulate Al due to decreased renal excretion and dialysis-related exposure. Osteomalacia, anemia, and dialysis encephalopathy can result from high serum Al levels. Al toxicity in HD patients was previously caused by dialysis water pollution and Al-based phosphate binders. This population’s serum Al levels have decreased due to water purification improvements and a switch to non-Al binders [34]. Recent studies show that Al exposure remains a risk despite these advances. In Iraq, a study found that HD patients had mean serum Al levels of 21.0 ± 16.0 µg/dL, with 81% exceeding the recommended threshold of 2 µg/dL [35]. Conversely, Taiwanese studies showed a lower mean serum Al level (1.0 ± 0.4 µg/dL), with just 2.2% of patients above the 2 µg/dL. This diversity emphasizes regional monitoring and water quality requirements [36]. To reduce toxicity risk, the National Kidney Foundation’s KDOQI recommends keeping serum aluminum levels below 2 µg/dL in HD patients. Patients with a history of Al exposure, unexplained anemia, or bone disease should have their serum Al levels monitored regularly [17].
This research involved the collection of drinking water samples from two representative sources used by the study population. The samples provided an initial assessment of water quality and potential exposure to trace elements; however, the limited sample size may not sufficiently capture temporal or spatial variability. Future research should include more extensive sampling across diverse locations and time periods. Recent studies indicate that advanced analytical methods, including chemometric modeling and source apportionment techniques such as Positive Matrix Factorization and Monte Carlo Simulation, enhance the accuracy of water quality and risk assessment [37].
Hemodialysis affects serum Mg levels [38]. Humans with normal renal function have tightly regulated serum Mg levels between 0.65 and 1.05 mmol/L. Renal excretion impairment disrupts this equilibrium in HD patients. Research indicates that pre-dialysis serum Mg levels are typically above normal, with mean values of 1.11 ± 0.14 mmol/L and hypermagnesemia in 73.65% of patients. Dialysate Mg concentration affects serum Mg levels, which drop by 0.14 mmol/L post-dialysis [38]. Lower dialysate Mg concentrations (e.g., 0.5 mmol/L) reduce serum Mg levels, while greater values may cause moderate hypermagnesemia [39]. Optimizing patient management and reducing complications requires understanding these consequences. Both hypo- and hypermagnesemia are linked to higher death rates in HD patients, emphasizing the need for proper Mg management [40].
Essential trace element chromium is involved in glucose metabolism [41]. Diet, dialysis equipment infection, and renal clearance can affect HD patients’ serum Cr levels. High serum Cr levels in HD patients are linked to malnutrition and inflammation, suggesting a complex relationship between Cr status and patient health [42]. The effect of HD on serum Cr concentrations is unknown, requiring further research.
A trace element with minimal biological activity, barium can be hazardous at high doses. Few data exist on HD and serum Ba levels. Ba can build up in patients with renal impairment. Hence, HD patients’ barium levels should be monitored and researched to minimize hazardous effects.
This study found elevated whole blood chromium and nickel concentrations in particular subgroups of hemodialysis patients, notably among individuals with industrial occupational exposure. Chromium and nickel are essential trace elements required in minimal concentrations; however, excessive exposure can result in oxidative stress, nephrotoxicity, and a range of systemic effects. Previous studies have defined standard reference ranges for blood chromium and nickel, highlighting their potential toxicological impacts when concentrations exceed physiological thresholds [43–45]. The measured concentrations primarily aligned with established ranges for the general population; however, elevated levels observed in specific occupationally exposed individuals underscore the need for ongoing monitoring and preventive strategies. The findings align with existing literature, indicating that even minor elevations in Cr and Ni may pose risks to individuals with compromised immune systems, such as those suffering from kidney issues.
Influence of geographical and environmental factors
Urban inhabitants showed greater mean blood Ni levels, whereas rural populations had higher As levels. These discrepancies may be due to setting-specific environmental exposures. Urban industrial operations and vehicle pollution can raise Ni exposure, whereas pesticide-treated agriculture and groundwater contamination in rural areas may increase As levels. A study of metal combinations in urban and rural American populations identified different metal exposure patterns, suggesting different natural and human sources [46]. Rural groundwater As contamination is a major issue. A study of rural Limpopo, South Africa, found that As-contaminated water raised blood As levels [47]. These findings emphasize the importance of geographical and environmental contexts in metal exposure risk assessment. These exposures must be mitigated by tailored public health measures that meet urban and rural needs. Participants living near plastic factories had greater blood Al levels than those living farther away. This confirms that industrial pollution affects trace element exposure and that environmental metal contamination sources contribute to trace element body burdens.
The study found hypertensive participants had lower blood Cr and higher blood Ni and As levels. Diabetics had decreased blood Cr and higher blood Pb levels. This study supports previous research that trace metal abnormalities may contribute to hypertension and diabetes. Diabetics often lack Cr, an essential trace element in glucose metabolism and insulin sensitivity, which may worsen insulin resistance and glucose homeostasis [48, 49]. Both hypertensive and diabetic subjects had reduced blood Cr levels, suggesting a metabolic disruption. In hypertensive and diabetic people, PTEs such as Ni, As, and Pb are higher, supporting the idea that heavy metal exposure may cause cardiometabolic illnesses. Navas-Acien et al. 2008 and Hou et al. 2013 linked As to oxidative stress, endothelial dysfunction, and inflammation, which cause hypertension and diabetes [50, 51]. Ni exposure also raises blood pressure and causes vascular dysfunction, suggesting its role in hypertension [52, 53]. These findings stress the need for more research on trace metal dysregulation and metabolic and cardiovascular health, as well as the need for environmental and dietary strategies to reduce heavy metal exposure in sensitive populations.
Our multivariable logistic regression analysis findings are consistent with recent studies in the literature. Ammar et al. 2023 study showed significant migration of aluminum from cooking pots into food, especially under acidic conditions and high temperature [54]. The toxic-metal content of cigarettes has been reviewed recently, confirming high levels of cadmium, lead, nickel, and other heavy metals in tobacco products which contribute substantially to body burden in smokers [55]. Occupational exposures have similarly been implicated; workers in industrial settings often show elevated vanadium levels, consistent with its known bioavailability and mobility in contaminated soils and emissions [56].
Previous studies in the literature showed that anemia can result from Mg shortage, which is needed for many enzymatic activities, including hemoglobin production [57]. Zn is essential for erythropoiesis and hemoglobin levels. As is hazardous, yet some investigations have found trace levels in human tissues; however, its effect on hematological parameters is unclear and needs further study [58]. The current study’s correlation analysis showed substantial relationships between trace element levels and hematological parameters, suggesting that micronutrients may affect erythropoiesis and anemia therapy. For instance, hemoglobin levels correlated positively with B, Mg, Zn, and As. However, weekly erythropoietin dose negatively correlated with B, Mg, and As. Higher endogenous Mg levels may increase erythropoiesis and reduce the requirement for exogenous erythropoietin (EPO) therapy, as the negative correlation between EPO dose per week and magnesium implies. This is important in chronic renal disease, where EPO is used to treat anemia. Understanding these correlations may help optimize anemia treatment by correcting trace element shortages through nutritional interventions. These findings should be interpreted cautiously because correlation does not imply causality, and more research is needed to understand the mechanisms and make treatment recommendations.
Recent studies highlight a persistent deficiency of essential trace elements such as Se in HD patients, contrasted by accumulation of PTEs such as Mn, Pb, and Cd. A meta-analysis of randomized controlled trials (RCTs) confirmed that Se supplementation significantly increases plasma Se levels in this population, although it failed to produce meaningful improvements in lipid profiles, inflammation, or hemoglobin levels [59]. A recent study of erythrocytes from ESRD patients found significantly reduced Fe and Zn, yet increased Mn, Li, Pb, and Cd, compared to healthy controls highlighting impaired excretion and potential intracellular burdens even when serum levels might be unremarkable [60]. In a multicenter study from Jordan, HD patients exhibited markedly higher blood Pb, Cd, and Cu and lower Zn levels than healthy controls, with age-related accumulation patterns suggesting cumulative exposure risks [61]. Meanwhile, Trigueira et al. 2024 systematic review and meta-analysis reaffirmed that Se supplementation effectively restores plasma Se but yields inconsistent effects on antioxidant, inflammatory, and thyroid parameters [62].
Looking forward, the field is poised to transition toward multi-element profiling using advanced techniques such as Inductively Coupled Plasma Mass Spectrometry (ICP-MS) across various biological compartments e.g., (whole blood, and erythrocytes), to enhance detection of both deficiency and toxic accumulation. Such comprehensive monitoring will lay the groundwork for personalized supplementation strategies, targeting individual trace-element imbalances. At the same time, the tightening of international standards for dialysis water quality will reduce inadvertent exposure to harmful elements. Together, these developments indicate a paradigm shift from descriptive characterization toward integrated, outcome-oriented management, with the potential to improve clinical outcomes in dialysis patients.
This study has several limitations that should be acknowledged. First, it was conducted in a single-center setting with a relatively limited sample size, which may restrict the generalizability of the findings. In addition, dietary intake a potential confounding factor, was not comprehensively evaluated, which could have influenced trace-element levels. The cross-sectional design also precludes establishing causality between the observed disturbances and clinical outcomes. Despite these limitations, the study has notable strengths. To our knowledge, this study is among few studies that provide a comprehensive multi-element analysis in HD patients, including both essential and toxic trace elements. Moreover, the use of ICP-OES for whole-blood assessment adds methodological rigor and enhances sensitivity compared to conventional serum-only assessments. This investigation was also limited by the sampling of only two water sources. This complicates the application of water quality data across various sources and may not accurately reflect trace element concentrations over time and across different locations. The role of drinking water in trace element intake warrants careful consideration. Future research should employ broad, temporally stratified samples alongside advanced statistical and chemometric techniques to investigate water quality and health.
Conclusion
This study demonstrates marked disturbances in trace element balance among HD patients, with evidence of deficiencies in essential elements and accumulation of PTEs. Using ICP-OES, we provide a comprehensive multi-element profile that highlights the dual burden of deficiency and overload. This work offers important new insights into the intricate relationship that exists between the concentrations of trace elements, the environmental exposures, and the health condition of HD patients that underscoring the need for region-specific monitoring and preventive strategies. Clinically, our results reinforce the importance of incorporating trace element assessment into the routine care of HD patients and developing targeted supplementation protocols. Looking forward, future research should focus on multicenter, longitudinal studies that combine sensitive analytical platforms (such as ICP-MS) with clinical outcome measures. In addition, future efforts should aim to evaluate and modify environmental risk factors, alongside optimizing dialysis water quality standards, to reduce inadvertent trace elements exposure. Such strategies are expected to pave the way for evidence-based, personalized interventions that improve long-term outcomes in the HD population.
Supplementary Information
Below is the link to the electronic supplementary material.
Supplementary Material 1
The reference list from the paper itself. Each links out to its DOI / PubMed record.
- 1Bello AK, Levin A, Lunney M, Osman MA, Ye F, Ashuntantang GE, et al. Status of care for end stage kidney disease in countries and regions worldwide: international cross sectional survey. BMJ. 2019;367.10.1136/bmj.l 587331672760 · doi ↗ · pubmed ↗
- 2El-Shazly AN, Ibrahim SAE-H, El-Mashad GM, Sabry JH, Sherbini NS. Effect of zinc supplementation on body mass index and serum levels of zinc and leptin in pediatric Hemodialysis patients. Int J Nephrol Renovascular Disease. 2015:159–63.10.2147/IJNRD.S 94923 PMC 467765626677341 · doi ↗ · pubmed ↗
- 3Organization WH. Guidelines for drinking-water quality: incorporating the first and second addenda. World Health Organization; 2022.35417116 · pubmed ↗
- 4Moffett D, Smith-Simon C, Stevens Y-W. Toxicological profile for barium and barium compounds. 2007.38147518 · pubmed ↗
- 5Ryan T, Mc Elwain L, Murphy T, Arduino M, Anderson S. Elevated serum aluminum levels in hemodialysis patients associated with use of electric pumps–wyoming, 2007. MMWR: Mortality Weekly Report. 2008;57(25).18583956 · pubmed ↗
- 6Humudat YR, Al-Naseri SK. Heavy metals in dialysis fluid and blood samples from hemodialysis patients in dialysis centers in baghdad, Iraq. J Health Pollution. 2020;10(27).10.5696/2156-9614-10.27.200901 PMC 745380932874757 · doi ↗ · pubmed ↗
- 7Ustaoğlu F, Yüksel B, Yazman MM, Jaskuła J, Tokatlı C. Chemometric investigation of river system contamination: source identification and risk assessment using positive matrix factorization and Monte Carlo simulation. J Contam Hydrol. 2025:104627.10.1016/j.jconhyd.2025.10462740440967 · doi ↗ · pubmed ↗
- 8Zhao F, Pan D, Wang N, Xia H, Zhang H, Wang S, et al. Effect of chromium supplementation on blood glucose and lipid levels in patients with type 2 diabetes mellitus: a systematic review and meta-analysis. Biol Trace Elem Res. 2022:1–10.10.1007/s 12011-021-02693-333783683 · doi ↗ · pubmed ↗