Navigating the challenges of catheter ablation in patients with comorbid alcohol use disorder
Yue Liu, Jun Ye, Bing Zeng, Jianming Song, Yaoyang Huo, Fang Yu, Lixin Chen

TL;DR
This study shows that patients with alcohol use disorder undergoing catheter ablation face longer hospital stays and higher costs, but have lower in-hospital mortality.
Contribution
The study identifies unique clinical and economic outcomes in patients with alcohol use disorder undergoing catheter ablation.
Findings
Patients with AUD had longer hospital stays and higher costs after ablation.
AUD patients had higher rates of gastrointestinal complications like esophageal ulcers.
In-hospital mortality was paradoxically lower in the AUD group.
Abstract
Alcohol use disorder (AUD) is a significant risk factor for cardiac arrhythmias, contributing to arrhythmogenesis through direct myocardial toxicity and electrical remodeling. The present study evaluated the impact of AUD on clinical and economic outcomes following catheter ablation. The National Inpatient Sample (2010–2019) was used to identify and analyze adults who underwent catheter ablation. Patients were stratified based on the presence of an AUD diagnosis and balanced using a 1:5 propensity score matching for demographics and comorbidities. Outcomes were assessed using logistic regression, Pearson chi-square test, and the Wilcoxon rank-sum test. Among the 109,226 patients evaluated, 3,113 (2.85%) had AUD. The AUD cohort was younger, predominantly male, and had higher rates of smoking (40.6% vs. 16.5%), drug abuse (10.3% vs. 5.5%), and liver disease (11.3% vs. 7.8%). After…
Genes, proteins, chemicals, diseases, species, mutations and cell lines named across the full text — each resolved to its canonical identifier and authoritative record.
Click any figure to enlarge with its caption.
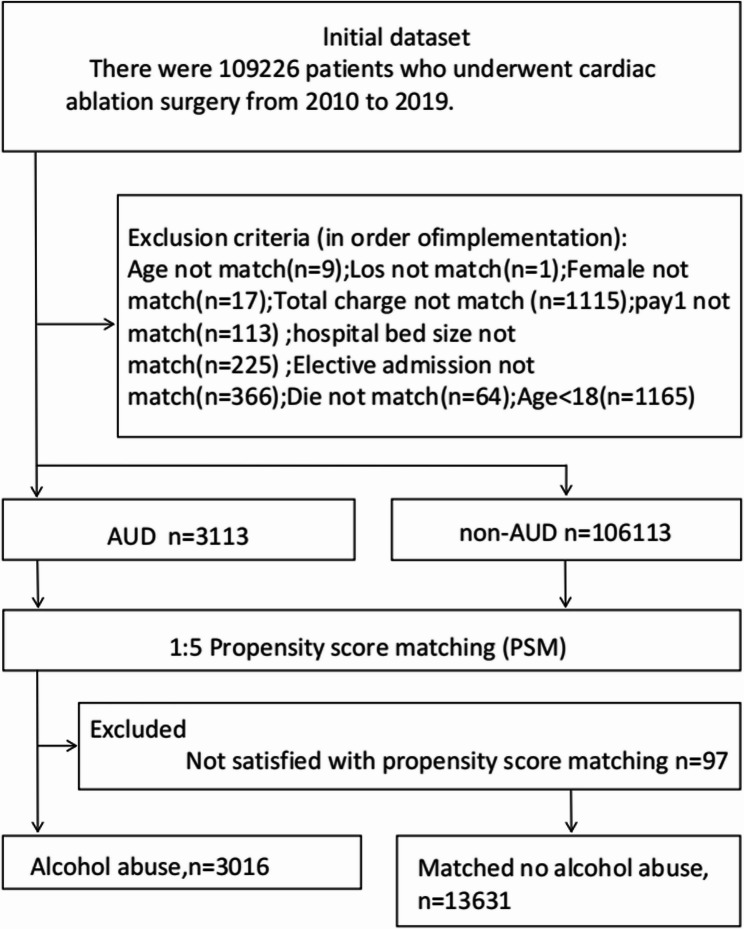 Figure 1
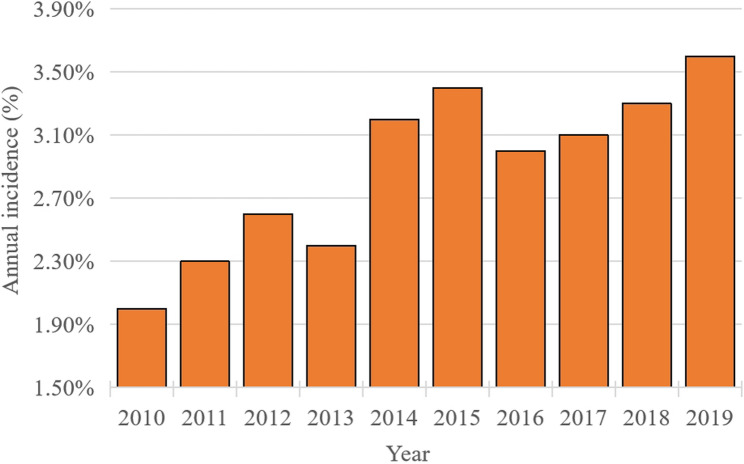 Figure 2
Peer Reviews
No public reviews on file for this paper yet. If you reviewed it on a platform where reviews are public (OpenReview, ICLR, NeurIPS, ICML), you can paste yours below so the community can read it here.
Videos
No videos yet. Explain this paper in a talk, walkthrough, or lecture? Add one.
Taxonomy
TopicsAlcohol Consumption and Health Effects · Substance Abuse Treatment and Outcomes · Atrial Fibrillation Management and Outcomes
Introduction
The association between alcohol consumption and cardiac arrhythmias has been recognized for more than a century, with reports of alcohol’s cardiotoxic effects dating back to the 1800 s [1]. This relationship typically exhibits a J-shaped dose-response pattern, in which heavy drinking substantially increases the likelihood of developing hypertension, alcoholic cardiomyopathy, and various arrhythmias, particularly atrial fibrillation (AF) [2]. Moreover, individuals with alcohol-related cardiac disease exhibit an increased susceptibility to life-threatening ventricular arrhythmias, such as ventricular tachycardia and sudden cardiac death, with these risks correlating directly with lifetime alcohol exposure [3].
Since the 1990 s, catheter ablation has remained the cornerstone therapy for cardiac rhythm disorders. Initially applied to simple supraventricular tachycardias, this technique is now a primary treatment approach for complex arrhythmias, including atrial fibrillation (AF) and ventricular tachycardia (VT) [4]. Nevertheless, while comprehensive data on ablation outcomes exist, real-world evidence remains limited for certain high-risk patient subgroups. Specifically, patients with alcohol use disorder (AUD) represent a challenging and understudied population who face heightened periprocedural risks. These risks are due to alcohol’s direct cardiotoxic effects and substantial comorbidity burden [5]. Notably, a significant gap remains in understanding periprocedural risks, including complication rates, length of stay, costs, and in-hospital mortality, specifically in arrhythmia patients with coexisting AUD.
We surmised that patients with AUD have a distinct risk profile and experience higher perioperative complication rates following catheter ablation compared with patients without AUD. To that end, we conducted a retrospective cohort study using a comprehensive, nationwide database. Our study aimed to characterize the impact of AUD on in-hospital outcomes post-ablation, with the goal of refining preoperative risk stratification and guiding personalized management for this population.
Methods
Data source
Data from the Nationwide Inpatient Sample (NIS) for 2010–2019 were analyzed [6]. As a cornerstone of the Healthcare Cost and Utilization Project (HCUP) sponsored by the Agency for Healthcare Research and Quality (AHRQ), the NIS represents the largest publicly available all-payer inpatient database in the United States (U.S.). It constitutes a 20% stratified sample of U.S. community hospitals, encompassing approximately 8 million hospitalizations annually from over 1,000 facilities across 44 states. Of note, this sampling frame captures around 90% of the nation’s nonprofit teaching hospitals. As the NIS contains publicly available, de-identified data, this study was exempt from institutional review board approval [7].
Study cohort
The study utilized the NIS database from 2010 to 2019, which contained data on 72,950,400 hospitalizations. From this initial pool, we identified patients with a primary diagnosis of cardiac arrhythmia who underwent catheter ablation using the relevant International Classification of Diseases (ICD-9-CM and ICD-10-CM) procedure codes (Table A).Herein, we included patients with atrial fibrillation, atrial flutter, supraventricular tachycardia, ventricular tachycardia, Wolff-Parkinson-White syndrome, premature contractions, or unspecified arrhythmias (Table 1). To avoid confounding the attribution of periprocedural complications, we excluded patients who underwent concurrent pacemaker or implantable cardioverter-defibrillator (ICD) implantation.
Table 1. Proportions of specific arrhythmia subtypes ablated in the AUD study populationArrhythmia SubtypeAfter matchingnon-AUDAUDp valueCatheter ablation procedure13,171(96.6%)2878(95.4%)0.001Atrial Fibrillation8425(61.8%)1786(59.2%)0.008Atrial flutter6232(45.7%)1626(53.9%)<0.001Supraventricular tachycardia3691(27.1%)844(28.0%)0.312Ventricular tachycardia2761(20.3%)481(15.9%)<0.001Wolff-Parkinson-White syndrome/preexcitation syndrome492(3.6%)112(3.7%)0.782other premature beats267(2.0%)62(2.1%)0.729AUD Alcohol Use Disorder
From an initial cohort of 109,226 patients who underwent ablation, we excluded 1,165 individuals for being under 18 years of age or having non-elective hospitalizations. Next, 1:5 propensity score matching (PSM) (caliper width = 0.01) was performed based on baseline characteristics, achieving an exclusion rate of 3.1%. Consequently, a final analytical cohort of 16,647 patients was achieved and they were further categorized into two groups: those with a documented history of AUD (n = 3,016) and those without such a history (n = 13,631) (Fig. 1). A recognized limitation of using administrative data in this context is that the International Classification of Diseases (ICD) codes for alcohol use disorder (AUD) do not differentiate between past and current use.
Fig. 1 Patient Selection Flowchart
The NIS database provides comprehensive patient-level data on demographics (age, sex, race), insurance status, hospital characteristics, and pertinent comorbidities. Here, our primary outcome was in-hospital and all-cause mortality. Secondary outcomes included length of stay (LOS), total healthcare costs, and perioperative complications, which were systematically identified using standardized ICD diagnostic codes (Table B). All measured baseline covariates were included in the model to balance the cohorts (Table 2).
Table 2. Demographic and comorbidities characteristic of study cohortsDemographic/comorbidityBefore matchingAfter matchingnon-AUDAUDp valuenon-AUDAUDp valueTotal (n = count)106,113311313,6313016Total incidence (%)2.85(3113/109226)18.12(3,016/16,647)Age (median, years)67.0 (58.0, 75.0)60.0(53.0, 67.0)0.00062.0 (52.0,71.0)60.0(53.0, 68.0)< 0.001Age group (%) 18–4428.847.2< 0.00143.646.6< 0.001 45–6429.133.728.533.9 65–7427.716.019.716.4 ≥ 7514.53.18.13.2Gender (%) Male60.686.9< 0.00186.886.60.748 Female39.413.113.213.4Race (%) White74.067.0< 0.00168.267.60.505 Black9.416.314.615.9 Hispanic5.36.66.56.6 Asian or Pacific Islander1.50.90.90.9 Native American0.30.70.60.7 Other9.58.58.28.6LOS (median, d)3.0 (2.0–6.0)4.0 (3.0–8.0)< 0.0014.0 (2.0–7.0)4.0 (2.0–8.0)< 0.001TOTCHG (median, $)101994.0(66902.0–155382.5.0.5)110971.0(72216.0–172424.0.0.0)< 0.001116503.0(77968.7–181360.0.7.0)118428.1(77900.7–183408.7.7.7)< 0.001Type of insure (%) Medicare58.940.4< 0.00142.741.20.001 Medicaid6.117.514.316.7 Private insurance30.429.231.729.8 Self-pay1.97.46.06.9 No charge0.21.31.01.3 Other2.44.14.24.0Bed size of hospital (%) Small8.48.90.3638.78.90.862 Medium21.121.821.421.8 Large70.569.369.969.4Elective admission (%)40.819.8< 0.00121.320.40.286Type of hospital (teaching %)78.981.9< 0.00181.181.90.275Location of hospital (urban, %)97.497.90.12597.897.80.838Region of hospital (%) Northeast23.821.80.04822.422.10.827 Midwest or North Central21.521.821.921.6 South39.640.239.340.2 West15.216.216.416.1Preoperative comorbidities Acquired immune deficiency syndrome215(0.2%)12 (0.4%)0.02742(0.3%)12 (0.4%)0.433 Deficiency anemia8057 (7.6%)299 (9.6%)<0.0011246 (9.1%)284 (9.4%)0.636 Rheumatoid arthritis/collagen vascular diseases2542 (2.4%)52 (1.7%)0.009257 (1.9%)51(1.7%)0.473 Chronic blood loss anemia485 (0.5%)13 (0.4%)0.74751 (0.4%)13 (0.4%)0.648 Congestive heart failure20,614 (19.4%)832 (26.7%)<0.0013451(25.3%)798 (26.5%)0.193 Chronic pulmonary disease23,359 (22.0%)991 (31.8%)<0.0014186(30.7%)946 (31.4%)0.480 Coagulopathy5011 (4.7%)359(11.5%)<0.0011296(9.5%)322(10.7%)0.050 Depression8293 (7.8%)362 (11.6%)<0.0011404 (10.3%)340 (11.3%)0.114 Diabetes, uncomplicated21,108 (19.9%)448 (14.4%)<0.0012043(15.0%)437 (14.5%)0.487 Diabetes withchronic complications8125(7.7%)208 (6.7%)0.043934(6.9%)199 (6.6%)0.616 Drug abuse1283 (1.2%)370(11.9%)<0.001753(5.5%)311(10.3%)<0.001 Hypertension71,763 (67.6%)2192 (70.4%)0.0019590 (70.4%)2121 (70.3%)0.974 Hypothyroidism15,510 (14.6%)225 (7.2%)<0.0011011 (7.4%)219 (7.3%)0.767 Liver disease2314 (2.2%)413(13.3%)<0.0011069 (7.8%)342(11.3%)<0.001 Lymphoma702(0.7%)10 (0.3%)0.02052(0.4%)10(0.3%)0.684 Fluid and electrolyte disorders17,841 (16.8%)874 (28.1%)<0.0013491 (25.6%)816 (27.1%)0.101 Metastatic cancer581 (0.5%)13(0.4%)0.33167(0.5%)13(0.4%)0.664 Other neurological disorders3544 (3.3%)155 (5.0%)<0.001656 (4.8%)144(4.8%)0.930 Obesity20,291 (19.1%)636 (20.4%)0.0682866(21.0%)624 (20.7%)0.682 Paralysis847 (0.8%)26 (0.8%)0.819110 (0.8%)24 (0.8%)0.950 Peripheral vascular disorders7913(7.5%)250 (8.0%)0.2301058(7.8%)241 (8.0%)0.671 Psychoses1865(1.8%)151 (4.9%)<0.001533(3.9%)138 (4.6%)0.093 Pulmonary circulation disorders4087 (3.9%)143 (4.6%)0.034604(4.4%)135 (4.5%)0.913 Renal failure18,109 (17.1%)420 (13.5%)<0.0011898 (13.9%)406 (13.5%)0.506 Solid tumor without metastasis1517 (1.4%)46 (1.5%)0.824179(1.3%)45(1.5%)0.440 Peptic ulcer disease excluding bleeding188 (0.2%)9 (0.3%)0.14740 (0.3%)8(0.3%)0.794 Valvular disease9557 (9.0%)307 (9.9%)0.1011288 (9.4%)291 (9.6%)0.735 Weight loss2307(2.2%)125(4.0%)<0.001460(3.4%)117(3.9%)0.170 Smoker3910(28.7%)1565(51.9%)<0.0012244(16.5%)1224(40.6%)<0.001Number of Comorbidity (%) 012.60.0< 0.0019.45.6< 0.001 120.65.417.816.0 221.115.519.820.8 ≥ 345.979.153.057.7
Statistical analysis
We first determined the overall prevalence of AUD among patients undergoing catheter ablation between 2010 and 2019 (Fig. 2). To assess the independent association of AUD with post-procedural complications, we controlled for potential confounders, including age, demographics, hospital characteristics, and comorbidities. This process yielded 3,016 well-matched pairs. Balance was achieved, with all standardized mean differences below 0.10 (Table 2).
Fig. 2 Temporal Trend in the Prevalence of AUD
Continuous variables were analyzed using the Wilcoxon rank-sum test, and categorical variables were compared with Pearson’s chi-square test. We used univariate and multivariate logistic regression to assess the association between AUD and post-procedural complications. These models generated unadjusted (uOR) and adjusted odds ratios (aOR) with 95% confidence intervals (CIs). A two-sided P-value < 0.05 was considered statistically significant. All reported cost data were normalized to U.S. dollars (2019) using the consumer price index. Results are detailed in Table 3.
Table 3. Association between AUD and post-procedural complications: univariate and multivariable analysisPerioperative complicationBefore matchingAfter matchingnon-AUDAUD p Unadjusted OR(uOR)95%CI p non-AUDAUD p Adjusted OR(aOR)95%CI p Cardiac complications47,201 (44.5%)1683 (54.1%)< 0.0011.141.05–1.220.0017065 (51.8%)1626 (53.9%)0.0381.030.95–1.110.510 Myocardial infarction3375(3.2%)163(5.2%)< 0.0011.201.02–1.410.031625(4.6%)155(5.1%)0.1930.990.82–1.190.926 Atrioventricular block19,405(18.3%)616(19.8%)0.0330.970.88–1.060.4492807(20.6%)603(20.0%)0.4600.910.82–1.00.82.000.060 Cardiac arrest945(0.9%)42(1.3%)0.0081.200.88–1.650.253191(1.4%)40(1.3%)0.7500.950.67–1.360.812 Heart failure33,248(31.3%)1246(40.0%)< 0.0011.161.07–1.25< 0.0016078(44.6%)1436(47.6%)0.0031.080.99–1.170.051 Myocardial ischemia1429(1.9%)84(2.7%)< 0.0011.381.10–1.730.006279(2.0%)81(2.7%)0.0291.200.92–1.550.175 Acute myocardial infarction4390(4.1%)187(6.0%)< 0.0011.171.01–1.370.042759(5.6%)178(5.9%)0.4720.970.82–1.160.747Pericardial complications4723(4.5%)95(3.1%)< 0.001 Acute pericarditis550(0.5%)7(0.2%)0.02369(0.5%)7(0.2%)0.043 Hemopericardium349(0.3%)6(0.2%)0.18840(0.3%)6(0.2%)0.371 Cardiac tamponade1213(1.1%)20(0.6%)0.009138(1.0%)20(0.7%)0.073Vascular complications230 (0.2%)5 (0.2%)0.5050.750.31–1.830.530 Arteriovenous fistula104(0.1%)1(0.0%)0.3810.360.05–2.590.3588(0.1%)1(0.0%)0.9100.660.08–5.410.695 Vascular damage4(0.0%)0(0.0%)1.0002(0.0%)0(0.0%)1.000 Retroperitoneal injury23(0.0%)1(0.0%)0.5001.010.13–7.660.9946(0.0%)1(0.0%)1.0000.540.06–4.880.588 Heart damage36(0.0%)1(0.0%)1.0000.890.12–6.600.9077(0.1%)1(0.0%)1.0000.500.06–4.230.523 Vascular complications of surgery72(0.1%)2(0.1%)1.0001.100.27–4.530.8955(0.0%)2(0.1%)0.8202.550.49–13.250.263Pulmonary complications7911 (7.5%)354 (11.4%)< 0.0011.241.11–1.40< 0.0011468 (10.8%)338 (11.2%)0.4850.920.80–1.040.185 Pneumothorax and hemothorax395(0.4%)11(0.4%)0.8640.970.53–1.780.93261(0.4%)10(0.3%)0.3770.720.36–1.430.347 Postoperative respiratory failure7346(6.9%)331(10.6%)< 0.0011.231.09–1.390.0011394(10.2%)316(10.5%)0.6810.890.78–1.020.099 Septal muscle paralysis and Phrenic nerve injury145(0.1%)8(0.3%)0.1272.030.99–4.200.05521(0.2%)8(0.3%)0.1851.920.83–4.440.128 Pulmonary embolism463(0.4%)21(0.7%)0.0491.120.72–1.750.61597(0.7%)20(0.7%)0.7730.850.51–1.400.530 Acute respiratory failure5233(4.9%)260(8.4%)<0.0011.351.18–1.55< 0.001976(7.2%)248(8.2%)0.0431.030.88–1.200.671 Pneumonia3959(3.7%)178(5.7%)< 0.0011.211.03–1.420.018746(5.5%)172(5.7%)0.6160.910.76–1.080.290Gastrointestinal complications895 (0.8%)46 (1.5%)< 0.0011.601.18–2.160.002130(1.0%)42 (1.4%)0.0311.370.95–1.970.088 Esophagitis283(0.3%)24(0.8%)< 0.0012.591.69–3.96< 0.00152(0.4%)22(0.7%)0.0091.590.94–2.680.081 Esophageal ulcers101(0.1%)12(0.4%)< 0.0014.222.28–7.81< 0.00118(0.1%)11(0.4%)0.0062.461.12–5.390.025 Esophageal strictures229(0.2%)8(0.3%)0.6261.200.59–2.450.61825(0.2%)8(0.3%)0.3601.390.61–3.170.436 Esophageal perforation5(0.0%)0(0.0%)1.0001(0.0%)0(0.0%)1.000 Gastro-esophageal laceration-hemorrhage syndrome18(0.0%)1(0.0%)0.4232.060.27–15.940.4891(0.0%)1(0.0%)0.3303.800.23–63.640.353 Gastroparesis313(0.3%)4(0.1%)0.0890.350.13–0.930.03543(0.3%)3(0.1%)0.0410.340.10–1.130.078 Gastrointestinal bleeding639(0.6%)33(1.1%)0.0011.491.04–2.130.03095(0.7%)33(1.1%)0.0241.480.97–2.230.065Genitourinary disease16,923(15.9%)649(20.8%)< 0.0011.030.94–1.130.4962737(20.1%)616(20.4%)0.6690.980.88–1.090.741Acute kidney injury13,418(12.6%)568(18.2%)< 0.0011.121.01–1.230.0302299(16.9%)537(17.8%)0.2141.020.91–1.130.749Inflammatory diseases of the central nervous system26(0.0%)3(0.1%)0.0492.160.62–7.510.2279(0.1%)3(0.1%)0.8071.100.28–4.360.896Convulsion419(0.4%)26(0.8%)< 0.0011.841.23–2.760.00376(0.6%)24(0.8%)0.1261.360.85–2.190.202Postoperative delirium775(0.7%)47(1.5%)< 0.0011.891.40–2.55< 0.001143(1.0%)46(1.5%)0.0261.380.97–1.940.071Stroke1952 (1.8%)59(1.9%)0.8201.080.83–1.410.559242 (1.8%)59(2.0%)0.5001.190.88–1.600.249Embolism1496 (1.4%)57 (1.8%)0.0501.010.77–1.320.956268 (2.0%)54 (1.8%)0.5260.920.68–1.250.589Postoperative shock350 (0.3%)11(0.4%)0.8221.080.59–1.980.80965(0.5%)10(0.3%)0.2810.800.40–1.570.512Blood transfusion3932 (3.7%)117 (3.8%)0.8780.940.78–1.140.513584(4.3%)111(3.7%)0.1330.920.74–1.140.460Septicemia1904(1.8%)99(3.2%)< 0.0011.291.05–1.590.017415(3.0%)91(3.0%)0.9370.870.70–1.140.374Chest pain2636(2.5%)101(3.2%)0.0071.020.83–1.250.843393(2.9%)98(3.2%)0.2820.970.77–1.230.815Electrolyte imbalance15,028(14.2%)773(24.8%)< 0.0011.471.35–1.61<0.0012988(21.9%)719(23.8%)0.0221.020.92–1.120.748Severe malnutrition2661(2.5%)130(4.2%)< 0.0011.361.13–1.630.001470(3.4%)120(4.0%)0.1541.110.90–1.370.331Acute respiratory distress syndrome4363(4.1%)198(6.4%)< 0.0011.311.13–1.53< 0.001767(5.6%)192(6.4%)0.1151.040.88–1.240.616Continuous trauma ventilation3135(3.0%)137(4.4%)< 0.0011.211.01–1.450.038539(4.0%)133(4.4%)0.2501.040.85–1.270.704Thrombocytopenia3694(3.5%)263(8.4%)< 0.0012.071.80–2.36< 0.001962(7.1%)238(7.9%)0.1091.040.89–1.220.605Liver disease81(0.1%)10(0.3%)< 0.0013.131.57–6.240.00124(0.2%)10(0.3%)0.0871.560.72–3.380.263Hemorrhage/Seroma/Hematoma2308(2.2%)43(1.4%)0.0030.710.52–0.960.028262(1.9%)42(1.4%)0.0490.790.56–1.100.158OR Odds ratio, CI Confidence interval
To investigate the apparent survival advantage in the AUD cohort, we first performed a pre-specified subgroup analysis of in-hospital mortality by admission type (emergency vs. non-emergency; Table 4). To further explore this finding, we conducted a post-hoc sensitivity analysis of all recorded in-hospital deaths (n = 212) from the matched cohort. Among the patients who died, we compared demographics, hospital characteristics, and comorbidities between those with and without AUD (Table 5).
Table 4. In-hospital outcomes were compared by the presence of patients with AUD after arrhythmia ablationOutcomeBefore matchingAfter matchingnon-AUDAUDp valuenon-AUDAUDp valueIn-hospital mortality891(0.9%)18(0.6%)0.045194(1.4%)18(0.6%)< 0.001In-hospital mortality by admission type Emergency admissions164/10,732 (1.5%)17/2401 (0.7%)0.002 Non-emergency admissions30/2899 (1.0%)1/615 (0.2%)0.036Total complications66,479(62.6%)2422(77.8%)< 0.0019759(71.6%)2334(77.4%)< 0.001LOS (median, d)3.0 (2.0–6.0)4.0 (3.0–8.0)< 0.0014.0 (2.0–7.0)4.0 (2.0–8.0)< 0.001TOTCHG (median, $)101994.0(66902.0–155382.5.0.5)110971.0(72216.0–172424.0.0.0)< 0.001116503.00(77968.65–181360.00.65.00)118427.97(77900.67–183408.72.67.72)< 0.001LOS Length of stay, TOTCHE Total charge
Table 5. Baseline characteristics and comorbidities of deceased patients stratified by AUD statusDemographic/comorbidityAfter matchingnon-AUDAUDp valueAge group (%) 18–4430.427.80.440 45–6427.844.4 65–7427.322.2 ≥ 7514.45.6Gender (%) Male87.11000.105 Female12.90.0Race (%) White72.272.20.606 Black16.05.6 Hispanic4.15.6 Asian or Pacific Islander0.50.0 Native American0.50.0 Other6.716.7Type of insure (%) Medicare59.361.10.568 Medicaid13.411.1 Private insurance23.722.2 Self-pay1.05.6 Other2.60.0Bed size of hospital (%) Small9.311.10.954 Medium15.516.7 Large75.372.2Elective admission (%)15.55.60.255Type of hospital (teaching %)82.5100.00.053Location of hospital (urban, %)97.4100.00.491Preoperative comorbidities Deficiency anemia31 (16.0%)5 (27.8%)0.202 Rheumatoid arthritis/collagen vascular diseases3(1.5%)0(0.0%)0.595 Chronic blood loss anemia2 (1.0%)0 (0.0%)0.665 Congestive heart failure101(52.1%)10(55.6%)0.776 Chronic pulmonary disease69(35.6%)8(44.4%)0.454 Coagulopathy81(41.8%)8(44.4%)0.825 Depression23 (11.9%)0 (0.0%)0.230 Diabetes, uncomplicated29(14.9%)4 (22.2%)0.415 Diabetes withchronic complications23(11.9%)2 (11.1%)0.925 Drug abuse3(1.5%)4(22.2%)<0.001 Hypertension130 (67.0%)9 (50.0%)0.146 Hypothyroidism12(6.2%)2 (11.1%)0.421 Liver disease37(19.1%)4(22.2%)0.746 Lymphoma1(0.5%)0(0.0%)0.760 Fluid and electrolyte disorders147(75.8%)13 (72.2%)0.738 Metastatic cancer9(4.6%)1(5.6%)0.861 Other neurological disorders46(23.7%)5(27.8%)0.699 Obesity37(19.1%)6 (33.3%)0.150 Paralysis5 (2.6%)0 (0.0%)0.491 Peripheral vascular disorders26(13.4%)2 (11.1%)0.784 Psychoses5(2.6%)1 (5.6%)0.466 Pulmonary circulation disorders31(16.0%)0 (0.0%)0.066 Renal failure70 (36.1%)10 (55.6%)0.103 Solid tumor without metastasis9(4.6%)0(0.0%)0.350 Peptic ulcer disease excluding bleeding1(0.5%)0(0.0%)0.760 Valvular disease28 (14.4%)2 (11.1%)0.699 Weight loss49(25.3%)3(16.7%)0.418 Smoker18(9.3%)3(16.7%)0.316Number of Comorbidity (%) 01.00.00.840 12.65.6 28.811.1 ≥ 387.683.3
Results
Baseline characteristics
From 2010 to 2019, the annual incidence of AUD among patients undergoing catheter ablation increased steadily (Fig. 2). Within the total cohort of 109,226 patients, 3,113 (2.85%) had a documented diagnosis of AUD. Prior to PSM, we found that patients with AUD were significantly younger (median age 60.0 vs. 67.0 years, P < 0.001) and more likely to be male (86.9% vs. 60.6%, P < 0.001). Following 1:5 PSM, the final analysis included 3,016 patients with AUD and 13,631 matched comparators without AUD. The matched cohorts were well-balanced for all baseline characteristics, as detailed in Table 2.
Hospital care characteristics
Prior to matching, patients with AUD had a longer median length of stay (4.0 days vs. 3.0 days, P < 0.001) and incurred higher total hospitalization charges (116,503, P < 0.001) (Table 4). Insurance coverage also differed significantly between the cohorts (P < 0.001). Specifically, patients with AUD had a lower rate of Medicare coverage (40.4% vs. 58.9%) but a higher rate of Medicaid coverage (17.5% vs. 6.1%) compared to non-AUD patients.
Comorbidity profile
Before PSM, patients with AUD had a significantly higher burden of comorbidities, including congestive heart failure (26.7% vs. 19.4%), chronic pulmonary disease (31.8% vs. 22.0%), coagulopathy (11.5% vs. 4.7%), and drug abuse (11.9% vs. 1.2%) (all P < 0.001). After matching, significant disparities persisted, with the AUD cohort demonstrating markedly higher rates of drug abuse (10.3% vs. 5.5%), smoking (40.6% vs. 16.5%), and liver disease (11.3% vs. 7.8%) compared to non-AUD controls (all P < 0.001; Table 2).
Risk factors for adverse outcomes
Multivariate logistic regression identified several factors associated with post-procedural complications in patients with AUD. Advanced age (≥ 65 years), female sex, Black or Native American race, a higher Charlson Comorbidity Index, and insurance status, including Medicaid, self-pay, or uninsured status, were significantly associated with an increased risk of complications. Conversely, elective admission and larger hospital bed size were protective factors (Table 6).
Table 6. Risk factors associated with AUDVariableMultivariate Logistic RegressionUnadjusted OR(uOR)Wald 95%CIp valueAge ≥ 65 years old0.540.49–0.61<0.001Female0.240.22–0.27<0.001Race WhiteRef———— Black1.171.05–1.310.005 Hispanic0.990.84–1.160.885 Asian or Pacific Islander0.580.39–0.850.006 Native American1.891.17–3.050.009 Other0.950.83–1.090.444Number of Comorbidity 0Ref———— 11.721.42–2.08<0.001 22.361.93–2.88<0.001 ≥ 32.932.32–3.70<0.001Type of insurance MedicareRef———— Medicaid1.781.56–2.04<0.001 Private insurance1.040.92–1.160.545 Self-pay2.552.14–3.04<0.001 No charge3.642.51–5.29<0.001 Other1.441.17–1.76<0.001Bed size of hospital SmallRef———— Medium0.890.77–1.030.123 Large0.830.73–0.950.006Elective admission0.470.43–0.52<0.001Teaching hospital1.030.92–1.140.638Urban hospital1.030.79–1.360.818Region of hospital NortheastRef———— Midwest or North Central1.191.06–1.330.003 South1.050.95–1.170.320 West1.171.03–1.330.014OR Odds ratio, CI Confidence interval
Postoperative complications
Following PSM and multivariate adjustment, patients with AUD demonstrated a significantly elevated risk of gastrointestinal complications compared to their non-AUD counterparts (1.4% vs. 1.0%, aOR: 1.44, 95% CI: 1.03–2.00, P = 0.031). This risk was particularly pronounced for esophageal ulcers (0.4% vs. 0.1%, aOR: 2.46, 95% CI: 1.12–5.39, P = 0.025). In contrast, the incidence of other postoperative complications, including cardiac, vascular, pulmonary, genitourinary, and infectious events, was comparable between the cohorts. Strikingly, despite the increased morbidity, the AUD cohort exhibited significantly lower in-hospital mortality (0.6% vs. 1.4%, P < 0.001) after matching (Table 4).
Analysis of mortality in patients with AUD
Demographic and clinical differences were observed among patients who died. As detailed in Table 5, deceased patients in the AUD cohort were disproportionately male (100% vs. 87.1%, P = 0.105) and a greater proportion were aged 45–64 years (44.4% vs. 27.8%, P = 0.440), although these differences did not reach statistical significance. Critically, AUD decedents had a much higher prevalence of concomitant drug abuse (22.2% vs. 1.5%, P < 0.001). Conversely, they demonstrated a lower burden of several cardiovascular and metabolic comorbidities, including pulmonary circulation disorders (0.0% vs. 16.0%, P = 0.066) and uncomplicated hypertension (50.0% vs. 67.0%, P = 0.146). A non-significant trend also indicated a lower prevalence of depression (0.0% vs. 11.9%, P = 0.230). Furthermore, a smaller proportion of AUD decedents had three or more comorbid conditions (83.3% vs. 87.6%).
Discussion
AUD constitutes a clinically significant comorbid condition in patients undergoing treatment for cardiac arrhythmias. Sustained heavy drinking drives disease progression through dual mechanisms of myocardial structural alteration and electrical remodeling, collectively enhancing susceptibility to arrhythmogenesis [5]. Examination of 109,226 catheter ablation procedures documented in the NIS database from 2010 to 2019 revealed 3,113 (2.85%) individuals with concurrent AUD. Throughout this decade, the annual prevalence of AUD within this clinical population showed a consistent upward trajectory (Fig. 2), a pattern that highlights the clinical imperative to delineate procedural outcomes in this expanding patient group [8]. Although catheter ablation represents a well-established intervention for rhythm disorders [9], our investigation reveals that AUD patients manifest a characteristic and heightened susceptibility to particular post-procedural complications, with gastrointestinal manifestations, including esophagitis and esophageal ulceration, being particularly prominent.
The significantly elevated esophageal ulcer incidence observed in our AUD cohort (0.4% vs. 0.1%, P = 0.006) represents a clinically significant finding. This complication likely results from synergistic effects between alcohol-induced esophageal vulnerability and ablation-related procedural stress. Chronic alcohol intake is known to compromise esophageal integrity via multiple mechanisms, including reducing lower esophageal sphincter pressure, enhancing gastric acid secretion, and diminishing protective salivary bicarbonate production [10]. Moreover, alcohol induces manometric abnormalities, including heightened esophageal contraction amplitude, potentially representing compensatory responses that nonetheless contribute to esophageal dysmotility and functional instability [11]. Over time, this predisposition can impair mucosal defenses. During catheter ablation, the delivery of thermal energy near the esophageal wall could therefore affect tissues that are already weakened [12]. The procedure may not necessarily create de novo injury but could rather induce or intensify chronic, subclinical esophagopathy, triggering increased clinical complications. This pathophysiological sequence emphasizes the necessity for improved preoperative risk stratification and deployment of customized protective protocols.
Appropriate preventive strategies include meticulous intraoperative esophageal monitoring, such as luminal temperature sensing, combined with optimized ablation parameters (reduced power and shorter duration) and, when feasible, the use of mechanical displacement devices to increase the distance between the atrium and esophagus [13]. These targeted measures are important for limiting the combined risk posed by chronic alcohol-related esophageal fragility and procedure-related thermal injury, ultimately improving the safety of catheter ablation in this vulnerable patient group.
Patients with AUD also experienced prolonged LOS and higher healthcare costs, driven primarily by a greater comorbidity burden and a higher incidence of post-procedural complications. Previous studies indicate that individuals with AUD often present with more complex clinical presentations, necessitating more intensive medical management and extended hospitalization [14]. The economic impact of catheter ablation in this population is substantial, reflecting not only the cost of specialized ablation equipment and institutional as well as professional fees but also the additional resources required to manage complications. As a result, the financial burden is disproportionately higher for patients with AUD compared with those without AUD. Addressing these challenges will require strategies that optimize patient selection, standardize clinical pathways, and incorporate cost-effective technologies. Such measures are crucial to help mitigate the economic impact on this vulnerable patient group [15].
Despite having higher complication rates and longer hospital stays, patients with AUD exhibited reduced in-hospital mortality, a paradoxical finding that warrants careful interpretation. This difference is likely explained by the younger age and distinct demographic characteristics of the AUD cohort undergoing ablation. Herein, patients with AUD were markedly younger than non-AUD counterparts, a disparity persisting after rigorous PSM (median age: 60.0 vs. 62.0 years, P < 0.001) (Table 2). This observation is consistent with established epidemiologic patterns showing that AUD is most prevalent in early to middle adulthood [16]. Consequently, AUD patients deemed eligible for catheter ablation inherently comprise a younger demographic possessing greater physiological reserve, potentially offsetting risks associated with their elevated comorbidity burden. Our sensitivity analysis of mortality cases (Table 5) further supports this trend, revealing that AUD decedents concentrated more frequently in younger age brackets relative to non-AUD decedents. Thus, the observed survival advantage likely represents a reflection of selection bias rather than any protective biological effect of AUD. AUD patients who undergo ablation appear to represent a younger and potentially more resilient subset of the broader AUD population, a pattern that has also been reported in other clinical settings involving hospitalized patients with substance use disorders [17, 18].
Our pre-specified subgroup analysis of in-hospital mortality by admission type provides compelling evidence for selection bias. The survival advantage associated with AUD was most pronounced in the non-emergency admission subgroup, where mortality was 80% lower in AUD patients (0.2% vs. 1.0%; P = 0.036), compared with a 53% reduction in the emergency subgroup (0.7% vs. 1.5%; P = 0.002) (Table 4). This strongly indicates that AUD patients selected for elective ablation constitute a distinct, clini
cally more resilient subgroup. This finding aligns with established clinical practice, wherein elective procedural selection inherently filters out individuals with severe, decompensated AUD, yielding a cohort of “healthier survivors” within the broader AUD population [19]. Our sensitivity analysis of decedents (Table 5) further substantiates this interpretation of divergent risk profiles. Among deceased patients, those with AUD were younger and demonstrated a distinct comorbidity profile, marked by higher rates of concomitant drug abuse but lower prevalence of chronic cardiopulmonary disease. These findings suggest that the pathways to in-hospital death differ between cohorts. In non-AUD patients, mortality appears to be driven predominantly by advanced age and progressive conditions like congestive heart failure (CHF), a well-established predictor of early post-ablation mortality in patients with AF [20], highlighting the adverse interplay between heart failure and arrhythmia outcomes [21]. Conversely, mortality in this selected AUD cohort was more commonly associated with acute events linked to their specific risk profile, including complications related to polysubstance use.
The structured, protocol-driven environment of an inpatient hospitalization may mitigate the acute risks prevalent in this population. Standardized care pathways are consistently associated with improved postoperative recovery and reduced complication rates [22]. For this selected AUD cohort, the implementation of comprehensive preoperative assessments and dedicated perioperative protocols, as recommended for other high-risk surgical populations [19, 23], could help optimize in-hospital management, thereby attenuating immediate risks and potentially contributing to the observed short-term mortality advantage. Despite extensive sensitivity analyses, including an assessment of sex disparities (Table 7), we found no additional compelling explanations for the mortality difference within the available data. Furthermore, although some studies suggest light-to-moderate alcohol consumption may have conferred cardioprotective benefits [24–26], these findings are unlikely to be applicable to a clinical AUD population undergoing catheter ablation. Consequently, the lower in-hospital mortality observed in the AUD group should not be interpreted as an indicator of improved long-term prognosis, but rather as a context-specific outcome driven by protocolized inpatient care.
Table 7. Characteristics and outcomes of female ablation Patients, by AUD statusDemographic/comorbidity/Perioperative complicationAfter matchingnon-AUDAUDp valueTotal (n = count)1796404Age group (%) 18–4441.144.60.001 45–6423.828.2 65–7422.021.3 ≥ 7513.05.9Race (%) White65.568.60.338 Black17.417.8 Hispanic7.35.0 Asian or Pacific Islander1.10.5 Native American0.91.5 Other7.76.7Type of insure (%) Medicare48.847.30.030 Medicaid17.519.8 Private insurance24.721.3 Self-pay6.56.4 No charge1.01.2 Other1.64.0Bed size of hospital (%) Small8.811.10.322 Medium21.621.8 Large69.667.1Region of hospital(%) Northeast20.218.10.350 Midwest or North Central22.020.8 South40.340.1 West17.521.0Elective admission (%)19.423.30.082Type of hospital (teaching %)79.280.40.569Location of hospital (urban, %)97.898.80.204Preoperative comorbidities Acquired immune deficiency syndrome8(0.4%)2 (0.5%)0.893 Deficiency anemia231(12.9%)44(10.9%)0.279 Rheumatoid arthritis/collagen vascular diseases77(4.3%)10(2.5%)0.091 Chronic blood loss anemia18(1.0%)3(0.7%)0.628 Congestive heart failure455(25.3%)92(22.8%)0.282 Chronic pulmonary disease671(37.4%)156(38.6%)0.638 Coagulopathy165(9.2%)41(10.1%)0.549 Depression300(16.7%)70(17.3%)0.762 Diabetes, uncomplicated237(13.2%)57(14.1%)0.626 Diabetes withchronic complications113(6.3%)19(4.7%)0.224 Drug abuse157(8.7%)40(9.9%)0.461 Hypertension1218(67.8%)267(66.1%)0.503 Hypothyroidism274(15.3%)62(15.3%)0.964 Liver disease171(9.5%)45(11.1%)0.324 Fluid and electrolyte disorders533(29.7%)144(35.6%)0.019 Other neurological disorders105(5.8%)28(6.9%)0.409 Obesity427(23.8%)71(17.6%)0.007 Paralysis13(0.7%)3(0.7%)0.968 Peripheral vascular disorders102(5.7%)24(5.9%)0.838 Psychoses121(6.7%)36(8.9%)0.125 Pulmonary circulation disorders114(6.3%)32(7.9%)0.251 Renal failure183(10.2%)43(10.6%)0.786 Peptic ulcer disease excluding bleeding13(0.7%)2(0.5%)0.614 Valvular disease216(12.0%)39(9.7%)0.178 Weight loss63(3.5%)18(4.5%)0.361Number of Comorbidity (%) 08.94.70.044 113.813.9 218.217.8 ≥ 359.263.6Died (%)1.40.00.017Perioperative complicationCardiac complications867(48.3%)189(46.8%)0.588 Myocardial infarction64(3.6%)13(3.2%)0.733 Atrioventricular block355(19.8%)80(19.8%)0.987 Cardiac arrest22(1.2%)7(1.7%)0.419 Heart failure753(41.9%)159(39.4%)0.343 Myocardial ischemia38(2.1%)10(2.5%)0.655 Acute myocardial infarction84(4.7%)17(4.2%)0.684Pericardial complications Acute pericarditis6(0.3%)0(0.0%)0.245 Hemopericardium5(0.3%)2(0.5%)0.485 Cardiac tamponade21(1.2%)3(0.7%)0.456Vascular complications Retroperitoneal injury1(0.1%)0(0.0%)0.635 Vascular complications of surgery0(0.0%)1(0.2%)0.184Pulmonary complications200(11.1%)48(11.9%)0.669 Pneumothorax and hemothorax6(0.3%)1(0.2%)0.780 Postoperative respiratory failure191(10.6%)43(10.6%)0.996 Septal muscle paralysis and Phrenic nerve injury3(0.2%)2(0.5%)0.211 Pulmonary embolism13(0.7%)2(0.5%)0.865 Acute respiratory failure122(6.8%)32(7.9%)0.422 Pneumonia110(6.1%)21(5.2%)0.477Gastrointestinal complications30(1.7%)6(1.5%)0.791 Esophagitis11(0.6%)2(0.5%)0.781 Esophageal ulcers5(0.3%)2(0.5%)0.485 Esophageal strictures6(0.3%)2(0.5%)0.627 Gastroparesis12(0.7%)0(0.0%)0.099 Gastrointestinal bleeding15(0.8%)5(1.2%)0.631Genitourinary disease330(18.4%)79(19.6%)0.582Acute kidney injury239(13.3%)61(15.1%)0.343Inflammatory diseases of the central nervous system1(0.1%)0(0.0%)1.000Convulsion11(0.6%)2(0.5%)1.000Postoperative delirium17(0.9%)9(2.2%)0.041Stroke37(2.1%)10(2.5%)0.602Embolism33(1.8%)4(1.0%)0.231Postoperative shock11(0.6%)1(0.2%)0.368Blood transfusion104(5.8%)21(5.2%)0.642Septicemia52(2.9%)11(2.7%)0.851Chest pain60(3.3%)10(2.5%)0.370Electrolyte imbalance464(25.8%)131(32.4%)0.007Severe malnutrition71(4.0%)21(5.2%)0.259Acute respiratory distress syndrome92(5.1%)27(6.7%)0.210Continuous trauma ventilation61(3.4%)15(3.7%)0.753Thrombocytopenia123(6.8%)29(7.2%)0.813Liver disease3(0.2%)1(0.2%)0.556Hemorrhage/Seroma/Hematoma41(2.3%)7(1.7%)0.494
The peri-procedural period of catheter ablation represents a critical window for therapeutic intervention. Evidence demonstrates that preoperative alcohol cessation programs are both feasible and effective in reducing postoperative complications while also promoting sustained abstinence [27]. This is particularly important given the well-established, dose-dependent relationship between alcohol consumption and AF recurrence, in which even moderate intake markedly increases the risk of post-ablation recurrence [28]. The underlying pathophysiology likely reflects alcohol-induced autonomic imbalance, electrophysiologic instability, and structural myocardial remodeling, which together promote a pro-arrhythmic substrate [1]. Accordingly, clinical studies consistently demonstrate higher procedural success rates among abstainers relative to active drinkers [21]. Although our study assessed in-hospital mortality rather than long-term outcomes, diminished arrhythmia recurrence serves as a key determinant of long-term survival by lowering the risk of subsequent hospitalization for heart failure and thromboembolic events. Thus, a perioperative focus on alcohol cessation in this high-risk AUD cohort may have attenuated their immediate post-procedural arrhythmic risk, potentially contributing to the observed short-term mortality advantage.
Therefore, a key clinical strategy is the implementation of a structured, stepped-care model for alcohol cessation, initiated well before ablation. This approach begins with systematic preoperative screening for AUD, followed by risk-stratified interventions. Patients with hazardous drinking patterns may benefit from Alcohol Brief Interventions (ABIs) delivered by the cardiac team to motivate alcohol reduction. Those with mild to moderate alcohol dependence should be referred for specialized psychological interventions, such as cognitive-behavioral therapy. For patients with established alcohol dependence, a supervised withdrawal protocol, conducted in an outpatient or inpatient setting according to severity, is an essential component of pre-procedural optimization, analogous to standard anticoagulation management [29]. Systematic reviews show that intensive alcohol cessation programs delivered over four to eight weeks preoperatively can significantly reduce both complication rates and postoperative alcohol consumption. The physiological rationale for this approach is especially robust. Notably, abstinence promotes the reversal of alcohol-induced autonomic dysfunction and adverse electrical remodeling, both of which influence arrhythmia recurrence and periprocedural instability [23, 30]. Emerging evidence indicates that alcohol reduction, particularly in heavy drinkers, is associated with a substantially lower rate of arrhythmia recurrence post-ablation, with benefits manifesting shortly after the procedure [31]. Adherence can be objectively monitored through random testing for metabolites such as ethyl glucuronide [29]. In addition, a multidisciplinary model involving electrophysiologists, addiction specialists, and mental health professionals is critical for optimal patient management.
Nevertheless, our findings should be interpreted within the context of several limitations inherent to analyses of administrative databases. First, reliance on ICD codes for identifying AUD and complications introduces potential misclassification bias, as coding practices vary across institutions and may fail to capture subtle clinical details [32, 33]. The documented moderate reliability (kappa of approximately 0.72) and differential performance (sensitivity 95% vs. specificity 77%) of AUD codes suggest our cohort may not fully represent the complete spectrum of alcohol-related disorders in this population [34]. Second, the cross-sectional nature of the NIS database, which captures hospitalization events rather than longitudinal patient trajectories, precludes analysis of critical long-term outcomes. Consequently, we were unable to assess arrhythmia recurrence, long-term mortality, and other endpoints that manifest after discharge, a recognized limitation of NIS-based research [35, 36]. Thirdly, although we used rigorous propensity score matching to balance measured covariates, the absence of detailed clinical data, including exact alcohol consumption levels, medication adherence, and laboratory values, means that residual confounding by unmeasured factors may persist.
Moreover, the exclusive use of inpatient data fundamentally limited the interpretation and generalizability of our findings. Although we documented higher in-hospital complication rates in patients with AUD, the absence of long-term follow-up precludes a comprehensive assessment of the procedure’s therapeutic success in this population. This represents a critical limitation, as established evidence demonstrates that alcohol cessation significantly reduces AF recurrence risk post-ablation, suggesting that the benefits of perioperative management extend far beyond the initial hospitalization [27, 28]. Furthermore, we cannot determine whether the observed increase in gastrointestinal complications leads to long-term sequelae or compromises quality of life. Therefore, future research must employ prospective designs that incorporate standardized AUD assessments, detailed consumption metrics, and systematic longitudinal follow-up. These studies are essential to validate our findings and definitively elucidate the relationship between perioperative alcohol interventions and sustained arrhythmia-free survival.
Conclusion
In our national analysis of 109,226 catheter ablation procedures, patients with AUD, representing 2.85% of the cohort, exhibited distinct clinical profiles and outcomes. This group was characterized by a younger age, male predominance, and carried a higher burden of certain comorbidities, including drug abuse, smoking, and liver disease. Despite adjustment, the AUD cohort experienced longer hospitalizations, higher costs, and a significantly elevated risk of gastrointestinal complications, yet paradoxically showed lower in-hospital mortality. Together, these findings highlight the need for targeted preoperative optimization and tailored perioperative management for patients with AUD undergoing catheter ablation. Therefore, future research should develop and validate interventions to reduce these procedure-specific risks and improve outcomes in this vulnerable population.
Supplementary Information
Supplementary Material 1.