The intergenerational effects of low parental socio‐economic position on cardiometabolic and inflammatory outcomes: A systematic review and meta‐analysis
Juan Carlos Rivillas‐García, Emilie Courtin, Eleanor Winpenny, Olaide Adebayo‐Clement, Raúl Devia‐Rodríguez, Ornella Moreno‐Mattar, Paolo Vineis

TL;DR
Low parental socio-economic status is linked to worse heart and inflammation health in adults, according to a review of many studies.
Contribution
This study systematically reviews and meta-analyzes the long-term health effects of low parental socio-economic position on cardiometabolic and inflammatory outcomes.
Findings
Lower parental socio-economic position is associated with higher blood pressure and C-reactive protein in adults.
Increased adiposity and interleukin-6 levels are observed in individuals with low parental socio-economic status.
Allostatic load is elevated in adults from low socio-economic backgrounds, but no consistent effects on glucose or lipid markers were found.
Abstract
Evidence on the impacts of parental and early life socio‐economic position (SEP) on health outcomes in adulthood remains mixed. This systematic review and meta‐analysis investigated the association between low parental SEP and adult cardiometabolic and inflammatory markers in individuals aged 18 years and older. A systematic search across five databases (EMBASE, Ovid MEDLINE, Cinahl, Global Health and Maternity and Infant Care until January 01, 2022) identified observational studies linking parental SEP with adult cardiometabolic and inflammatory markers. Pooled Standardized Mean Differences (SMD) were estimated using random‐effects models. Risk of bias, heterogeneity and publication bias were assessed using the Cochrane tool, subgroup analysis and Egger's test, respectively. The review included 38 studies (12 in meta‐analysis, n = 388,674). Findings showed that lower parental SEP was…
Genes, proteins, chemicals, diseases, species, mutations and cell lines named across the full text — each resolved to its canonical identifier and authoritative record.
Click any figure to enlarge with its caption.
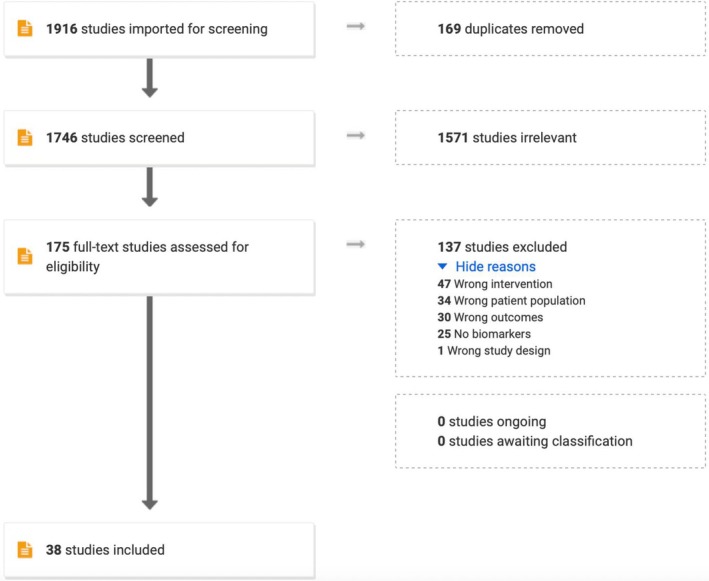 FIGURE 1
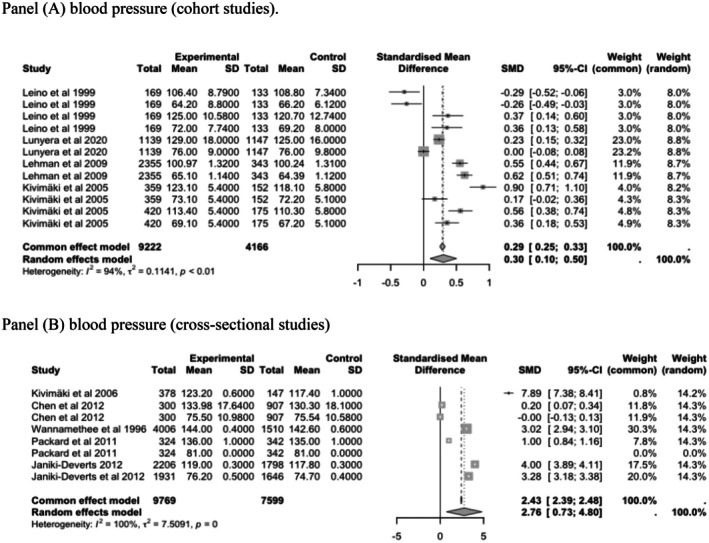 FIGURE 2
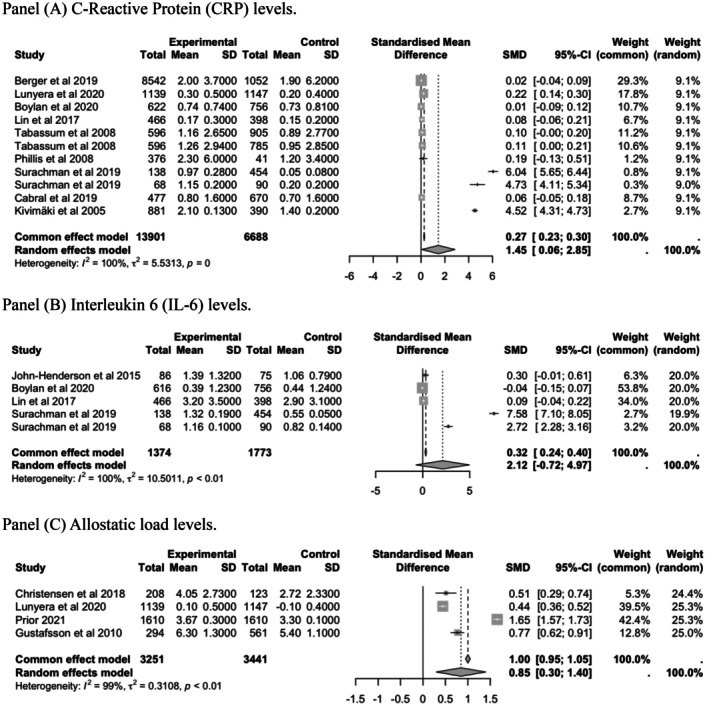 FIGURE 3
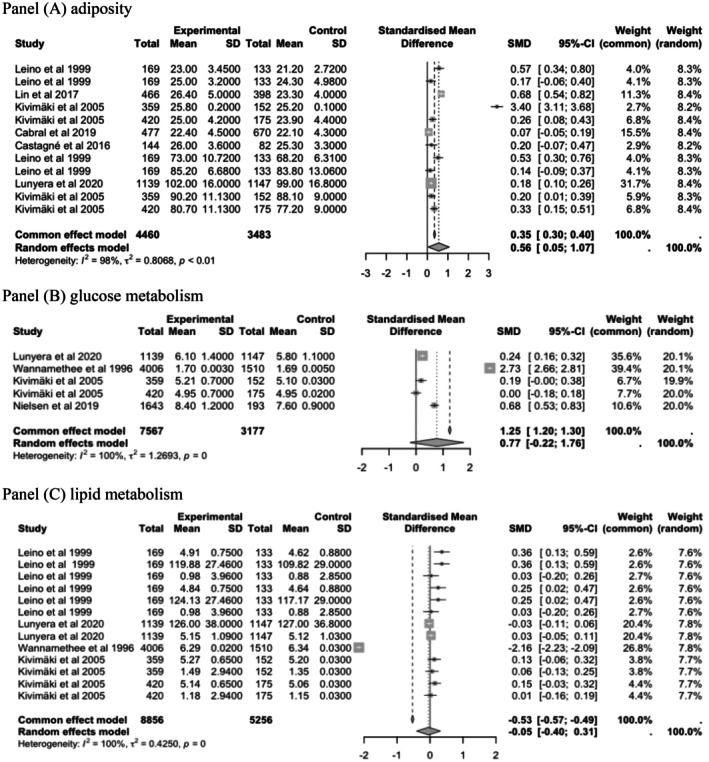 FIGURE 4
| Characteristics | Number of studies ( | Percentage of the studies % |
|---|---|---|
| Study design | ||
| Cohort studies | 28 | 74% |
| Cross‐sectional studies | 10 | 26% |
| Location of the study population | ||
| USA | 13 | 34.2% |
| UK | 7 | 18.4% |
| Finland | 5 | 13.1% |
| Denmark | 4 | 10.5% |
| Taiwan | 2 | 5.3% |
| Multi‐cohort Europe | 2 | 5.3% |
| Jamaica | 1 | 2.6% |
| Sweden | 1 | 2.6% |
| Israel | 1 | 2.6% |
| Portugal | 1 | 2.6% |
| Norway | 1 | 2.6% |
| Sample size of analyses | ||
| 50–200 | 2 | 5.3% |
| 201–500 | 4 | 10.5% |
| 501–1000 | 5 | 13.1% |
| 1001–5000 | 17 | 44.7% |
| 5001–10,000 | 5 | 13.2% |
| Over 10,000 | 5 | 13.2% |
| Outcomes | ||
| Inflammation | 11 | 28.9% |
| Glucose metabolism | 11 | 28.9% |
| Cardiovascular function | 6 | 15.8% |
| Adiposity | 5 | 13.1% |
| Lipid metabolism | 5 | 13.1% |
| Allostatic load | 4 | 10.5% |
| Parental socio‐economic position | ||
| Parental education | 12 | 31.5% |
| Parental occupation (both parents) | 9 | 23.6% |
| Parental SEP (Parental education and occupation) | 7 | 18.4% |
| Father's occupation | 5 | 13.1% |
| Parental SEP | 3 | 7.9% |
| Mother education | 2 | 5.2% |
| Sex | ||
| Men | 3 | 7.9% |
| Women and men | 35 | 92.1% |
| Age | ||
| 18–30 | 9 | 23.7% |
| 31–60 | 16 | 42.1% |
| 60 and above | 9 | 23.7% |
| 18 and older | 4 | 10.5% |
| Ethnicity | ||
| White participants | 20 | 55.9% |
| Black participants | 2 | 2.9% |
| White and nonwhite participants | 16 | 41.2% |
| Single category | Outcomes | SMD | CI |
| CI |
|---|---|---|---|---|---|
| Cardiovascular function | Blood pressure (SBP and DBP) | .30 mmHg | .10 to .50** | 94.5% | 92.0%–96.2% |
| Cardiovascular function | Blood pressure (SBP and DBP) | 2.76 mmHg | .10 to .50** | 99.9% | 99.8%–99.9% |
| Glucose metabolism | HbA1c, fasting glucose, glucose | .77 units | −.22 to 1.76 | 99.8% | 99.8%–99.9% |
| Lipid metabolism | Total cholesterol, triglyceride, LDL | .05 mmol/L | −.40 to .31 | 99.6% | 99.5%–99.6% |
| Adiposity | BMI and waist circumference | .56 units | .05 to 1.07** | 97.9% | 97.2%–98.4% |
| Inflammation | C‐Reactive protein (CRP) | 1.45 mg/dl | .06 to 2.85** | 99.6% | 99.6%–99.7% |
| Inflammation | Interleukin‐6 (IL‐6) | 2.12 pg/mL | .72 to 4.97** | 99.6% | 99.5%–99.7% |
| Inflammation | CRP and IL‐6 | .33 units | .20 to .45*** | 75.2% | 38.9%–89.9% |
| Multisystem dysregulation | Allostatic load | .85 units | .30 to 1.40** | 99.3% | 99.1%–99.5% |
| Subgroup analyses |
| Pooled SMD (95% CI) |
|
|
| |
|---|---|---|---|---|---|---|
| Blood pressure (cohort studies) | <.0001 | |||||
| Age 21–30 years | 4 | .04 [−.25; .34] | 90.0 | – | ||
| Age 24–39 years | 4 | .49 [.20; .78] | 90.2 | – | ||
| Blood pressure (cross‐sectional) | 7 | 2.76 [.73; 4.79] | 99.9 | 0 | <.0001 | |
| Glucose metabolism (cohort studies) | 5 | .76 [−.21; 1.75] | 99.8 | 0 | <.0001 | |
| Lipid metabolism (cohort studies) | 0 | |||||
| Age 21–30 years | 6 | .20 [.11; .30] | 39.5 | <.0001 | ||
| Age 24–39 years | 4 | .08 [−.00; .17] | .0 | 0 | ||
| Adiposity (cohort studies) | 4 | .28 [−.56; 1.13] | 93.9 | <.0001 | .2880 | |
| CRP (cohort studies) | 11 | 1.45 [.06; 2.84] | 99.6 | 0 | <.0001 | |
| IL‐6 (cohort studies) | 5 | 2.12 [−.72; 4.96] | 99.6 | <.0001 | .4602 | |
| Inflammation (cohort studies) | 4 | .84 [.29; 1.39] | 99.3 | <.0001 | <.0001 | |
| Allostatic load (cross sectional) | 5 | .32 [.20; .45] | 75.2 | .0029 | .0193 | |
- —MRC Environment and Health, Imperial College London
- —Ministry of Science, Technology and Innovation of Colombia
Peer Reviews
No public reviews on file for this paper yet. If you reviewed it on a platform where reviews are public (OpenReview, ICLR, NeurIPS, ICML), you can paste yours below so the community can read it here.
Videos
No videos yet. Explain this paper in a talk, walkthrough, or lecture? Add one.
Taxonomy
TopicsBirth, Development, and Health · Health disparities and outcomes · Obesity, Physical Activity, Diet
INTRODUCTION
1
Socio‐economic position (SEP) incorporates multiple aspects such as access to resources, occupation, education and perceived social status.1, 2, 3 Early life adversity and psychosocial stress, including low childhood SEP, can alter biological functioning across the life course, increasing the risk of chronic disease4, 5, 6, 7, 8 and cognitive decline.9, 10, 11 Parental SEP captures various dimensions of early life adversities. Parental education reflects cognitive skills, knowledge and cultural capital, while parental occupation indicates job titles, social status and access to resources and opportunities.7, 12, 13, 14
Intergenerational health inequalities are a fundamental area of research in life course, social and ageing epidemiology. Investigating the impact of low parental SEP on later‐life disease can address unsolved key questions about determinants of health and longevity. While some studies suggest higher parental education and occupation protect against cardiometabolic and inflammatory dysregulation risk in children,15, 16 others have failed to confirm this.17, 18, 19 Associations between parental SEP and adult biological dysregulation also remain unclear in some research.20, 21, 22, 23, 24 Miller et al.23 examined how early‐life stress linked to low SEP may contribute to inflammation and metabolic risk in adulthood but noted variability in findings, while Cohen et al.20 found mixed evidence on parental SEP and adult biological markers, highlighting gaps in understanding mechanisms. Both studies acknowledged the complexity of SEP‐biology links.
We need a better understanding of all the different aspects of SEP and their impacts. A systematic review and meta‐analysis could help clarify these differences. While previous systematic reviews and meta‐analyses have explored the impact of parental SEP on biological dysregulation,5, 6, 25, 26 this review is the first attempt to comprehensively analyse the relationship between parental SEP and both cardiometabolic and inflammatory markers in adulthood, also addressing the limitations of prior research.
MATERIALS AND METHODS
2
Search strategy and selection criteria
2.1
A search of published studies was conducted in the following electronic databases from 1980 until January 2022: EMBASE, Ovid MEDLINE, Cinahl, Global Health and Maternity and Infant Care. The choice of the keywords was based on previously published reports2, 22 and adapted to each database. Table S1 describes the biomarkers used, and Appendix S1 describes keywords and search strategy. Hand‐searched reference lists and citations of included studies were also completed to identify additional relevant studies. Two reviewers (RDR and OMM) independently screened the retrieved reference lists for each database, abstract screening, removed duplicates and assessed the full text for eligibility using Covidence. Both reviewers searched for the results and compared the number of retrieved studies. A third reviewer addressed any disagreements regarding eligibility (JCR).
Inclusion and exclusion criteria
2.2
Criteria for inclusion were defined as below: (1) papers were full peer‐reviewed journal articles, (2) available in English or Spanish, (3) observational studies (longitudinal and cross‐sectional studies) conducted in adult participants (≥18 years), providing data on the association between parental SEP measures and adult cardiometabolic and inflammatory outcomes and (4) reporting effect estimates for the outcomes in the form of Standardised Mean Difference (SMD) and 95% confidence intervals (CIs). Exclusion criteria were described as follows: (1) Studies focusing on specific socio‐economic factors (e.g. employment, health insurance and area of residence); (2) covering other physiological systems or markers; and (3) studies undertaken in children and adolescents (<18 years).
Data extraction
2.3
Two researchers independently extracted information from 38 selected studies and coded individual studies using a customised extraction form (JCR and OAC). The form was piloted on five studies before reviewers proceeded to the complete data extraction. Data extracted from each article included: (1) study design (longitudinal or cross‐sectional, period of data collection, follow‐up and year of publication); (2) sample characteristics (country, number of men and women, age, ethnicity, sample size and number of individuals); (3) the used parental SEP measure (the means and standard deviation of the parental SEP groups); (4) the method of assessing parental SEP exposures (self‐reported questionnaire, clinical interview and record review); and (5) whether there were associations between exposures and cardiometabolic or inflammatory outcomes (e.g. odds ratios, mean differences between groups).
The effect size extracted from the articles and the test used to compute it were recorded by two reviewers. For studies that examined multiple exposures and health outcomes, data for each exposure and outcome within each group were extracted. Discrepancies between reviewers were discussed until a consensus was reached. Missing data were requested from the principal study's author by e‐mail. If we had yet to receive a positive response from the study's author, follow‐up emails were sent after 2 weeks. Inclusion of multiple estimates per study followed a priori criteria: (a) distinct outcomes (for instance, SBP and DBP if analysing blood pressure broadly or CRP and IL‐6 is studying inflammation); (b) independent subgroups (for instance, estimates for men vs. women if gender differences are a focus, or age‐stratified estimates); and (c) adjusted models prioritised to minimise confounding. This approach aligns with meta‐analytic guidelines while mitigating nonindependency bias.27, 28
Quality assessment
2.4
To assess the risk of bias in each study, the Cochrane Collaboration's Risk of Bias tool29 was used in the following domains: (1) eligibility criteria, (2) collection of exposures, (3) adjustments for potential confounders, (4) missing outcome data, (5) measurement of the outcome data and (6) selection of reported results. Studies with a high risk of bias in one domain were classified as having an increased risk of bias overall. Two reviewers independently assessed the risk of bias (JCR and OAC).
Statistical power
2.5
This review ended up by including a small number of studies for some specific markers, ranging from as little as two to a maximum of four studies, mainly cross‐sectional. To increase statistical power, we used two approaches, collapsing the main SEP measures and markers categories:
(1) Combining five parental SEP measures into a single parental SEP measure (low and high parental SEP). We decided on this approach as the mother's education, father's occupation, parental education, parental occupation and family SEP measures are similar operationalisations of the same construct (Table S1 describes the operationalisation of five parental SEP measures).
(2) Collapsing markers supported by clinical relevance and handling multiple outcomes from the same study27: (a) blood pressure included systolic blood pressure (SBP) and diastolic blood pressure (DBP) stratifying by study design (cohort vs. cross‐sectional). SBP and DBP can be analysed as related outcomes in the meta‐analysis27, 28; (b) metabolic markers: HbA1c, fasting glucose and blood glucose are biomarkers clinically interchangeable and were included in a single glucose metabolism group; (c) lipid metabolism outcomes included total cholesterol, triglyceride and low‐density lipoprotein (LDL). (d) Adiposity in cohort studies: body‐mass index and waist circumference were pooled to align with WHO metabolic syndrome criteria.30 Although BMI and WC capture different aspects of the body fat distribution (general vs. abdominal), both are established predictors of cardiometabolic risk.31 (e) inflammation outcomes included C‐reactive protein (CRP) and interleukin 6 (IL‐6). (f) Allostatic load was analysed separately only for the cross‐sectional studies. After collapsing into main groups of outcomes, only glucose metabolic and lipid metabolic markers still showed a small number of studies in the meta‐analysis (n = 4 studies).
Meta‐analysis
2.6
Results from selected studies were summarised based on exposures, outcomes and research designs, with characteristics detailed in Table S2. A random‐effects meta‐analysis was performed to calculate the standardized mean difference (SMD) and associated 95% confidence intervals (CIs), with pooled estimates reported using the metapackage in R.27, 32 Heterogeneity was assessed using Q and I ^2^ statistics with values of <25%, 25%–50%, 50%–75% and >75% interpreted as low, moderate, high and extreme heterogeneity, respectively.33 Meta‐analyses were conducted separately for cardiovascular, metabolic and inflammatory outcomes and for each study design. Forest plots illustrated effect sizes with 95% CIs for individual studies. Funnel plots were generated to visually assess publication bias.33, 34, 35 The meta package in R Studio32, 36 was used to assess statistical power by estimating the range of reliably detectable effect sizes at the individual study level.37 Codes and detailed tables with the number of observations, means and standard deviations are available in the Appendix S1 and on GitHub.
Synthesis of findings
2.7
Statistical analyses were performed by using R Studio version 4.1.2 (The R Foundation for Statistical Computing, Vienna, Austria). The standardised mean differences were estimated as overall effect sizes and reported as pooled SMD with 95% CI in random effects meta‐analyses.
Furthermore, statistical power was also assessed to determine the range of reliably detectable effect sizes and employing the ‘metameta’ R package. Detailed procedures, including codes and tables with the number of observations, means and standard deviations among exposed and nonexposed groups, are available in Appendix S1. Findings from studies not eligible for meta‐analysis, for instance due to incompatible effect sizes reporting or heterogeneous outcomes were synthesised narratively.
RESULTS
3
Study characteristics
3.1
Our systematic search identified 1916 studies, with 38 studies meeting inclusion criteria after screening (Figure 1). The excluded studies (n = 1878) primarily lacked relevant exposures, focused on paediatric populations or reported incompatible outcomes.
PRISMA flow diagram of study population selection process and profile.
The analytical sample comprised 28 cohort studies (follow‐up range 1–60 years) and 10 cross‐sectional studies published between 1982 and 2022. Geographically, studies originated from Europe (n = 19), the Americas (n = 14), Asia (n = 2 studies) and one multinational cohort (Table 1). While 20 studies examined exclusively White populations, 16 reported stratified data by race/ethnicity, including six with specific ethnic groups' analysis.
Parental SEP was operationalised through education (n = 19 studies, predominantly mother's education) and occupation (n = 21 studies). Outcome reporting emphasised inflammatory and glucose markers (n = 11), cardiovascular measures (n = 6), and lipid markers (n = 5), with the strongest evidence for blood pressure, adiposity and CRP outcomes. Most (81%) parental SEP data derived from survey instruments rather than registers.
Of the 38 studies assessed, 21 covering 69,774 participants had 60 estimates useful for meta‐analyses.13, 14, 16, 19, 22, 38, 39, 40, 41, 42, 43, 44, 45, 46, 47, 48, 49, 50, 51, 52, 53, 54
In nonpooled studies,55, 56, 57, 58, 59 lower SEP was consistently associated with adverse adult cardiometabolic outcomes, including elevated inflammatory outcomes, blood pressure, waist circumference, triglycerides, BMI and higher cholesterol risk. The reviewed studies comprised cohorts and cross‐sectional studies focusing on paediatric and adolescent populations (<18 years) and younger adults. Key limitations included inconsistent biomarker reporting and heterogeneous measurements of SEP and cardiometabolic outcomes.
Parental SEP and adult cardiometabolic and inflammatory outcomes
3.2
We found significant associations between lower parental SEP and offspring's cardiovascular function, adiposity, IL‐6, CRP and allostatic load levels in adulthood (Table 2).
Blood pressure
3.3
The analysis indicated a significant association between lower parental socio‐economic position and higher blood pressure in later life in both cohort studies (Panel A, SMD = .30 mmHg; 95% CI, .10–.50, I ^2^=94%) and in cross‐sectional studies (Panel B, SMD = 2.76 mmHg; 95% CI, .10–.50, I ^2^=86%) (Figure 2).
Random effects of the associations between low parental socio‐economic position and offspring's blood pressure in adulthood (cohort and cross‐sectional studies). (A) Blood pressure (cohort studies) and (B) blood pressure (cross‐sectional studies). Blood pressure: Estimates from Leino et al. 47 and Kivimaki were reported separately for females and males for both SBP and DBP. Estimates from Lunyera et al., 48 Lehman et al., 46 Chen et al., 60 Packard et al. 16 and Janicki‐Deverts et al. 43 included combined data for both sexes for SBP and DBP.
Inflammatory outcomes and allostatic load
3.4
Results from longitudinal data are presented in Figure 3. There was a consistent association between lower parental SEP and an increased risk of having higher levels of CRP (Panel A, SMD = 1.45 mg/dL; 95% CI, .06–2.85, I2=80%), IL‐6 (Panel B, SMD = 2.12 pg/mL; 95% CI, −.72 to 4.97, I ^2^=100%) and Allostatic load (Panel C, SMD = .85; 95% CI, .30–1.40, I ^2^=99%). In most of the studies, the AL score was computed using the traditional count‐based method of summing the number of allostatic load markers falling in the high‐risk quartile.61 Christensen et al.13, 14 used 14 markers representing the inflammatory, metabolic and cardiovascular systems measured at midlife. Lunyera et al.48 used 11 markers representing neuroendocrine, inflammatory, metabolic and cardiovascular systems. In the cross‐sectional studies, low parental SEP showed a significant association with inflammatory outcomes (SMD = .33; 95% CI, .20–.45, I ^2^=75%).
Random effects of the associations between low parental socio‐economic position (SEP) and offspring's C‐Reactive Protein (CRP), interleukin‐6 (IL‐6) and allostatic load levels in adulthood (cohort studies). (A) C‐reactive protein (CRP) levels, (B) interleukin 6 (IL‐6) levels and (C) allostatic load levels. C‐reactive protein and interleukin 6. Estimates from Tabassum et al. 53 were reported separately for females and males for CRP. Estimates from Surachman et al. 73 included combined data for both sexes for CRP and IL‐6.
Metabolic outcomes
3.5
The analysis also indicated a significant association between lower parental SEP and adiposity (Figure 4 Panel A, SMD = .56; 95% CI, .05–1.07, I ^2^=98%), but not with glucose and lipid metabolism outcomes in cohort studies. Pooled estimates in panel A indicate that exposures to low parental SEP are associated with higher glucose metabolism (Panel A, SMD = .77 I ^2^=98%; 95% CI, −.22 to 1.76, I ^2^=100%) and higher adiposity levels (Panel B, SMD = .56; 95% CI, .05–1.07, I ^2^=98%). Parental SEP had a negligible effect on lipid metabolic biomarkers (Panel C, SMD = −.05 mmol/L; 95% CI, −.40 to .31, I ^2^=0%).
Random effects of the association between low parental socio‐economic position (SEP) and offspring's glucose metabolism in adulthood (cohort studies). (A) Adiposity: Estimates from Leino et al. 47 and Kivimäki et al. 45 were reported separately for females and males for both BMI and WC. (B) Glucose metabolism: Estimates from Kivimäki et al. 45 were reported separately for males and females for fasting glucose for females and males. (C) Lipid metabolism: Estimates from Leino et al. 47 were reported separately for females and males for total cholesterol, LDL cholesterol and triglycerides; Kivimäki et al. 45 were reported separately for females and males for total cholesterol and triglycerides; estimates from Lunyera et al. 48 included combined data for both sexes for SBP and DBP.
Subgroup analysis revealed substantial heterogeneity (I ^2^ > 79%) in associations between low parental SEP and elevated blood pressure, adiposity and C‐reactive protein (Table 3). Higher parental SEP was linked to better lipid metabolism in young adults (ages 21–30: SMD = .21, 95% CI .12–.30, I ^2^ = 39.5%); there was a marked CRP‐parental SEP association (SMD = 1.45, 95% CI .06–2.8, I ^2^ = 99.6%); and age‐stratified analysis showed significant blood pressure differences in the 24–39 years group (SMD = .50, 95% CI .21–.79). Meta‐regression confirmed subgroup variations (p < .0001). Lunyera48 disproportionately influenced pooled estimates. Funnel plot asymmetry suggested publication bias, although this should be interpreted with caution due to the limited number of studies and heterogeneity sources (age and gender differences). (Figure S1 funnel plots asymmetry).
DISCUSSION
4
Our results suggest that children exposed to lower parental socio‐economic position have a higher risk of elevated levels of CRP, IL‐6, allostatic load and an increased risk of adiposity in later adulthood compared to children with higher parental socio‐economic position. This aligns with findings from Slopen et al.,6 Liu et al.5 and Milaniak and Jaffee,62 which linked exposure to lower parental socio‐economic position to higher levels of C‐reactive protein and interleukin‐6. Liu et al.'s5 meta‐analysis using 15 observational studies found that, compared with those from the most advantaged families, individuals from the least advantaged families had 25% higher odds of elevated CRP in later life (OR = 1.25; 95% CI 1.19, 1.32). Inflammatory findings seem to be strongly driven by a single study.48 This study was different from the others in the exposure variable used, cumulative life‐course socio‐economic position. In this study, participants' self‐reported childhood socio‐economic status, educational attainment and annual household income. This methodological distinction suggests that cumulative SEP may better capture biological embedding than single‐point assessments or that self‐reported childhood SEP could inflate effect sizes.
The finding of a significant association between lower parental socio‐economic position and risk of adiposity in later adulthood is inconsistent with the Senese et al.63 systematic review, while Newton et al.64 found a link between lower SEP and higher obesity in females, based mostly on studies in developed countries. Tamayo et al.,7 Parsons et al.65 and Gonzalez et al.66 systematic reviews, and Slopen et al.6 meta‐analysis also reported an association between low SEP in early life and greater central adiposity in adulthood.
Mechanisms of association between parental SEP and adult adiposity may be through the development of adiposity in childhood/adolescence, which then persists through adult life. Or it may be through the mediating role of adult SEP, influenced by parental and childhood SEP. The observed inverse relationship between parental SEP and adiposity, mainly among women, was based primarily on studies in high‐income countries.64, 66, 67
In our study, parental SEP was associated with higher allostatic load in adulthood, ranging from 10% to 14%. This result aligns with findings from Finlay et al.68 and Misiak et al.,69 which systematically reviewed 18 studies mainly focused on the US and European samples. They found evidence of an association with elevated allostatic load indices in adulthood. However, markers and biological systems included in the AL index differed widely across studies. Despite these differences, pooled studies showed significant associations between lower parental socio‐economic position and elevated allostatic load.
Lower parental socio‐economic position was linked to a modest risk of elevated blood pressure. Cross‐sectional studies indicated larger effects of parental SEP on adult blood pressure compared to cohort studies. A potential reason for the difference in the magnitude of the effects between the two study designs may be related to confounding variables, selection bias and methodological differences (assessment of SEP measures or assessment of blood pressure) that could be influencing this difference.
Our findings are consistent with McHutchison et al.70 meta‐analysis using 10 cohort studies from the US, Denmark, UK, Sweden and Scotland, which found modest associations between parental SEP and lifetime cardiovascular risks. In the Mallinson et al.71 meta‐analysis, 38 out of the 46 studies showed no clear evidence of association with the risk of elevated blood pressure. This meta‐analysis found more studies than ours as it was mainly based on investigations from middle‐income countries with differences in methodology, scope and search strategy, which significantly influenced the number of the studies included. In addition, inconsistencies in the findings may be related to the differences in blood pressure measurements, parental SEP measures and study populations.
More imprecise estimates and mostly null effects were found for glucose metabolism (HbA1c, fasting glucose and glucose) and lipid metabolism markers (total cholesterol, triglyceride and LDL), suggesting no association with parental SEP. One primary explanation is due to the lack of statistical power in our meta‐analysis. These weaker associations have been previously documented by others6, 72: both systematic reviews were inconclusive on the association between childhood stressors and lipids or carbohydrate metabolism‐related factors.
In summary, several factors can explain the variation in effect sizes for markers, including differences in the study design, sample sizes, methods, markers and exposure collection procedures, and reported metrics (unadjusted and adjusted odds ratios, regression coefficients, relative risk ratios, path coefficients from structural equation models, mean differences).
The strongest association in the subgroup analysis highlights that parental SEP and lipid metabolism and parental SEP and CRP might show stronger associations in young adults. Moreover, age matters in these associations as effects vary by life stage. Most outcomes show high between‐study variability (I ^2^ > 90%). This high heterogeneity indicates substantial variability in the effect sizes across included studies. This considerable heterogeneity has significant implications for interpreting the results. It suggests that the generalisability of these findings is limited as the observed intergenerational associations may vary considerably depending on specific study populations, methodologies and contexts. Therefore, caution is warranted when applying these aggregated results to different populations, and further research is needed to understand the sources of this heterogeneity and to identify subgroups where these intergenerational associations are more consistent.
Possible sources of asymmetry in funnel plots may include reporting biases and publication bias, poor methodological elements leading to spuriously inflated effects in smaller studies, true heterogeneity (effect sizes differ according to study size) or changes in reported outcomes.35 Therefore, the limited number of studies in this meta‐analysis impedes a conclusive assessment.
This study was subject to several limitations. Most included studies did not provide disaggregated data by characteristics such as age, gender, race and ethnic groups. Therefore, our systematic review did not investigate the extent to which the associations differed for men versus women, for white versus black populations, for Latino versus European populations, etc. Secondly, collapsing parental SEP into a single measure did not allow the investigation of how different parental SEP measures such as mother's education or father's occupation differed across markers.
Thirdly, our meta‐analysis was not large enough to make a definitive claim about the associations investigated. In addition, the evidence mainly comes from HIC and the findings are not generalisable to low‐ and middle‐income populations.
Fourth, the study of associations between parental SEP and glucose and lipid metabolic markers needs more statistical power. Although collapsing physiological related outcomes improved power, sometimes grouping some outcomes could obscure effects. Despite our search was extensive through different search engines and carried out by three trained independent reviewers, we might have missed relevant studies addressing our research question. Finally, it is possible that there are further confounders and mediators behind the observed relationships. The biological pathways are not well established yet in the literature, and this can influence future research directions.
CONCLUSIONS
5
Our meta‐analysis suggests that low parental socio‐economic position negatively impacts adult offspring health, manifesting as higher blood pressure, elevated C‐reactive protein, increased interleukin‐6, greater adiposity and higher allostatic load. These findings align with evidence on the long‐term effects of early life circumstances on health outcomes. Future research should prioritise three critical areas: (1) Mechanistic specificity (deconstructing SEP measures to understand how parental education and occupation affect biological mechanisms); (2) Intersectional pathways (investigating pathways and differences across gender, race and region); and (3) life‐course timing and critical period detection. Researchers could aim to determine whether adolescence is a sensitive period for metabolic dysregulation and to assess how lower parental SEP also tends to lead to higher exposure to adverse childhood experiences (ACEs). The timing of health outcome development, differentiating direct from indirect effects mediated by adult individual SEP, is also a goal for future research. Identifying these causal pathways should be at the basis of the next generation research.
AUTHOR CONTRIBUTIONS
JCR, EC, and PV were involved in conceptualization. JCR, OAC, RD, and OMM were involved in data curation. JCR was involved in formal analysis, project administration, visualization, and writing—original draft. JCR and PV were involved in funding acquisition. JCR, EC, PV, and EW were involved in investigation. JCR, EC, EW, and PV were involved in methodology and Writing—review and editing. EC, EW, and PV were involved in supervision. JCR, OAC, EC, and EW were involved in validation.
CONFLICT OF INTEREST STATEMENT
All authors declare that they have no conflicts of interest.
Supporting information
Data S1.
The reference list from the paper itself. Each links out to its DOI / PubMed record.
- 1Turner RJ , Thomas CS , Brown TH . Childhood adversity and adult health: evaluating intervening mechanisms. Soc Sci Med. 2016;156:114‐124. doi:10.1016/j.socscimed.2016.02.026 27030896 · doi ↗ · pubmed ↗
- 2Vineis P , Avendano‐Pabon M , Barros H , et al. Special report: The biology of inequalities in health: The lifepath consortium. Front Public Health. 2020;8:1‐37. doi:10.3389/fpubh.2020.00118 32478023 PMC 7235337 · doi ↗ · pubmed ↗
- 3Walsh D , Mc Cartney G , Smith M , Armour G . Relationship between childhood socioeconomic position and adverse childhood experiences (AC Es): a systematic review. J Epidemiol Community Health. 2019;73(12):1087‐1093. doi:10.1136/jech-2019-212738 31563897 PMC 6872440 · doi ↗ · pubmed ↗
- 4King AL . Understanding Relationships between Early Life Toxic Stress, Childhood Socioeconomic Disadvantage, and Allostatic Load in Adolescence. In Pro Quest Dissertations and Theses (Issue August). 2018. https://search.proquest.com/dissertations‐theses/understanding‐relationships‐between‐early‐life/docview/2094606775/se‐2?accountid=41304
- 5Liu RS , Aiello AE , Mensah FK , et al. Socioeconomic status in childhood and C reactive protein in adulthood: a systematic review and meta‐analysis. J Epidemiol Community Health. 2017;71(8):817‐826. doi:10.1136/jech-2016-208646 28490476 PMC 5843476 · doi ↗ · pubmed ↗
- 6Slopen N , Goodman E , Koenen KC , Kubzansky LD . Socioeconomic and other social stressors and biomarkers of cardiometabolic risk in youth: a systematic review of less studied risk factors. P Lo S One. 2013;8:e 64418. doi:10.1371/journal.pone.0064418 23691213 PMC 3656855 · doi ↗ · pubmed ↗
- 7Tamayo T , Herder C , Rathmann W . Impact of early psychosocial factors (childhood socioeconomic factors and adversities) on future risk of type 2 diabetes, metabolic disturbances and obesity: a systematic review. Holistic Perspectives on Trauma. Apple Academic Press; 2015:315‐340. doi:10.1201/b 18313-20 PMC 294091720809937 · doi ↗ · pubmed ↗
- 8Von Kobyletzki LB , Beckman L , Smeeth L , et al. Association between childhood allergic diseases, educational attainment and occupational status in later life: systematic review protocol. BMJ Open. 2017;7(10):1‐4. doi:10.1136/bmjopen-2017-017245 PMC 565258129025838 · doi ↗ · pubmed ↗