Safety and Efficacy of Vadadustat Versus Darbepoetin Alfa for Chronic Kidney Disease–Related Anemia in Patients Receiving Dialysis by Baseline Erythropoiesis‐Stimulating Agent Dose
Alan Jardine, Steven K. Burke, Wenli Luo, Todd Minga, Mark J. Sarnak, Wolfgang C. Winkelmayer, Rajiv Agarwal, Glenn M. Chertow, Kai‐Uwe Eckardt, Mark J. Koury

TL;DR
The study compares the safety and effectiveness of vadadustat and darbepoetin alfa for treating anemia in dialysis patients with chronic kidney disease.
Contribution
The study evaluates vadadustat's performance in patients requiring high doses of erythropoiesis-stimulating agents.
Findings
Vadadustat was noninferior to darbepoetin alfa in hemoglobin change across all ESA dose subgroups.
No significant increase in cardiovascular risk was observed with vadadustat compared to darbepoetin alfa.
Abstract
Erythropoiesis‐stimulating agents (ESAs) and iron supplementation are standard treatments for chronic kidney disease (CKD)–related anemia. Targeting higher hemoglobin values in CKD increases cardiovascular risk. Whether the increased risk is from higher ESA doses or higher hemoglobin levels is uncertain, but alternative therapies are sought for patients requiring high ESA doses. Phase 3 INNO2VATE trials in patients with dialysis‐dependent CKD (DD‐CKD) demonstrated vadadustat's noninferiority compared with darbepoetin alfa. To determine vadadustat's potential to treat anemia, including in patients requiring high ESA doses, its safety and efficacy were compared with those of darbepoetin alfa across prespecified baseline ESA dose subgroups in the prevalent DD‐CKD INNO2VATE trial. We compared the safety and efficacy of vadadustat versus darbepoetin alfa across prespecified baseline ESA…
Genes, proteins, chemicals, diseases, species, mutations and cell lines named across the full text — each resolved to its canonical identifier and authoritative record.
Click any figure to enlarge with its caption.
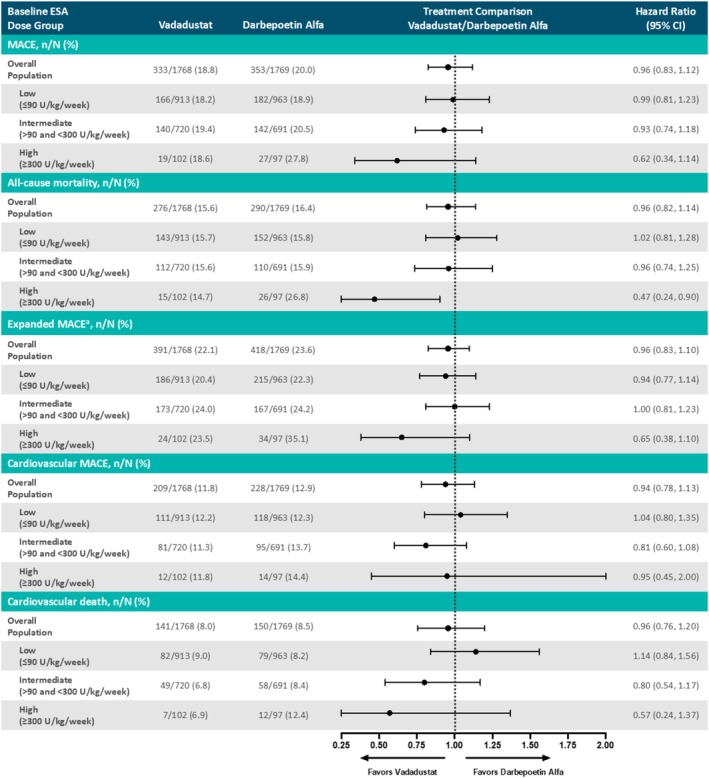 FIGURE 1
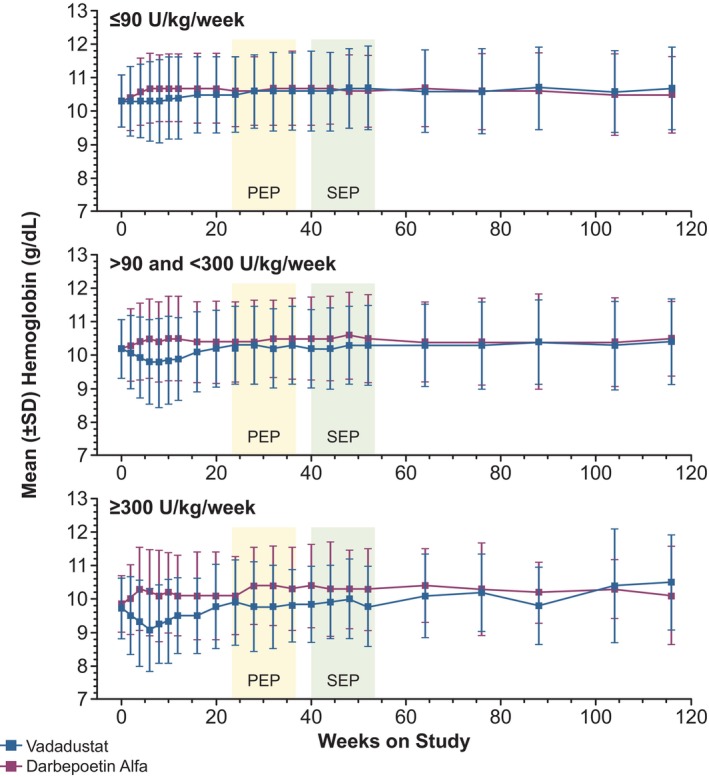 FIGURE 2
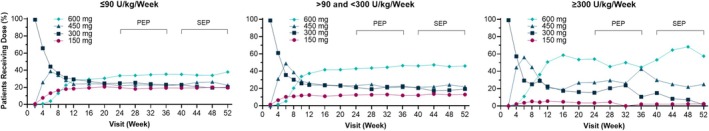 FIGURE 3
| Characteristic | ≤ 90 U/kg/week | > 90 and < 300 U/kg/week | ≥ 300 U/kg/week | |||
|---|---|---|---|---|---|---|
| Vadadustat ( | Darbepoetin alfa ( | Vadadustat ( | Darbepoetin alfa ( | Vadadustat ( | Darbepoetin alfa ( | |
| Mean age, years (SD) | 58.5 (13.6) | 59.7 (13.2) | 57.5 (14.3) | 56.7 (14.8) | 57.1 (13.4) | 57.1 (12.6) |
| Sex, male, | 517 (56.4) | 569 (58.8) | 396 (54.7) | 383 (55.3) | 56 (54.9) | 46 (46.9) |
| Racial or ethnic group, | ||||||
| White | 626 (68.3) | 635 (65.6) | 429 (59.3) | 398 (57.4) | 58 (56.9) | 48 (49.0) |
| Asian | 26 (2.8) | 41 (4.2) | 42 (5.8) | 43 (6.2) | 7 (6.9) | 14 (14.3) |
| Black or African American | 203 (22.2) | 217 (22.4) | 189 (26.1) | 194 (28.0) | 33 (32.4) | 31 (31.6) |
| Other | 61 (6.7) | 75 (7.7) | 64 (8.8) | 58 (8.4) | 4 (3.9) | 5 (5.1) |
| Hispanic ethnic group, | ||||||
| Hispanic/Latino | 329 (35.9) | 337 (34.8) | 289 (39.9) | 287 (41.4) | 42 (41.2) | 38 (38.8) |
| Not Hispanic/Latino | 561 (61.2) | 593 (61.3) | 411 (56.8) | 383 (55.3) | 58 (56.9) | 59 (60.2) |
| Not reported/unknown | 26 (2.8) | 38 (3.9) | 24 (3.3) | 23 (3.3) | 2 (2.0) | 1 (1.0) |
| Region of enrollment, | ||||||
| USA | 564 (61.6) | 590 (61.0) | 424 (58.6) | 406 (58.6) | 85 (83.3) | 81 (82.7) |
| Europe | 152 (16.6) | 186 (19.2) | 95 (13.1) | 91 (13.1) | 2 (2.0) | 2 (2.0) |
| Non‐US/Europe | 200 (21.8) | 192 (19.8) | 205 (28.3) | 196 (28.3) | 15 (14.7) | 15 (15.3) |
| Mean time since dialysis started, years (SD) | 4.0 (3.9) | 3.9 (4.0) | 4.1 (4.2) | 4.0 (4.1) | 4.0 (4.2) | 4.5 (4.0) |
| Type of dialysis, | ||||||
| Hemodialysis | 859 (93.8) | 903 (93.3) | 676 (93.4) | 638 (92.1) | 88 (86.3) | 86 (87.8) |
| Peritoneal dialysis | 57 (6.2) | 65 (6.7) | 47 (6.5) | 55 (7.9) | 14 (13.7) | 12 (12.2) |
| Disease history, | ||||||
| Diabetes mellitus | 514 (56.1) | 569 (58.8) | 389 (53.7) | 361 (52.1) | 52 (51.0) | 58 (59.2) |
| Cardiovascular disease | 454 (49.6) | 531 (54.9) | 351 (48.5) | 344 (49.6) | 48 (47.1) | 54 (55.1) |
| New York Heart Association Functional Classification, | ||||||
| 0 (no CHF) or I | 782 (85.4) | 832 (86.0) | 643 (88.8) | 612 (88.3) | 92 (90.2) | 87 (88.8) |
| II or III | 134 (14.6) | 136 (14.0) | 81 (11.2) | 81 (11.7) | 10 (9.8) | 11 (11.2) |
| Mean body mass index, kg/m2 (SD) | 29.8 (7.8) | 29.8 (7.3) | 27.4 (6.4) | 27.3 (6.7) | 25.9 (5.8) | 25.4 (7.0) |
| Baseline weight | ||||||
| Mean (SD) | 84.3 (22.8) | 83.9 (22.1) | 76.5 (19.8) | 76.2 (21.2) | 72.5 (19.7) | 69.4 (19.8) |
| Median (Q1, Q3) | 80.9 (69.0, 96.0) | 81.0 (68.5, 96.6) | 74.5 (62.5, 86.8) | 73.0 (61.0, 85.0) | 71.0 (59.0, 84.2) | 66.3 (57.0, 77.4) |
| ≤ 60 kg, | 101 (11.0) | 119 (12.3) | 149 (20.6) | 146 (21.1) | 28 (27.5) | 30 (30.6) |
| > 60 and ≤ 90 kg, | 504 (55.0) | 516 (53.3) | 426 (58.8) | 430 (62.0) | 54 (52.9) | 58 (59.2) |
| > 90 kg, | 311 (34.0) | 333 (34.4) | 149 (20.6) | 117 (16.9) | 20 (19.6) | 10 (10.2) |
| Mean hemoglobin concentration, g/dL (SD) | 10.3 (0.81) | 10.3 (0.77) | 10.2 (0.87) | 10.2 (0.88) | 9.72 (0.91) | 9.85 (0.85) |
| Baseline hemoglobin category, | ||||||
| < 10.0 g/dL | 282 (30.8) | 302 (31.2) | 262 (36.2) | 262 (37.8) | 62 (60.8) | 49 (50.0) |
| ≥ 10.0 g/dL | 634 (69.2) | 666 (68.8) | 462 (63.8) | 431 (62.2) | 40 (39.2) | 49 (50.0) |
| Baseline ESA use, | ||||||
| Epoetin | 429 (46.8) | 470 (48.6) | 445 (61.5) | 413 (59.6) | 77 (75.5) | 70 (71.4) |
| Darbepoetin alfa | 318 (34.7) | 346 (35.7) | 156 (21.5) | 163 (23.5) | 8 (7.8) | 11 (11.2) |
| Methoxy polyethylene glycol–epoetin beta | 169 (18.4) | 152 (15.7) | 123 (17.0) | 117 (16.9) | 17 (16.7) | 17 (17.3) |
| Baseline ESA dose (U/kg/week) | ||||||
| Mean (SD) | 48.4 (22.0) | 49.2 (22.5) | 156.3 (51.4) | 152.6 (50.6) | 447.0 (138.2) | 443.4 (180.4) |
| Median (Q1, Q3) | 46.5 (30.4, 66.6) | 49.4 (31.0, 67.4) | 145.1 (114.3, 187.5) | 140.4 (111.7, 181.8) | 404.0 (337.8, 492.7) | 388.5 (337.1, 472.4) |
| Iron parameters and C‐reactive protein | ||||||
| Baseline iron use, | ||||||
| Oral iron only | 64 (7.0) | 62 (6.4) | 46 (6.4) | 42 (6.1) | 7 (6.9) | 8 (8.2) |
| Intravenous iron only | 471 (51.4) | 469 (48.5) | 381 (52.6) | 335 (48.3) | 42 (41.2) | 42 (42.9) |
| Oral and intravenous iron | 37 (4.0) | 49 (5.1) | 33 (4.6) | 30 (4.3) | 12 (11.8) | 6 (6.1) |
| Did not receive iron | 344 (37.6) | 388 (40.1) | 264 (36.5) | 286 (41.3) | 41 (40.2) | 42 (42.9) |
| TIBC (mean [SD]), μg/dL (250–425 μg/dL |
211.9 (34.9) |
213.3 (35.4) |
207.3 (36.4) |
210.1 (36.5) |
209.1 (42.5) |
202.7 (41.4) |
| Hepcidin (mean [SD]), ng/mL (male: 8.6–82.6 ng/mL; female: 6.2–51.5 ng/mL |
198.8 (138.9) |
194.1 (132.3) |
191.9 (140.9) |
187.5 (139.6) |
173.8 (144.0) |
178.9 (146.1) |
| Ferritin (mean [SD]), ng/mL (10–380 ng/mL |
876 (569) |
855 (527) |
824 (563) |
829 (560) |
798 (520) |
832 (496) |
| Serum iron (mean [SD]), μg/dL (male: 65–175 μg/dL; female: 50–170 μg/dL |
82.1 (28.3) |
80.6 (27.4) |
77.3 (30.0) |
77.3 (28.0) |
75.9 (33.3) |
75.0 (33.7) |
| Transferrin saturation (mean [SD]), % (male: 20%–50%; female: 15%–50% |
39.2 (13.5) |
38.1 (13.1) |
37.2 (13.3) |
37.0 (12.9) |
35.9 (13.7) |
37.5 (15.4) |
| C‐reactive protein (mean [SD]), mg/L (0.0–4.9 mg/L |
9.2 (17.9) |
9.4 (17.6) |
11.3 (22.9) |
9.5 (16.3) |
11.6 (16.8) |
13.4 (21.5) |
| Event, | ≤ 90 U/kg/week | > 90 and < 300 U/kg/week | ≥ 300 U/kg/week | ||||||
|---|---|---|---|---|---|---|---|---|---|
| Vadadustat ( | Darbepoetin alfa ( | RR (95% CI) | Vadadustat ( | Darbepoetin alfa ( | RR (95% CI) | Vadadustat ( | Darbepoetin alfa ( | RR (95% CI) | |
| Any treatment‐emergent serious adverse events of special interest | 337 (35.5) | 396 (39.9) | 0.89 (0.79, 1.00) | 312 (40.8) | 338 (45.8) | 0.89 (0.79, 1.00) | 48 (43.2) | 57 (55.3) | 0.78 (0.59, 1.03) |
| Hypertension | 122 (12.9) | 165 (16.6) | 0.77 (0.62, 0.96) | 144 (18.8) | 159 (21.5) | 0.88 (0.72, 1.07) | 25 (22.5) | 35 (34.0) | 0.66 (0.43, 1.03) |
| Congestive heart failure | 77 (8.1) | 97 (9.8) | 0.83 (0.62, 1.10) | 85 (11.1) | 92 (12.5) | 0.89 (0.68, 1.18) | 14 (12.6) | 17 (16.5) | 0.76 (0.40, 1.47) |
| Hyperkalemia | 70 (7.4) | 98 (9.9) | 0.75 (0.56, 1.00) | 75 (9.8) | 84 (11.4) | 0.86 (0.64, 1.16) | 15 (13.5) | 21 (20.4) | 0.66 (0.36, 1.21) |
| Hypersensitivity | 70 (7.4) | 85 (8.6) | 0.86 (0.64, 1.17) | 64 (8.4) | 61 (8.3) | 1.01 (0.72, 1.42) | 9 (8.1) | 7 (6.8) | 1.19 (0.46, 3.09) |
| Hepatotoxicity | 60 (6.3) | 59 (5.9) | 1.06 (0.75, 1.51) | 53 (6.9) | 64 (8.7) | 0.80 (0.56, 1.13) | 14 (12.6) | 10 (9.7) | 1.30 (0.60, 2.79) |
| Malignant or unspecified tumors | 26 (2.7) | 37 (3.7) | 0.74 (0.45, 1.20) | 17 (2.2) | 22 (3.0) | 0.75 (0.40, 1.39) | 3 (2.7) | 2 (1.9) | 1.39 (0.24, 8.16) |
| Pulmonary hypertension | 27 (2.8) | 27 (2.7) | 1.04 (0.62, 1.77) | 20 (2.6) | 25 (3.4) | 0.77 (0.43, 1.38) | 2 (1.8) | 3 (2.9) | 0.62 (0.11, 3.63) |
| Cardiac valve disorders | 20 (2.1) | 26 (2.6) | 0.80 (0.45, 1.43) | 22 (2.9) | 26 (3.5) | 0.82 (0.47, 1.43) | 3 (2.7) | 2 (1.9) | 1.39 (0.24, 8.16) |
| Retinal disorders | 21 (2.2) | 15 (1.5) | 1.46 (0.76, 2.82) | 11 (1.4) | 16 (2.2) | 0.66 (0.31, 1.42) | 0 (0) | 1 (1.0) | — |
| Adrenal disorder | 1 (0.1) | 1 (0.1) | 1.05 (0.07, 16.69) | 1 (0.1) | 0 (0) | — | 0 (0) | 1 (1.0) | — |
| Subgroups by ESA dose at baseline | ≤ 90 U/kg/week | > 90 and < 300 U/kg/week | ≥ 300 U/kg/week | |||
|---|---|---|---|---|---|---|
| Vadadustat ( | Darbepoetin alfa ( | Vadadustat ( | Darbepoetin alfa ( | Vadadustat ( | Darbepoetin alfa ( | |
| Weeks 24–36 (PEP) | ||||||
| Responders based on the observed data, | 481 (52.5) (49.2, 55.8) | 544 (56.2) (53.0, 59.4) | 341 (47.1) (43.4, 50.8) | 354 (51.1) (47.3, 54.9) | 39 (38.2) (28.8, 48.4) | 40 (40.8) (31.0, 51.2) |
| Proportion difference (vadadustat–darbepoetin alfa) (95% CI) | −0.027 (−0.072, 0.019) | −0.034 (−0.088, 0.021) | −0.027 (−0.175, 0.122) | |||
| Weeks 40–52 (SEP) | ||||||
| Responders based on the observed data, | 439 (47.9) (44.7, 51.2) | 503 (52.0) (48.8, 55.2) | 301 (41.6) (38.0, 45.3) | 358 (51.7) (47.9, 55.4) | 31 (30.4) (21.7, 40.3) | 33 (33.7) (24.4, 43.9) |
| Proportion difference (vadadustat–darbepoetin alfa) (95% CI) | −0.031 (−0.078, 0.015) | −0.090 (−0.144, −0.036) | −0.039 (−0.186, 0.108) | |||
| Parameter (reference range) | Baseline | PEP (weeks 24–36) | SEP (weeks 40–52) | |||||
|---|---|---|---|---|---|---|---|---|
| Vadadustat, mean (SD) | Darbepoetin alfa, mean (SD) | Vadadustat, ∆LS mean from baseline (SEM) | Darbepoetin alfa, ∆LS mean from baseline (SEM) | Difference (vadadustat–darbepoetin alfa), LS mean (95% CI) | Vadadustat, ∆LS mean from baseline (SEM) | Darbepoetin alfa, ∆LS mean from baseline (SEM) | Difference (vadadustat–darbepoetin alfa), LS mean (95% CI) | |
| Baseline ESA dose subgroup: ≤ 90 U/kg/week | ||||||||
| TIBC, μg/dL (250–425 μg/dL |
211.9 (34.9) |
213.3 (35.4) |
29.7 (1.4) |
1.4 (1.3) | 28.3 (25.5, 31.1) |
27.2 (1.5) |
0.3 (1.4) |
26.8 (23.8, 29.8) |
|
Hepcidin, ng/mL (male: 8.6–82.6 ng/mL; female: 6.2–51.5 ng/mL |
198.8 (138.9) |
194.1 (132.3) |
−61.1 (5.1) |
−29.2 (5.0) |
−31.9 (−42.5, −21.2) |
−75.7 (5.4) |
−48.8 (5.3) |
−26.9 (−37.9, −16.0) |
|
Ferritin, ng/mL (10–380 ng/mL |
876 (569) |
855 (527) |
−114.0 (16.4) |
−57.1 (16.1) |
−56.9 (−90.8, −23.1) |
−146.6 (17.3) |
−85.3 (17.0) |
−61.3 (−96.7, −25.9) |
|
Serum iron, μg/dL (male: 65–175; female: 50–170 |
82.1 (28.3) |
80.6 (27.4) |
−2.4 (1.2) |
−7.3 (1.1) |
4.9 (2.6, 7.3) |
−5.7 (1.3) |
−9.1 (1.3) |
3.4 (0.7, 6.0) |
|
Transferrin saturation, % (male: 20–50; female: 15–50 |
39.2 (13.5) |
38.1 (13.1) |
−5.3 (0.5) |
−3.3 (0.5) |
−2.0 (−3.1, −0.8) |
−6.6 (0.6) |
−4.0 (0.6) |
−2.6 (−3.9, −1.4) |
|
C‐reactive protein, mg/L (0.0–4.9 mg/L |
9.2 (17.9) |
9.4 (17.6) |
0.6 (1.0) |
1.7 (1.0) |
−1.1 (−3.3, 1.0) |
1.3 (1.1) |
2.6 (1.1) |
−1.3 (−3.6, 0.1) |
| Baseline ESA dose subgroup: > 90 and < 300 U/kg/week | ||||||||
|
TIBC, μg/dL (250–425 μg/dL |
207.3 (36.4) |
210.1 (36.5) |
32.6 (2.0) |
1.7 (1.9) |
31.0 (27.2, 34.7) |
29.6 (2.2) |
2.6 (2.1) |
27.0 (22.9, 31.1) |
|
Hepcidin, ng/mL (male: 8.6–82.6 ng/mL; female: 6.2–51.5 ng/mL |
191.9 (140.9) |
187.5 (139.6) |
−43.5 (6.3) |
−37.1 (6.3) |
−6.4 (−18.6, 5.7) |
−57.3 (7.4) |
−32.8 (7.4) |
−24.5 (−38.4, −10.6) |
|
Ferritin, ng/mL (10–380 ng/mL |
824 (563) |
829 (560) |
−38.6 (25.8) |
−11.3 (25.8) |
−27.2 (−77.0, 22.5) |
−54.7 (24.4) |
−7.9 (23.9) |
−46.7 (−92.7, −0.7) |
|
Serum iron, μg/dL (male: 65–175; female: 50–170 |
77.3 (30.0) |
77.3 (28.0) |
2.7 (1.7) |
−4.4 (1.7) |
7.1 (3.8, 10.3) |
0.3 (1.7) |
−2.4 (1.7) |
2.7 (−0.6, 6.0) |
|
Transferrin saturation, % (male: 20–50; female: 15–50 |
37.2 (13.3) |
37.0 (12.9) |
−3.5 (0.7) |
−2.1 (0.7) |
−1.3 (−2.7, 0.1) |
−3.8 (0.8) |
−1.2 (0.8) |
−2.6 (−4.2, −1.1) |
|
C‐reactive protein, mg/L (0.0–4.9 mg/L |
11.3 (22.9) |
9.5 (16.3) |
3.9 (1.3) |
3.5 (1.3) |
0.4 (−2.1, 2.9) |
0.8 (1.6) |
3.0 (1.6) |
−2.2 (−5.2, 0.8) |
| Baseline ESA dose subgroup: ≥ 300 U/kg/week | ||||||||
|
TIBC, μg/dL (250–425 μg/dL |
209.1 (42.5) |
202.7 (41.4) |
36.4 (7.0) |
10.6 (7.2) |
25.7 (16.6, 34.8) |
40.1 (7.8) |
10.2 (7.9) |
29.9 (19.8, 40.0) |
|
Hepcidin, ng/mL (male: 8.6–82.6 ng/mL; female: 6.2–51.5 ng/mL |
173.8 (144.0) |
178.9 (146.1) |
−82.2 (27.8) |
−74.3 (28.1) |
−8.0 (−44.0, 28.1) |
−43.4 (28.5) |
−63.3 (28.0) |
20.0 (−14.3, 54.2) |
|
Ferritin, ng/mL (10–380 ng/mL |
798 (520) |
832 (496) |
−40.1 (82.1) |
−51.3 (83.5) |
11.2 (−92.9, 115.3) |
27.5 (94.5) |
−68.0 (96.3) |
95.5 (−25.7, 216.7) |
|
Serum iron, μg/dL (male: 65–175; female: 50–170 |
75.9 (33.3) |
75.0 (33.7) |
5.9 (7.3) |
1.6 (7.4) |
4.3 (−5.1, 13.6) |
8.2 (6.5) |
2.7 (6.6) |
5.5 (−2.9, 13.9) |
|
Transferrin saturation, % (male: 20–50; female: 15–50 |
35.9 (13.7) |
37.5 (15.4) |
−1.6 (3.2) |
0.9 (3.3) |
−2.5 (−6.7, 1.7) |
−1.5 (2.9) |
0.7 (2.9) |
−2.2 (−6.0, 1.5) |
|
C‐reactive protein, mg/L (0.0–4.9 mg/L |
11.6 (16.8) |
13.4 (21.5) |
−0.6 (4.3) |
2.8 (4.3) |
−3.4 (−9.8, 3.0) |
1.8 (6.0) |
−0.8 (6.0) |
2.6 (−5.4, 10.6) |
| Parameter (reference range) | ≤ 90 U/kg/week | > 90 and < 300 U/kg/week | ≥ 300 U/kg/week | |||
|---|---|---|---|---|---|---|
| Vadadustat ( | Darbepoetin alfa ( | Vadadustat ( | Darbepoetin alfa ( | Vadadustat ( | Darbepoetin alfa ( | |
| EPO, mIU/mL, mean (SD) (4–26 mIU/mL | ||||||
| Baseline |
19.7 (35.2) |
20.8 (64.5) |
28.9 (86.4) |
31.8 (89.2) |
66.4 (182.8) |
43.7 (93.2) |
| Week 28 (PEP) |
19.5 (46.4) |
23.3 (143.3) |
26.1 (56.3) |
32.6 (78.6) |
30.5 (66.3) |
52.1 (142.9) |
| Change from baseline at week 28 |
0.8 (54.6) |
5.6 (147.3) |
−3.1 (104.9) |
−0.3 (117.1) |
−22.4 (126.6) |
5.8 (177.0) |
| Treatment difference (vadadustat–darbepoetin alfa), LS mean (95% CI); | −4.0 (−14.7, 6.6); | −6.0 (−13.8, 1.7); | −23.7 (−58.5, 11.1); | |||
| Week 52 (SEP) |
23.7 (47.8) |
21.2 (67.3) |
39.8 (133.1) |
27.8 (62.1) |
63.6 (190.6) |
28.1 (39.8) |
| Change from baseline at week 52 |
4.9 (56.4) |
3.1 (69.7) |
8.9 (156.9) |
−3.1 (110.3) |
9.4 (196.5) |
−24.5 (111.3) |
| Treatment difference (vadadustat–darbepoetin alfa), LS mean (95% CI); | 2.5 (−3.9, 8.9); | 11.4 (−1.9, 24.7); | 34.3 (−12.6, 81.1); | |||
| Reticulocytes, ×103/μL, mean (SD) (25–100 × 103/μL | ||||||
| Baseline |
54.3 (28.1) |
54.2 (25.9) |
54.3 (29.3) |
54.9 (30.0) |
72.6 (40.6) |
64.4 (39.3) |
| Week 28 (PEP) |
55.5 (24.5) |
50.3 (26.8) |
55.4 (28.0) |
51.7 (29.8) |
60.9 (34.0) |
56.5 (36.6) |
| Change from baseline at week 28 |
0.6 (29.0) |
−4.7 (31.0) |
1.6 (33.6) |
−2.3 (32.8) |
−11.8 (50.2) |
−9.8 (44.7) |
| Treatment difference (vadadustat–darbepoetin alfa), LS mean (95% CI); | 5.2 (2.8, 7.6); | 3.9 (0.8, 7.1); | 3.1 (−7.9, 14.1); | |||
| Week 52 (SEP) |
53.9 (25.7) |
46.8 (24.2) |
55.8 (31.3) |
46.8 (28.9) |
52.7 (27.8) |
49.4 (31.1) |
| Change from baseline at week 52 |
−1.9 (30.8) |
−7.5 (28.4) |
1.0 (37.5) |
−8.5 (32.8) |
−18.4 (42.7) |
−16.1 (42.0) |
| Treatment difference (vadadustat–darbepoetin alfa), LS mean (95% CI); | 6.6 (4.1, 9.2); | 9.0 (5.3, 12.7); | 1.6 (−8.0, 11.2); | |||
| RBCs, ×106/μL, mean (SD) (4.2–5.9 × 10⁶/μL | ||||||
| Baseline |
3.3 (0.4) |
3.3 (0.4) |
3.3 (0.4) |
3.3 (0.4) |
3.2 (0.4) |
3.2 (0.4) |
| Week 28 (PEP) |
3.4 (0.4) |
3.4 (0.4) |
3.3 (0.5) |
3.4 (0.5) |
3.1 (0.4) |
3.3 (0.4) |
| Change from baseline at week 28 |
0.1 (0.4) |
0.1 (0.4) |
0.0 (0.5) |
0.1 (0.5) |
−0.1 (0.5) |
0.1 (0.5) |
| Treatment difference (vadadustat–darbepoetin alfa), LS mean (95% CI); | −0.1 (−0.1, 0.0); | −0.1 (−0.2, −0.1); | −0.2 (−0.4, −0.1); | |||
| Week 52 (SEP) |
3.4 (0.5) |
3.4 (0.4) |
3.3 (0.5) |
3.4 (0.5) |
3.1 (0.5) |
3.3 (0.4) |
| Change from baseline at week 52 |
0.1 (0.5) |
0.1 (0.4) |
0.0 (0.5) |
0.1 (0.5) |
−0.1 (0.5) |
0.1 (0.5) |
| Treatment difference (vadadustat–darbepoetin alfa), LS mean (95% CI); | 0.0 (−0.1, 0.0); | −0.1 (−0.2, −0.1); | −0.2 (−0.3, 0.0); | |||
| Parameter (reference range) | ≤ 90 U/kg/week | > 90 and < 300 U/kg/week | ≥ 300 U/kg/week | |||
|---|---|---|---|---|---|---|
| Vadadustat ( | Darbepoetin alfa ( | Vadadustat ( | Darbepoetin alfa ( | Vadadustat ( | Darbepoetin alfa ( | |
| Mean corpuscular volume, fL, mean (SD) (79–98 fL | ||||||
| Baseline |
95.0 (6.4) |
94.9 (5.7) |
94.8 (7.4) |
94.6 (7.1) |
94.8 (7.2) |
95.3 (6.6) |
| Week 28 (PEP) |
96.2 (6.6) |
95.6 (6.2) |
96.1 (7.5) |
95.1 (7.3) |
96.2 (7.3) |
96.4 (5.9) |
| Change from baseline at week 28 |
1.2 (4.3) |
0.8 (4.1) |
1.2 (5.2) |
0.6 (4.4) |
1.5 (4.4) |
0.9 (4.1) |
| Treatment difference (vadadustat–darbepoetin alfa), LS mean (95% CI); | 0.5 (0.1, 0.9); | 0.6 (0.1, 1.2); | 0.5 (−0.8, 1.8); | |||
| Week 52 (SEP) |
96.0 (6.7) |
95.6 (6.3) |
96.3 (7.5) |
95.4 (7.5) |
95.9 (8.6) |
97.6 (6.8) |
| Change from baseline at week 52 |
1.2 (4.3) |
0.9 (4.1) |
1.5 (5.3) |
0.7 (5.0) |
1.2 (5.5) |
1.9 (5.1) |
| Treatment difference (vadadustat–darbepoetin alfa), LS mean (95% CI); | 0.3 (−0.1, 0.8); | 0.8 (0.2, 1.4); | −0.9 (−2.6, 0.8); | |||
| Mean corpuscular hemoglobin, pg/cell, mean (SD) (26–34 pg/cell | ||||||
| Baseline |
31.3 (2.2) |
31.3 (2.1) |
30.9 (2.6) |
31.0 (2.6) |
30.8 (2.7) |
30.9 (2.4) |
| Week 28 (PEP) |
31.5 (2.3) |
31.3 (2.2) |
31.5 (2.7) |
31.0 (2.7) |
31.7 (2.6) |
31.5 (2.2) |
| Change from baseline at week 28 |
0.3 (1.4) |
0.1 (1.4) |
0.5 (1.7) |
0.0 (1.5) |
1.0 (1.6) |
0.4 (1.3) |
| Treatment difference (vadadustat–darbepoetin alfa), LS mean (95% CI); | 0.2 (0.1, 0.4); | 0.5 (0.3, 0.7); | 0.4 (0.0, 0.9); | |||
| Week 52 (SEP) |
31.5 (2.4) |
31.3 (2.3) |
31.4 (2.8) |
31.0 (2.8) |
31.6 (3.2) |
31.6 (2.3) |
| Change from baseline at week 52 |
0.2 (1.6) |
0.0 (1.4) |
0.5 (1.8) |
−0.1 (1.8) |
1.0 (2.0) |
0.5 (1.5) |
| Treatment difference (vadadustat–darbepoetin alfa), LS mean (95% CI); | 0.2 (0.1, 0.4); | 0.6 (0.3, 0.8); | 0.3 (−0.2, 0.9); | |||
| RBC distribution width, %, mean (SD) (9.0%–14.5% | ||||||
| Baseline |
15.4 (1.6) |
15.4 (1.6) |
16.2 (2.0) |
16.2 (1.9) |
17.2 (2.1) |
17.0 (2.1) |
| Week 28 (PEP) |
15.2 (1.6) |
16.0 (1.8) |
15.5 (1.8) |
16.6 (2.1) |
16.0 (2.3) |
16.7 (2.3) |
| Change from baseline at week 28 |
−0.3 (1.8) |
0.6 (1.8) |
−0.6 (2.3) |
0.5 (2.1) |
−1.2 (2.2) |
−0.3 (2.1) |
| Treatment difference (vadadustat–darbepoetin alfa), LS mean (95% CI); | −0.9 (−1.0, −0.7); | −1.0 (−1.2, −0.8); | −0.8 (−1.4, −0.2); | |||
| Week 52 (SEP) |
15.4 (1.7) |
16.2 (1.8) |
15.9 (2.0) |
16.7 (2.0) |
16.1 (2.2) |
16.6 (2.3) |
| Change from baseline at week 52 |
0.0 (1.8) |
0.8 (1.9) |
−0.3 (2.5) |
0.6 (2.1) |
−1.2 (2.0) |
−0.2 (2.6) |
| Treatment difference (vadadustat–darbepoetin alfa), LS mean (95% CI); | −0.8 (−1.0, −0.6); | −0.9 (−1.1, −0.6); | −0.8 (−1.4, −0.1); | |||
- —Akebia Therapeutics10.13039/501100020141
Peer Reviews
No public reviews on file for this paper yet. If you reviewed it on a platform where reviews are public (OpenReview, ICLR, NeurIPS, ICML), you can paste yours below so the community can read it here.
Videos
No videos yet. Explain this paper in a talk, walkthrough, or lecture? Add one.
Taxonomy
TopicsErythropoietin and Anemia Treatment · Biosimilars and Bioanalytical Methods · Platelet Disorders and Treatments
Introduction
1
Anemia complicating chronic kidney disease (CKD) is associated with increased morbidity, mortality, and health care resource utilization [1]. Anemia prevalence increases with advanced CKD, primarily due to inflammation‐related processes: impaired erythropoietin (EPO) production [2, 3, 4] and restricted iron availability for erythropoiesis [4, 5]. Inflammation in CKD transforms interstitial renal cortical EPO‐producing fibroblasts into EPO‐nonproducing myofibroblasts [6]. Inflammation suppresses erythropoietic progenitor and precursor cells via pro‐apoptotic and inhibitory cytokines [7]. Inflammation indirectly suppresses erythropoiesis via the cytokine interleukin‐6, which increases liver production of hepcidin, the down‐regulator of ferroportin [8].
Standard treatments for CKD–related anemia include (1) recombinant human EPO or longer‐acting derivatives such as darbepoetin alfa (hereafter “darbepoetin”) or methoxy polyethylene glycol–epoetin beta, collectively termed erythropoiesis‐stimulating agents (ESAs); and (2) intravenous or oral iron supplementation to accommodate reduced intestinal iron absorption and increased iron sequestration [7, 9, 10]. However, responses to treatment vary significantly. Some patients cannot achieve and/or maintain target hemoglobin concentrations despite escalating ESA doses and large intravenous iron doses, especially in dialysis‐dependent (DD)‐CKD [11]. Safety concerns with escalating ESA doses include an increased risk for death, cardiovascular events, and cancer progression [12, 13, 14]. Targeting higher hemoglobin values in CKD patients increases cardiovascular risk [12, 13, 14], which may be related to higher ESA doses and/or higher hemoglobin. Excessive intravenous iron increases the risk for iron deposition in organs, infections, and atherosclerosis [15, 16, 17, 18]. Therefore, alternative therapies are sought for patients requiring high ESA and/or iron doses.
Vadadustat, a hypoxia‐inducible factor prolyl hydroxylase inhibitor (HIF‐PHI) that stimulates erythropoiesis [19, 20, 21, 22], is approved for treating anemia in DD‐CKD in many countries, including the United States. Vadadustat increases endogenous EPO in plasma above baseline without producing larger increases associated with ESAs [23]. Vadadustat improves iron availability by decreasing serum hepcidin while increasing iron and total iron‐binding capacity (TIBC) [24], resulting in increased red blood cells (RBCs), mean corpuscular volume, and mean corpuscular hemoglobin. By these mechanisms, vadadustat may safely ameliorate anemia in patients with DD‐CKD who require high ESA doses.
To determine vadadustat's potential to treat anemia in patients requiring high ESA doses, its safety and efficacy were compared with darbepoetin across prespecified baseline ESA dose subgroups in the prevalent DD‐CKD INNO_2_VATE trial (NCT02892149). Patients on maintenance dialysis were stratified by ESA doses at trial baseline into low (≤ 90 U/kg/week), intermediate (> 90 and < 300 U/kg/week), or high (≥ 300 U/kg/week) subgroups. In the prevalent INNO_2_VATE trial, vadadustat met the prespecified primary safety endpoint of time to major adverse cardiovascular events (MACE) and was noninferior to darbepoetin [19]. Vadadustat also met the primary efficacy endpoint of mean change in hemoglobin from baseline during the primary evaluation period (PEP) by elevating and maintaining hemoglobin in patients already receiving, or starting, maintenance dialysis [19]. Understanding vadadustat safety and efficacy in ESA dose subgroups will help optimize vadadustat usage, irrespective of responses to standard therapy.
Materials and Methods
2
Study Design
2.1
The prevalent DD‐CKD INNO_2_VATE trial, a phase 3, global, open‐label, sponsor‐blind, parallel‐group, active‐controlled, noninferiority trial, compared the safety and efficacy of vadadustat with darbepoetin in patients with DD‐CKD [19]. Rationale, methods, and primary results have been reported [19, 25]. The trial was performed in compliance with the International Conference on Harmonization, Good Clinical Practice guidelines, local regulatory requirements and laws, and the Declaration of Helsinki. Institutional review board approval was obtained at participating sites. All patients provided written informed consent before enrollment. Analyses reported herein were conducted by prespecified ESA baseline dose subgroups.
Study Population
2.2
Patients were aged ≥ 18 years, treated with hemodialysis or peritoneal dialysis for ≥ 12 weeks before screening, receiving ESA therapy at enrollment, and had baseline hemoglobin of 8–11 g/dL (US) or 9–12 g/dL (non‐US), serum ferritin ≥ 100 ng/mL, and transferrin saturation ≥ 20%. Patients were excluded for RBC transfusion within 8 weeks before randomization, anemia secondary to causes other than CKD, uncontrolled hypertension, or recent cardiovascular event [19].
Study Procedures
2.3
Patients were randomized 1:1 to vadadustat or darbepoetin, stratified by geographic region (USA/Europe/other regions), New York Heart Association Functional Classification (0/I vs. II/III), and hemoglobin concentration (< 10 vs. ≥ 10 g/dL). The trial had 4 periods: (1) conversion (weeks 0–23); (2) maintenance (weeks 24–52), which included primary (weeks 24–36) and secondary (weeks 40–52) evaluation periods; (3) long‐term treatment (week 53 to end of treatment [182 weeks]); and (4) post‐treatment 4‐week safety follow‐up [19, 25].
Initial vadadustat dose for all patients was not based on baseline ESA dose, but was fixed at 300 mg orally once daily, with doses of 150, 300, 450, and 600 mg available for adjustments. Maximum vadadustat daily dose was 600 mg. Darbepoetin was administered intravenously for patients on maintenance hemodialysis and subcutaneously for patients receiving peritoneal dialysis at the site facility or at home according to the investigator's determination and local practice. Initial trial dose of darbepoetin was based on prerandomization dose for patients already receiving darbepoetin, or on local product label if receiving another ESA before randomization.
Trial doses were adjusted according to the investigator's discretion, incorporating protocol‐based guidance, and considering the patient's clinical condition and hemoglobin trajectory [19, 25]. Hemoglobin concentrations were measured every 2 weeks for weeks 0–12 and every 4 weeks for weeks 12–52, and doses were adjusted accordingly. Investigators aimed to maintain hemoglobin within geography‐specific target ranges (10–11 g/dL in the USA; 10–12 g/dL in other countries). Iron supplementation was encouraged to maintain serum ferritin ≥ 100 ng/mL or transferrin saturation ≥ 20%.
Starting at 6 weeks, patients could receive rescue therapy for worsening anemia symptoms with hemoglobin < 9.5 g/dL. Rescue therapy was defined as receiving an ESA or RBC transfusion in the vadadustat group, and receiving another ESA, a two‐fold or greater increase over the previous darbepoetin dose, or RBC transfusion in the darbepoetin group.
Endpoints
2.4
Safety and efficacy were evaluated in prespecified subgroups of patients categorized by their baseline intravenous epoetin alfa or epoetin alfa–equivalent doses (low [≤ 90 U/kg/week], intermediate [> 90 and < 300 U/kg/week], or high [≥ 300 U/kg/week; a threshold for characterizing ESA resistance]) [26]. Conversions for other ESAs to intravenous epoetin alfa equivalents (U/kg/week) were: darbepoetin, 1:200 [27, 28]; methoxy polyethylene glycol–epoetin beta, 1:220 [29]; and subcutaneous epoetin alfa, 1:1.25 [30, 31]. The prespecified primary safety endpoint was the first occurrence of an adjudicated MACE (all‐cause mortality, nonfatal myocardial infarction, or nonfatal stroke) using time‐to‐event analysis. Additional related endpoints included all‐cause mortality, MACE plus hospitalizations for heart failure or thromboembolic events, the first occurrence of cardiovascular MACE (cardiovascular mortality, nonfatal myocardial infarction, or nonfatal stroke), and cardiovascular death [19]. We also assessed treatment‐emergent serious adverse events of special interest.
The prespecified primary efficacy endpoint was mean change in hemoglobin from baseline to PEP (weeks 24–36); the prespecified secondary endpoint was mean change in hemoglobin from baseline to secondary evaluation period (SEP; weeks 40–52) [19]. We also assessed for each baseline ESA dose subgroup: (1) number of patients with average hemoglobin within geography‐specific target range during the PEP and SEP; (2) incidence of RBC transfusions and ESA rescues; (3) vadadustat and darbepoetin dose over the PEP and SEP; (4) iron‐related and inflammatory parameters (serum TIBC, hepcidin, ferritin, iron, transferrin saturation, and C‐reactive protein) [25]; and (5) serum EPO/mL, reticulocytes/μL, RBCs/μL, and RBC indices (mean corpuscular volume, mean corpuscular hemoglobin, and RBC distribution width). Post hoc analyses were performed for interactions between treatment and ESA baseline dose for both MACE and hemoglobin change from baseline.
Statistics
3
Analysis of time to first MACE was based on a Cox regression model and included covariates of baseline hemoglobin, randomization strata of region (USA, Europe, other regions), New York Heart Association class (0 or I/II or III), sex, age (> 65 years/≤ 65 years), race (White/non‐White), pre‐existing cardiovascular disease (yes/no), and diabetes mellitus (yes/no). We calculated hazard ratios (vadadustat/darbepoetin) and 95% CIs from model parameter estimates and standard errors, respectively. For the primary efficacy endpoint, noninferiority of vadadustat was achieved if the lower bound of the 95% CI was ≥ −0.75, applied to the difference in mean change (vadadustat–darbepoetin).
In efficacy analyses, we used multiple imputation with analysis of covariance, with covariates of treatment, baseline hemoglobin, and stratification factors (region, New York Heart Association class). Missing data were addressed through multiple imputations using a fully conditional specification approach. No multiplicity adjustments were applied for MACE or efficacy analyses in the subgroups, although in the overall population sequential testing was employed for primary and secondary efficacy endpoints and MACE‐related endpoints to control type I error. Descriptive statistics were captured for the incidence of RBC transfusions and ESA rescue by baseline ESA dose subgroup. We compared results for iron‐related parameters, inflammatory markers, serum endogenous EPO, reticulocytes, and RBC indices using least‐squares (LS) mean change from baseline and differences (vadadustat–darbepoetin; 95% CI) during the PEP and SEP. For the efficacy analysis, we further tested the interaction between baseline ESA dose and treatment group in the analysis of covariance model.
Results
4
Baseline Characteristics
4.1
In the prevalent DD‐CKD INNO_2_VATE trial, 3554 patients underwent randomization (vadadustat, 1777; darbepoetin, 1777). Baseline characteristics were similar across treatment groups and baseline ESA dose subgroups (Table 1), except for race and body mass index. The proportion of Black patients was directly related to baseline ESA dose and mean body mass index was inversely related. Additionally, > 80% of patients in the high baseline ESA dose subgroup were from the USA, whereas ~60% were from the USA in the low and intermediate baseline ESA dose subgroups. Mean hemoglobin concentrations were slightly lower in the high baseline ESA dose subgroup compared with the low and intermediate dose subgroups.
MACE
4.2
Among patients receiving low, intermediate, and high baseline ESA doses, a first MACE occurred in 18.2%, 19.4%, and 18.6% of vadadustat‐treated patients, and 18.9%, 20.5%, and 27.8% of darbepoetin‐treated patients, respectively (Figure 1, Table S1). Hazard ratios for MACE were 0.99, 95% CI, 0.81–1.23 (low [≤ 90 U/kg/week]); 0.93, 95% CI, 0.74–1.18 (intermediate [> 90 and < 300 U/kg/week]); and 0.62, 95% CI, 0.34–1.14 (high [≥ 300 U/kg/week]) (Figure 1). Treatment was not a significant factor for MACE (interaction p = 0.92); however, baseline ESA dose was a statistically significant risk factor for MACE (p = 0.04). Similar MACE results were observed for other endpoints, including all‐cause mortality, MACE plus hospitalizations for heart failure or thromboembolic events, cardiovascular MACE, and cardiovascular death (Figure 1, Table S1).
Prespecified MACE analysis by baseline ESA dose in patients with prevalent DD‐CKD (safety population). Any MACE plus hospitalizations for heart failure or thromboembolic events excluding vascular access thrombosis. DD‐CKD, dialysis‐dependent chronic kidney disease; ESA, erythropoiesis‐stimulating agent; MACE, major adverse cardiovascular events.
Treatment‐Emergent Serious Adverse Events of Special Interest
4.3
Treatment‐emergent serious adverse events of special interest were lower in vadadustat‐treated patients compared with darbepoetin‐treated patients across baseline ESA dose subgroups (Table 2). The difference in the proportion of patients with any treatment‐emergent serious adverse event of special interest between the vadadustat and darbepoetin groups was greatest in the high baseline ESA dose subgroup (48 patients [43.2%] in the vadadustat group and 57 patients [55.3%] in the darbepoetin group; relative risk, 0.78, 95% CI, 0.59–1.03) (Table 2).
Changes in Hemoglobin Concentration
4.4
Maintenance of hemoglobin with vadadustat was noninferior to darbepoetin across baseline ESA dose subgroups (Figure 2, Table S2). In vadadustat‐treated patients, a transient decline in mean hemoglobin was observed in the high baseline ESA dose subgroup during weeks 2–8, after which hemoglobin steadily increased by weeks 24–36. A less pronounced transient decline was observed in the intermediate baseline ESA dose subgroup, but not in the low baseline ESA dose subgroup (Figure 2).
Mean hemoglobin over time by baseline ESA dose in patients with prevalent DD‐CKD. Geography‐specific target range for hemoglobin: 10–11 g/dL in the USA and 10–12 g/dL in other countries. DD‐CKD, dialysis‐dependent chronic kidney disease; ESA, erythropoiesis‐stimulating agent; PEP, primary evaluation period; SEP, secondary evaluation period.
The treatment difference (vadadustat–darbepoetin) for LS mean change in hemoglobin from baseline to the PEP was −0.10 g/dL (95% CI, −0.19 to −0.02), −0.20 g/dL (95% CI, −0.30 to −0.09), and −0.39 g/dL (95% CI, −0.67 to −0.11) for low, intermediate, and high baseline ESA dose subgroups, respectively (Table S2). Similar results were observed for the SEP (Table S2). In the analysis of covariance model with the interactions between ESA baseline dose and treatment groups, we found negative parameter estimations for both baseline ESA dose and the interaction terms in both the PEP (interaction term −0.00067, p = 0.03) and the SEP (interaction term −0.00121, p = 0.0002). This result suggests that the higher the baseline ESA dose, the less the change in hemoglobin from baseline.
The proportions of patients with mean hemoglobin within geography‐specific target range during the PEP and SEP were similar across treatment groups (Table 3). Response rates were higher in lower baseline ESA dose subgroups, irrespective of treatment, but were similar between treatment groups within each baseline ESA dose subgroup.
Changes in Treatment Dose
4.5
Daily Vadadustat Dose
4.5.1
All patients were initiated on vadadustat at 300 mg/day. By week 12, 52.3%, 63.6%, and 71.8% of patients were increased to 450 or 600 mg/day in the low, intermediate, and high baseline ESA dose subgroups, respectively. In the high baseline group, > 50% were receiving 600 mg/day (Figure 3). During both the PEP and SEP, these percentages increased further, especially in the high ESA dose subgroup (Figure 3).
Daily vadadustat dose over the primary and secondary evaluation periods by baseline ESA dose (safety population). This analysis includes only those patients who were receiving vadadustat and not those whose doses were interrupted due to elevated hemoglobin levels, ESA rescue, or adverse events. ESA, erythropoiesis‐stimulating agent; PEP, primary evaluation period; SEP, secondary evaluation period.
Weekly Vadadustat and Darbepoetin Doses
4.5.2
Mean (SD) vadadustat doses received were 2.42 (1.27), 2.62 (1.24), and 2.61 (1.33) g/week in the low, intermediate, and high baseline ESA subgroups, respectively, during the PEP, and 2.48 (1.24), 2.73 (1.21), and 2.83 (1.10) g/week, respectively, during the SEP. Mean (SD) darbepoetin doses received were 27.3 (23.9), 41.7 (34.3), and 49.6 (34.0) μg/week in the low, intermediate, and high ESA baseline subgroups, respectively, during the PEP, and 28.6 (26.4), 43.5 (36.2), and 47.0 (38.1) μg/week during the SEP.
Rescue Therapy
4.6
A higher proportion of patients in the darbepoetin treatment arm received ESA rescue in the low baseline ESA dose subgroup, whereas a higher proportion of patients in the vadadustat‐treated group received ESA rescue in the intermediate and high baseline ESA dose subgroups (Table S3). Among patients in intermediate and high baseline ESA dose subgroups, RBC transfusions were similar between treatment arms across all time points. In the low baseline ESA dose subgroup, RBC transfusion rescue was marginally higher for vadadustat‐treated patients than for darbepoetin‐treated patients at earlier time points (< 36 weeks) but similar between the treatment arms thereafter (Table S3).
Iron‐Related and Inflammation‐Related Parameters
4.7
Table 4 shows serum iron‐related and inflammation parameters. TIBC increased with vadadustat treatment during the PEP and SEP across all baseline ESA dose subgroups. Compared with these TIBC increases, relatively smaller changes occurred in serum iron and transferrin saturation across all ESA dose subgroups and between treatment groups from baseline to the PEP and SEP. Serum hepcidin decreased from baseline during the PEP and SEP in both treatment groups across all baseline ESA dose subgroups, with a trend for more reduction in vadadustat‐treated subgroups. The difference in mean serum hepcidin between vadadustat‐ and darbepoetin‐treated groups was greatest in the low baseline ESA dose subgroups (−31.9 ng/mL; 95% CI, −42.5 to −21.2). Serum ferritin was generally decreased from baseline during the PEP. Change from baseline in median serum ferritin during the PEP was most pronounced in the low baseline ESA dose subgroups (vadadustat: −73.3 ng/mL [lower quartile (Q1) to upper quartile (Q3), −246.8 to 110.0]; darbepoetin: −35.0 ng/mL [Q1 to Q3, −200.0 to 176.0]) with smaller changes among patients from the higher baseline ESA dose subgroups (Table S4). Median serum C‐reactive protein did not materially change in any baseline ESA dose subgroup (Table S4). Mean baseline C‐reactive protein was elevated in all subgroups, due to exceptionally elevated C‐reactive protein levels in a few patients in each subgroup (Table 4).
Serum EPO, Reticulocytes, and RBC Indices
4.8
Table 5 shows mean serum EPO concentrations measured before administration of vadadustat or darbepoetin at baseline, 28 weeks, and 52 weeks (includes darbepoetin subgroups, whose EPO receptors are stimulated by both endogenous EPO and darbepoetin). Baseline EPO levels were in the range of healthy individuals for low ESA dose subgroups, very slightly increased above normal for intermediate subgroups, and slightly further elevated in high subgroups. EPO levels remained in these respective ranges during the trial (Table 5). Reticulocytes/μL in all vadadustat‐ and darbepoetin‐treated subgroups were maintained in the normal range for healthy individuals but less than expected for the same degree of anemia in healthy individuals with intact erythropoietic responses (Table 5). Compared with their respective low and intermediate subgroups, both high ESA dose subgroups had slightly increased baseline reticulocytes, but similar reticulocytes at 28 and 52 weeks (Table 5). Reticulocytes in each vadadustat‐treated subgroup were very slightly increased, as previously noted, compared with their respective darbepoetin‐treated subgroups (Table 5). Steady‐state RBCs/μL were essentially stable in all subgroups throughout the trial (Table 5). Baseline mean corpuscular volume and mean corpuscular hemoglobin of patients' RBCs were at the upper end of the normal ranges in all subgroups, where they remained throughout the study (Table 6).
Discussion
5
When comparing safety and efficacy between vadadustat and darbepoetin by baseline ESA dose among patients with CKD on maintenance dialysis, we found no meaningful between‐group differences. No difference was found in the primary cardiovascular safety endpoint, and similar outcomes were noted for other safety endpoints, including all‐cause mortality, MACE plus hospitalizations for heart failure or thromboembolic events, and cardiovascular death. The vadadustat‐treated group had fewer treatment‐emergent serious adverse events of special interest across baseline ESA dose subgroups.
Vadadustat was noninferior (threshold of −0.75 g/dL) to darbepoetin for hemoglobin maintenance across the 3 baseline ESA dose subgroups. However, vadadustat‐treated patients requiring high and intermediate doses of ESAs at baseline had transient declines in mean hemoglobin concentration during weeks 2–8, followed by steady increases until week 20. The vadadustat low baseline ESA dose subgroup had no transient hemoglobin decrease. These results are consistent with initiating all vadadustat‐treated patients at 300 mg/day and limiting their maximum dose to 600 mg/day, while initial doses for darbepoetin‐treated patients were based on ESA dose at enrollment with no maximum dose. In each subgroup, vadadustat‐treated patients were frequently titrated up from the initiating 300 mg/day dose, suggesting that patients with higher ESA baseline doses may require higher initial and maintenance doses of vadadustat. Further clinical trials will be required to determine whether the use of higher vadadustat doses can avoid early transient declines in hemoglobin and sustain hemoglobin responses in patients like those in the high baseline ESA subgroup, without increasing the relatively low levels of MACE found here. Darbepoetin doses were not limited and, as expected for subgroups defined by baseline ESA dose, darbepoetin doses were proportionately greater as baseline ESA subgroups increased from low to high. More frequent ESA rescue in the darbepoetin‐treated low baseline ESA subgroup was likely due to darbepoetin dose adjustments not being limited and dose doubling being considered as rescue. More frequent ESA rescue in the vadadustat‐treated intermediate and high baseline ESA subgroups was likely due to the vadadustat maximum dose being limited to 600 mg/day.
The few differences in patient characteristics between the high baseline ESA dose subgroup and the low and intermediate baseline ESA dose subgroups—higher proportions of Black patients, lower hemoglobin and body mass index—have been associated with higher ESA requirements [34, 35, 36, 37].
Vadadustat increases iron availability compared with darbepoetin in DD‐CKD–related anemia, as increased serum transferrin (measured as TIBC) is accompanied by decreased transferrin saturation, serum hepcidin, and serum ferritin. In each ESA dose subgroup, vadadustat significantly increased TIBC from baseline during the PEP and SEP, an effect consistent with HIF‐mediated transferrin transcription [38] that was not observed in the respective darbepoetin‐treated subgroups. Serum hepcidin was reduced in all subgroups from baseline to the PEP, with more pronounced reductions in vadadustat‐treated patients, especially the low baseline ESA dose subgroup. Slightly to moderately elevated serum C‐reactive protein remaining essentially unchanged in all subgroups suggests that hepcidin decreases were less related to decreased inflammation than increased erythroferrone by vadadustat and darbepoetin enhancement of erythropoietic activity as well as vadadustat‐mediated transferrin transcription.
In vadadustat‐treated patients, mean endogenous EPO increased slightly with increasing ESA baseline doses but remained in the normal to slightly elevated range. These EPO concentrations resulted in reticulocytes/μL in the normal range, while steady‐state RBCs/μL remained in the targeted moderately anemic range. Endogenous EPO is slightly increased by vadadustat and other HIF‐PHIs, without the large transient increases in EPO seen with ESAs [23]. Because EPO prevents apoptotic death of erythroid progenitors [39], sustained normal to slightly elevated EPO levels can maintain regulated RBC production [40], as observed here in vadadustat‐treated patients.
Maintaining reticulocytes/μL in the normal range and total RBCs/μL in the moderately anemic range in each vadadustat and darbepoetin subgroup is consistent with reduced RBC lifespans that negatively correlate with ESA dose in hemodialyzed patients with CKD [41]. Relatively increased reticulocytes in the high ESA subgroup at baseline are most likely due to large ESA doses increasing reticulocytes but not RBC numbers because after the reticulocytes become RBCs their lifespan is the shortest of the 3 subgroups. Modeling of DD‐CKD patients' anemia with reduced RBC lifespans predicts increased endogenous EPO within the normal and slightly above‐normal range can achieve hemoglobin concentrations between 10 and 12 g/dL [42]. As baseline ESA dose increased, corresponding vadadustat dose increased, resulting in slightly increased endogenous EPO production while maintaining the target hemoglobin concentration. These results and vadadustat pharmacology [23] suggest that further increases in vadadustat doses will likely improve the responses of a range of patients, including those with high baseline ESA requirements, while only slightly elevating endogenous EPO.
Slightly increased mean corpuscular volume and mean corpuscular hemoglobin at 28 and 52 weeks contributed to the maintenance of hemoglobin in all subgroups and are consistent with increased iron availability due to reduced hepcidin. Slightly greater increases in vadadustat‐treated subgroups than in the respective darbepoetin‐treated subgroups, especially in the low and intermediate subgroups, suggest that mean corpuscular volume and mean corpuscular hemoglobin of the high baseline ESA dose subgroup might increase further if vadadustat doses were increased above 600 mg/day.
Limitations of our analyses include the restricted range of vadadustat doses and variable iron supplementation by individual investigator practices. Future studies including higher vadadustat doses and more regulated iron supplementation will provide information for vadadustat dose optimization. The present analyses, however, show that vadadustat provides regulated, limited inductions of endogenous EPO, improves iron availability, and represents a safe, effective alternative to the current treatment of patients with anemia and DD‐CKD, including patients requiring high ESA doses.
Funding
This study was funded by Akebia Therapeutics Inc.
Ethics Statement
Before initiating a study, each investigator received approval from their respective institutional review board and/or independent ethics committee. Study investigators obtained additional study approvals as required by national and local ethics regulations. The present manuscript is a secondary analysis of original research previously published in The New England Journal of Medicine [19] For a list of the study investigators who participated in the original phase 3 trials and therefore received institutional review board/independent ethics committee approval and written patient consent forms, please see the original research article [19].
Consent
Study investigators obtained written informed patient consent as required by national and local ethics regulations. An independent ethics committee approved the informed consent forms.
Conflicts of Interest
A.J. reported personal fees from Akebia Therapeutics, as a consultant and member of steering committees for phase 3 trials of vadadustat. S.K.B., W.L., and T.M. are employees of Akebia Therapeutics. M.J.S. reports consultancy on trial steering committees funded by Akebia Therapeutics, consultancy for Boehringer Ingelheim (attended an advisory board), and research funding from the National Institutes of Health. M.J.S.'s spouse reports employment with and ownership interest in Eli Lilly. W.C.W. holds the Gordon A. Cain Chair in Nephrology at Baylor College of Medicine and has served as a consultant for and received honoraria from Anthos, Akebia Therapeutics, Ardelyx, AstraZeneca, Bayer, Boehringer Ingelheim, GlaxoSmithKline, Merck Sharp & Dohme/Merck, Natera, Novartis, Pharmacosmos, Unicycive, Vera, and Zydus. R.A. has received consultancy fees from Vifor, Boehringer Ingelheim, Eli Lilly, Akebia Therapeutics, Reata, Diamedica, Bayer, Chinook, and Vertex. G.M.C. has served on the board of directors of Satellite Healthcare, a nonprofit dialysis provider. He has served as chair or co‐chair of trial steering committees with Akebia Therapeutics, AstraZeneca, CSL Behring, Sanifit, and Vertex. He has served as an advisor to Applaud, Ardelyx, Calico, CloudCath, Durect, Eliaz Therapeutics, Miromatrix, Outset, Renibus, and Unicycive. He has served on data safety monitoring boards with Bayer, Mineralys, and ReCor. He has received research grants from NIAID, NIDDK, and NHLBI. K.U.E. reports personal fees from Akebia Therapeutics as a member of the steering committee for phase 3 trials of vadadustat, lecture fees from Bayer and Boehringer Ingelheim, consulting fees from Novartis, and grant support from Evotec. He has served as a consultant for Akebia Therapeutics and has a grant/contract with Amgen, Bayer Healthcare, and Vifor Pharma. M.J.K. reports personal fees from Akebia Therapeutics as a consultant and member of steering and publication committees for phase 3 trials of vadadustat; from Alexion Pharmaceuticals as a consultant; and from GlaxoSmithKline as a consultant and member of its educators' network. He also is a contributor to BMJ Best Practice.
Supporting information
Table S1: Detailed analysis of prespecified MACE by baseline ESA dose in patients with prevalent DD‐CKD (safety population). Table S2: Change in hemoglobin from baseline for vadadustat treatment during primary and secondary evaluation periods by baseline ESA dose in patients with prevalent DD‐CKD (randomized population). Table S3: Analysis of rescue therapy use by baseline ESA dose in patients with prevalent DD‐CKD. Table S4: Changes in median values of ferritin and C‐reactive protein by baseline ESA dose during weeks 24–36 and 40–52 in patients with prevalent DD‐CKD (randomized population).
The reference list from the paper itself. Each links out to its DOI / PubMed record.
- 1J. L. Babitt , M. F. Eisenga , V. H. Haase , et al., “Controversies in Optimal Anemia Management: Conclusions From a Kidney Disease: Improving Global Outcomes (KDIGO) Conference,” Kidney International 99, no. 6 (2021): 1280–1295.33839163 10.1016/j.kint.2021.03.020 · doi ↗ · pubmed ↗
- 2A. Besarab , J. Caro , B. E. Jarrell , G. Francos , and A. J. Erslev , “Dynamics of Erythropoiesis Following Renal Transplantation,” Kidney International 32, no. 4 (1987): 526–536.3323595 10.1038/ki.1987.241 · doi ↗ · pubmed ↗
- 3M. E. Stauffer and T. Fan , “Prevalence of Anemia in Chronic Kidney Disease in the United States,” P Lo S One 9, no. 1 (2014): e 84943.24392162 10.1371/journal.pone.0084943 PMC 3879360 · doi ↗ · pubmed ↗
- 4J. L. Babitt and H. Y. Lin , “Mechanisms of Anemia in CKD,” Journal of the American Society of Nephrology 23, no. 10 (2012): 1631–1634.22935483 10.1681/ASN.2011111078 PMC 3458456 · doi ↗ · pubmed ↗
- 5A. K. Agarwal , “Iron Metabolism and Management: Focus on Chronic Kidney Disease,” Kidney International. Supplement 11, no. 1 (2021): 46–58.10.1016/j.kisu.2020.12.003PMC 798302233777495 · doi ↗ · pubmed ↗
- 6T. Souma , S. Yamazaki , T. Moriguchi , et al., “Plasticity of Renal Erythropoietin‐Producing Cells Governs Fibrosis,” Journal of the American Society of Nephrology 24, no. 10 (2013): 1599–1616.23833259 10.1681/ASN.2013010030 PMC 3785278 · doi ↗ · pubmed ↗
- 7M. J. Koury and V. H. Haase , “Anaemia in Kidney Disease: Harnessing Hypoxia Responses for Therapy,” Nature Reviews. Nephrology 11, no. 7 (2015): 394–410.26055355 10.1038/nrneph.2015.82PMC 4497972 · doi ↗ · pubmed ↗
- 8T. Ganz and E. Nemeth , “Iron Balance and the Role of Hepcidin in Chronic Kidney Disease,” Seminars in Nephrology 36, no. 2 (2016): 87–93.27236128 10.1016/j.semnephrol.2016.02.001PMC 4884601 · doi ↗ · pubmed ↗