Bayesian predictive model of Ebola fatality: Tenth Ebola epidemic in the Democratic Republic of the Congo
John Kamwina Kebela, Prince Kimpanga, Jean Nyandwe Kyloka, Godefroid Musema, Rostin Mabela, Radjabu Bigrimana, Olivier Mangapi, Berthe Barhayiga, Etienne Bwira Mwokozi, Simon Ntumba, Jack Kokolomami, Sylvain Munyanga Mukongo

TL;DR
This study developed a Bayesian model to predict Ebola mortality based on clinical signs, showing high accuracy in hypothetical cases from the 10th Ebola outbreak in the Democratic Republic of the Congo.
Contribution
A novel Bayesian prognostic model for predicting Ebola mortality using clinical indicators and expert assessments.
Findings
Five clinical factors strongly associated with mortality: deterioration in general condition, hemorrhagic syndrome, neurological disorders, dehydration, and high viral load.
The model achieved high performance metrics (97.4% sensitivity, 100% specificity) in predicting fatal outcomes.
Bleeding syndrome, neurological disorders, and dehydration were the most accurate predictors, correctly identifying 83% of fatal cases.
Abstract
This study aimed to identify the clinical signs and symptoms most associated with fatal outcomes in Ebola virus disease (EVD) using a Bayesian framework. The goal was to develop a prognostic model capable of predicting mortality in EVD patients treated in Ebola Treatment Centres (ETCs) based on observed clinical indicators. A retrospective expert-based study of the 10th Ebola outbreak was conducted to identify key mortality factors using hypothetical cases in the Democratic Republic of the Congo. Clinical experts assessed mortality predictors in Ebola cases using Bayesian methods to estimate likelihood ratios and post-test probabilities, with analyses conducted in Excel and SPSS. Eight clinical factors were identified as potential predictors of poor outcomes in Ebola virus disease. Five showed strong associations with mortality: deterioration in general condition and comorbidity,…
Genes, proteins, chemicals, diseases, species, mutations and cell lines named across the full text — each resolved to its canonical identifier and authoritative record.
Click any figure to enlarge with its caption.
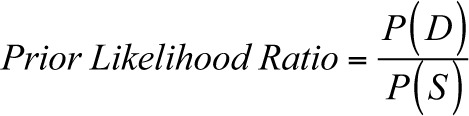 Figure 1
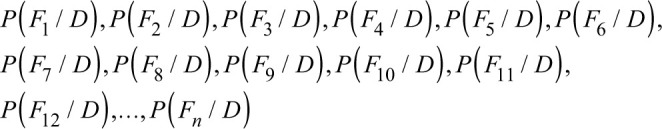 Figure 2
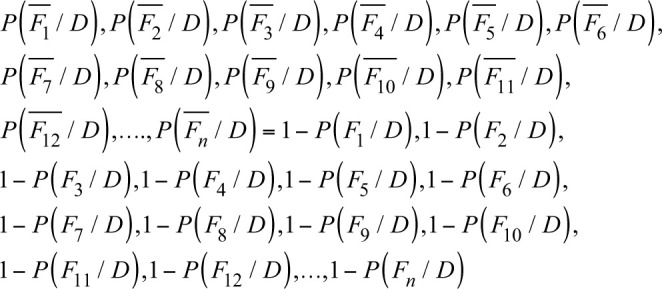 Figure 3
 Figure 4
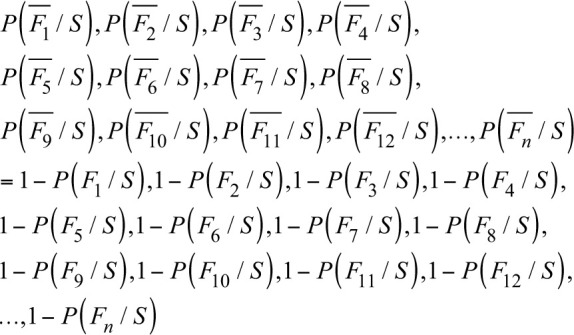 Figure 5
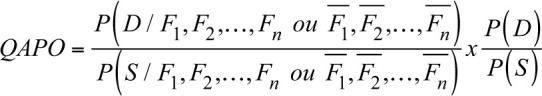 Figure 6
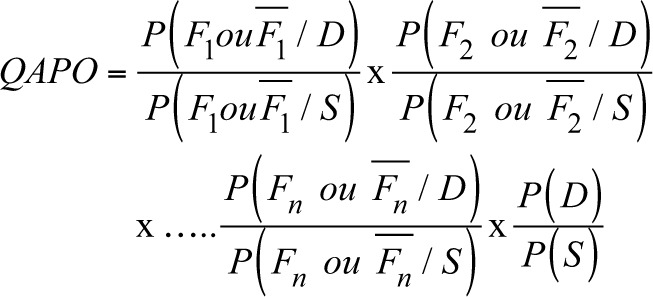 Figure 7
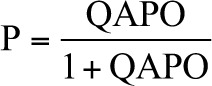 Figure 8
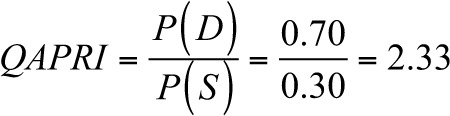 Figure 9
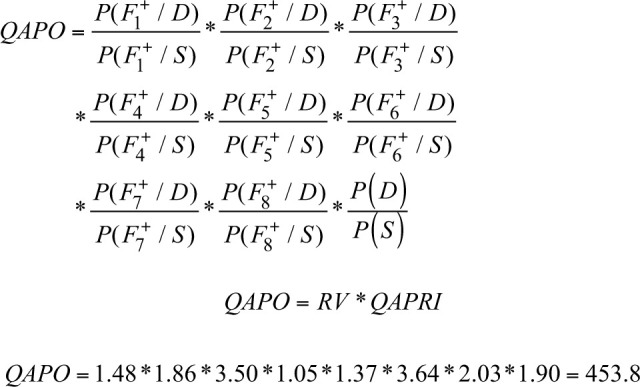 Figure 10
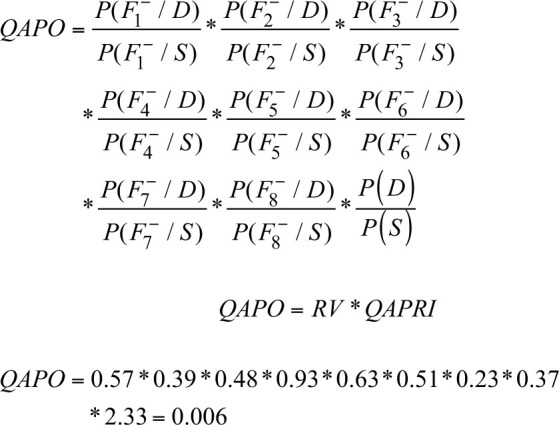 Figure 11
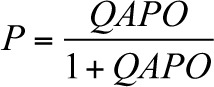 Figure 12
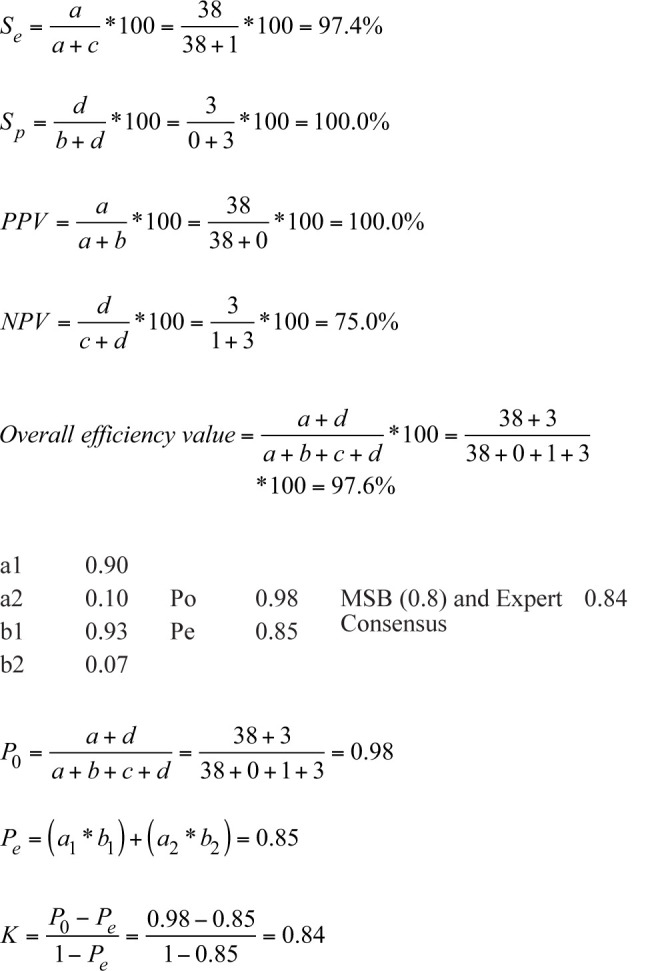 Figure 13
| Order | Year | Dates | Main outbreak areas | Strain | Deaths | Mortality rate (%) | Duration (days) |
|---|---|---|---|---|---|---|---|
| 1st | 1976 | August–November | Yambuku, Equateur | EBOV | 280 | 88 | - |
| 2nd | 1977 | May–June | Tandala, Equateur | EBOV | 1 | 100 | - |
| 3rd | 1995 | May–June | Kikwit, Bandundu, Kwuilu | EBOV | 250 | 79 | - |
| 4th | 2007 | August–November | Mweka, Kasai-Occidental/Central | EBOV | 187 | 71 | - |
| 5th | 2009 | December 2008 – February | Mweka, Kaluamba, Kasai-Occidental | EBOV | 15 | 47 | - |
| 6th | 2012 | June–November | Isiro, Oriental Province | EBOV | 36 | 47 | - |
| 7th | 2014 | August–November | Djera, Boende, Tshuapa | EBOV | 49 | 74 | - |
| 8th | 2015 | May–July | Likati, Orientale, Bas Uélé | EBOV | 4 | 50 | - |
| 9th | 2018 | 08 May – 24 July | Wangata, Bikoro, Equateur | EBOV | 33 | 61 | 78 |
| 10th | 2020 | 01 August and 18–25 June | North‒South, South Kivu and Ituri | EBOV | 2280 | 66 | 695 |
| 11th | 2020 | 01 June – 18 November | Mbandaka, Equateur | EBOV | 55 | 42 | 172 |
| 12th | 2021 | 07 February – 03 May | Biena, Butembo, North Kivu | EBOV | 6 | 50 | 86 |
| 13th | 2021 | 08 October – 16 October | Beni, North Kivu | EBOV | 9 | 82 | 100 |
| 14th | 2022 | 23 April – 04 July | Mbandaka, Equateur | EBOV | 5 | 100 | 73 |
| 15th | 2022 | 21 August – 27 October | Beni, North Kivu | EBOV | 1 | 100 | 53 |
| Number | Factors (signs/symptoms) and/or patient dying of Ebola | Grouping of factors (into independent and mutually exclusive elements) | Operational definition |
|---|---|---|---|
| 1 | Persistent fever |
Fever over 38 °C Uncontrolled fever | Any person with a body temperature > 37 °C |
| 2 | Alteration of general condition and comorbidity |
Physical asthenia General fatigue State of prostration Altered general condition Malnutrition Late arrival Hypertension Dyspnoea Not vaccinated against Ebola Medical history Age under 5 years and/or over 45 years Rash |
Any person with an altered general condition Any person with a major morbidity in their medical history |
| 3 | Bleeding syndrome |
Bleeding and altered consciousness Redness of the eyes External haemorrhage Haematemesis Melena Haemorrhage Permanent bleeding Anaemia Decompensated anaemia | Any person presenting with a set of signs and symptoms and biological manifestations related to bleeding at a particular site |
| 4 | Pain syndrome |
Joint pain Chest pain Muscle pain Sore throat Headache Myalgia Arthritis | Any patient reporting localised or generalised pain |
| 5 | Digestive signs |
Diarrhoea Vomiting Anorexia Abdominal problems Abdominal pain Hiccups | Any patient with at least one sign of digestive system damage |
| 6 | Neurological disorders |
Coma Unconsciousness Psychosis Convulsions Neurological disorders Aggression Loss of vision | All signs and symptoms indicating damage to the nervous system |
| 7 | Biological alteration and dehydration |
Jaundice Impaired liver balance Biological state disturbed between Dx and follow-up (haematological factors, biochemical factors, protein factors, etc.) Hyperglycaemia Impaired renal function Dehydration | Any biological alteration noted in the laboratory and reported |
| 8 | High viral load and/or detection threshold at the time of diagnosis |
High viral load and/or detection threshold at diagnosis | Any sample with a positive test result in which the viral specimen has been quantified by a quantitative method |
| Expert | 1 | 2 | 3 | 4 | 5 | 6 | 7 | Sum |
| Average |
|---|---|---|---|---|---|---|---|---|---|---|
| P(D) | 0.7 | 0.7 | 0.7 | 0.5 | 0.7 | 0.8 | 0.8 | 4.9 | 7 | 0.70 |
| P(S) | 0.3 | 0.3 | 0.3 | 0.5 | 0.3 | 0.2 | 0.2 | 2.1 | 7 | 0.30 |
| Probability of dying given factor present or not | Exp1 | Exp2 | Exp3 | Exp4 | Exp5 | Exp6 | Exp7 | S | N | M | Probability of surviving given factor present or not | Exp1 | Exp2 | Exp3 | Exp4 | Exp5 | Exp6 | Exp7 | S | N | M | LR | Impact |
|---|---|---|---|---|---|---|---|---|---|---|---|---|---|---|---|---|---|---|---|---|---|---|---|
|
|
| ||||||||||||||||||||||
| P (F1 +/D) | 0.8 | 0.7 | 0.8 | 0.5 | 1 | 0.6 | 0.5 | 4.9 | 7 | 0.70 | P (F1 +/S) | 0.8 | 0.1 | 0.2 | 0.5 | 1 | 0.4 | 0.3 | 3.3 | 7 | 0.47 | 1.48 | + |
| P (F2 +/D) | 0.9 | 0.9 | 0.5 | 0.7 | 1 | 0.6 | 0.8 | 5.4 | 7 | 0.77 | P (F2 +/S) | 0.1 | 0.2 | 0.5 | 0.3 | 0.8 | 0.4 | 0.6 | 2.9 | 7 | 0.41 | 1.86 | + |
| P (F3 +/D) | 0.3 | 0.5 | 0.8 | 0.9 | 0.6 | 0.8 | 0.3 | 4.2 | 7 | 0.60 | P (F3 +/S) | 0.3 | 0.1 | 0.2 | 0.1 | 0.1 | 0.2 | 0.2 | 1.2 | 7 | 0.17 | 3.50 | + |
| P (F4 +/D) | 1 | 0.8 | 0.2 | 0.5 | 0.9 | 0.3 | 0.8 | 4.5 | 7 | 0.64 | P (F4 +/S) | 0.6 | 0.2 | 0.7 | 0.5 | 0.8 | 0.7 | 0.8 | 4.3 | 7 | 0.61 | 1.05 | + |
| P (F5 +/D) | 0.8 | 0.7 | 0.7 | 0.7 | 0.8 | 0.3 | 0.8 | 4.8 | 7 | 0.69 | P (F5 +/S) | 0.7 | 0.2 | 0.3 | 0.3 | 0.6 | 0.7 | 0.7 | 3.5 | 7 | 0.50 | 1.37 | + |
| P (F6 +/D) | 0.7 | 0.5 | 0.8 | 0.8 | 0.2 | 0.8 | 0.2 | 4.0 | 7 | 0.57 | P (F6 +/S) | 0.2 | 0.1 | 0.2 | 0.2 | 0.0 | 0.2 | 0.2 | 1.1 | 7 | 0.16 | 3.64 | + |
| P (F7 +/D) | 0.8 | 0.8 | 0.9 | 0.9 | 1 | 0.7 | 1 | 6.1 | 7 | 0.87 | P (F7 +/S) | 0.7 | 0.2 | 0.1 | 0.1 | 0.7 | 0.3 | 0.9 | 3.0 | 7 | 0.43 | 2.03 | + |
| P (F8 +/D) | 1 | 0.7 | 0.9 | 0.7 | 0.7 | 0.5 | 1 | 5.5 | 7 | 0.79 | P (F8 +/S) | 0.4 | 0.3 | 0.1 | 0.3 | 0.3 | 0.5 | 1 | 2.9 | 7 | 0.41 | 1.90 | + |
| P (F1 −/D) | 0.2 | 0.3 | 0.2 | 0.5 | 0.0 | 0.4 | 0.5 | 2.1 | 7 | 0.30 | P (F1 −/S) | 0.2 | 0.9 | 0.8 | 0.5 | 0.0 | 0.6 | 0.7 | 3.7 | 7 | 0.53 | 0.57 | − |
| P (F2 −/D) | 0.1 | 0.1 | 0.5 | 0.3 | 0.0 | 0.4 | 0.2 | 1.6 | 7 | 0.23 | P (F2 −/S) | 0.9 | 0.8 | 0.5 | 0.7 | 0.2 | 0.6 | 0.4 | 4.1 | 7 | 0.59 | 0.39 | − |
| P (F3 −/D) | 0.7 | 0.5 | 0.2 | 0.1 | 0.4 | 0.2 | 0.7 | 2.8 | 7 | 0.40 | P (F3 −/S) | 0.7 | 0.9 | 0.8 | 0.9 | 0.9 | 0.8 | 0.8 | 5.8 | 7 | 0.83 | 0.48 | − |
| P (F4 −/D) | 0.0 | 0.2 | 0.8 | 0.5 | 0.1 | 0.7 | 0.2 | 2.5 | 7 | 0.36 | P (F4 −/S) | 0.4 | 0.8 | 0.3 | 0.5 | 0.2 | 0.3 | 0.2 | 2.7 | 7 | 0.39 | 0.93 | − |
| P (F5 −/D) | 0.2 | 0.3 | 0.3 | 0.3 | 0.2 | 0.7 | 0.2 | 2.2 | 7 | 0.31 | P (F5 −/S) | 0.3 | 0.8 | 0.7 | 0.7 | 0.4 | 0.3 | 0.3 | 3.5 | 7 | 0.50 | 0.63 | − |
| P (F6 −/D) | 0.3 | 0.5 | 0.2 | 0.2 | 0.8 | 0.2 | 0.8 | 3.0 | 7 | 0.43 | P (F6 −/S) | 0.8 | 0.9 | 0.8 | 0.8 | 1 | 0.8 | 0.8 | 5.9 | 7 | 0.84 | 0.51 | − |
| P (F7 −/D) | 0.2 | 0.2 | 0.1 | 0.1 | 0.0 | 0.3 | 0.0 | 0.9 | 7 | 0.13 | P (F7 −/S) | 0.3 | 0.8 | 0.9 | 0.9 | 0.3 | 0.7 | 0.1 | 4.0 | 7 | 0.57 | 0.23 | − |
| P (F8 −/D) | 0.0 | 0.3 | 0.1 | 0.3 | 0.3 | 0.5 | 0.0 | 1.5 | 7 | 0.21 | P (F8 −/S) | 0.6 | 0.7 | 0.9 | 0.7 | 0.7 | 0.5 | 0.0 | 4.1 | 7 | 0.59 | 0.37 | − |
| Case | EVD risk factors | LR | QAPRI | QAPO | Probability of death from EVD | As % of |
|---|---|---|---|---|---|---|
| 1 | F1,F2,F3,F4,F5,F6,F7,F8 | 194.76 | 2.33 | 453.8 | 0.998 | 99.8 |
| 2 | F1,F2,F3,F4,F5,F6,F7 | 37.57 | 2.33 | 87.5 | 0.989 | 98.9 |
| 3 | F1,F2,F3,F4,F5,F76,F8 | 13.55 | 2.33 | 31.6 | 0.969 | 96.9 |
| 4 | F1,F2,F3,F4,F5,F7,F8 | 27.23 | 2.33 | 63.5 | 0.984 | 98.4 |
| 5 | F1,F2,F3,F6,F7,F8 | 78.98 | 2.33 | 184.0 | 0.995 | 99.5 |
| 6 | F1,F2,F5,F6,F7,F8 | 23.77 | 2.33 | 55.4 | 0.982 | 98.2 |
| 7 | F1,F4,F5,F6,F7,F8 | 5.63 | 2.33 | 13.1 | 0.929 | 92.9 |
| 8 | F2,F3,F4,F5,F6,F7 | 14.36 | 2.33 | 33.5 | 0.971 | 97.1 |
| 9 | F3,F6,F7 | 1.22 | 2.33 | 2.24 | 0.740 | 74.0 |
| 10 | F1,F2,F4,F5,F8 | 0.42 | 2.33 | 1.0 | 0.492 | 49.2 |
| 11 | F1,F2,F3,F6 | 1.69 | 2.33 | 3.9 | 0.797 | 79.7 |
| 12 | F4,F5,F7 | 0.06 | 2.33 | 0.1 | 0.119 | 11.9 |
| 13 | F1,F2,F6 | 0.23 | 2.33 | 0.5 | 0.351 | 35.1 |
| 14 | F1,F2,F3 | 0.24 | 2.33 | 0.5 | 0.355 | 35.5 |
| 15 | All factors absent | 0.00 | 2.33 | 0.0 | 0.006 | 0.6 |
| Cut-off point | a | b | c | d | Total |
|
| PPV | NPV | EVG |
|---|---|---|---|---|---|---|---|---|---|---|
| 0.1 | 42 | 0 | 0 | 0 | 42 | 100.0 | #DIV/0! | 100.0 | #DIV/0! | 100.0 |
| 0.2 | 42 | 0 | 0 | 0 | 42 | 100.0 | #DIV/0! | 100.0 | #DIV/0! | 100.0 |
| 0.3 | 40 | 2 | 0 | 0 | 42 | 100.0 | 0.0 | 95.2 | #DIV/0! | 95.2 |
| 0.4 | 38 | 0 | 1 | 3 | 42 | 97.4 | 100.0 | 100.0 | 75.0 | 97.6 |
| 0.5 | 29 | 0 | 10 | 3 | 42 | 74.4 | 100.0 | 100.0 | 23.1 | 76.2 |
| 0.6 | 24 | 0 | 8 | 10 | 42 | 75.0 | 100.0 | 100.0 | 55.6 | 81.0 |
| 0.7 | 20 | 0 | 7 | 15 | 42 | 74.1 | 100.0 | 100.0 | 68.2 | 83.3 |
| 0.8 | 14 | 1 | 6 | 21 | 42 | 70.0 | 95.5 | 93.3 | 77.8 | 83.3 |
| 0.9 | 8 | 1 | 5 | 28 | 42 | 61.5 | 96.6 | 88.9 | 84.8 | 85.7 |
| Kappa | Intra- and interexpert agreement for EVD mortality | ||||||
|---|---|---|---|---|---|---|---|
| E1 | E2 | E3 | E4 | E5 | E6 | E7 | |
| E1 | 0.39 | - | - | - | - | - | - |
| E2 |
|
| - | - | - | - | - |
| E3 |
| 0.32 |
| - | - | - | - |
| E4 | 0.39 |
| 0.28 |
| - | - | - |
| E5 | 0.33 |
| 0.22 |
|
| - | - |
| E6 | 0.39 |
| 0.28 |
|
|
| - |
| E7 |
|
| 0.34 |
|
|
|
|
| SBM | Mortality from EVD (Hypothetical cases) | Expert consensus (0.4) | Total | |
|---|---|---|---|---|
| Deaths | Survival | |||
| 0.4 | Death | 38 | 0 | 38 |
| Survival | 1 | 3 | 4 | |
|
| ||||
|
|
|
|
|
|
Peer Reviews
No public reviews on file for this paper yet. If you reviewed it on a platform where reviews are public (OpenReview, ICLR, NeurIPS, ICML), you can paste yours below so the community can read it here.
Videos
No videos yet. Explain this paper in a talk, walkthrough, or lecture? Add one.
Taxonomy
TopicsViral Infections and Outbreaks Research · Disaster Response and Management · Mosquito-borne diseases and control
Introduction
The Ebola virus (EBOV) causes acute and severe disease. This virus was first identified in 1976 during two simultaneous outbreaks in South Sudan and the Democratic Republic of the Congo (DRC).^1^ Ebola virus is very often fatal in humans, with high case fatality rates ranging from 25% to 90%.^1^ However, as of July 2015, 27 741 cases of Ebola virus disease (EVD) and 11 284 deaths were reported in West Africa, particularly in Guinea, Liberia and Sierra Leone.^2^ In 2014, a total of 162 (7.3%) individuals with confirmed or probable EVD among 2210 health workers with more or less than 15 years of professional experience died during the epidemic in Guinea.^3^
The tenth EVD epidemic in the DRC (in the provinces of North Kivu and Ituri) was the second most deadly epidemic (2280 deaths [case fatality rate of 66%]) after the epidemic in West Africa in 2014 (2196 deaths and 1075 cured patients reported by December 2019).^4,5^
Since the emergence of EVD, its case fatality rate has remained alarmingly high. Therefore, identifying signs or symptoms that worsen a patient’s condition and may lead to a fatal outcome is essential for improving clinical management. In this study, we aim to determine which clinical characteristics observable in Ebola Treatment Centres (ETCs) (signs, symptoms and biological variables) can effectively predict fatal outcomes in patients with EVD. Early detection of aggravating factors is crucial for optimising patient care in these settings. To address this research question, we will employ a Bayesian approach to identify predictors of mortality.
Mark J. Siedner and Lawrence highlighted that large-scale threats posed by EVD mainly occur in countries with weak public health systems^6^; the DRC is no exception; the country consistently records high case fatality rates during every Ebola outbreak (see Table 1)^7^.
Numerous researchers have conducted investigations to identify risk factors that may worsen the health status of patients affected by Ebola.^8,9,10,11,12,13,14,15,16,17,18^ These studies uniformly employed frequentist statistical methods and were limited to data derived from a single source, namely, one ETC, thus preventing the integration of new data from other treatment sites or from subsequent outbreaks. In contrast, a Bayesian approach offers notable advantages: it is more flexible, allows the incorporation of prior knowledge and facilitates better control of errors, particularly in the context of clinical research. By enabling the continual updating of predictive models as new data become available, Bayesian methods are particularly suited for responding to emerging threats like Ebola epidemics.
At present, Bayesian methods hold a prominent position in specialised biostatistics publications, and their adoption is gradually expanding within the epidemiological literature.^19^
The outcomes of patients with EVD are uncertain; therefore, the Bayesian approach is ideal in this context because it integrates the subjective and objective aspects of the phenomena to be studied. Table 1 shows the mortality of EVD from the first case to date in the DRC.
Research methods and design
Study design
This was a retrospective cross-sectional study in which the opinions of Ebola experts on Ebola management in the ETC were collected during the tenth epidemic.
The experts in EVD management listed 50 factors that affect the severity of EVD. Through consensus, they grouped the various factors cited into eight key independent factors influencing EVD mortality. The elements, grouped into exclusively independent factors, are shown in Table 2.
In this study, the inclusion criteria were applied to all Ebola management experts who agreed to be available throughout the study period and who had worked at an ETC in West Africa between 2014 and 2015 and/or in the DRC between 2018 and 2020.
Data collection
We used a paper questionnaire to collect data on the opinions of the Ebola management experts.
Data entry
The experts’ opinions on the 42 hypothetical patient cases in the ETC were entered into Microsoft^®^ Excel. Consensus data were also entered using the same software.
Data analysis
Microsoft Excel was used to programme all the Bayes mathematical modelling formulae, calculate kappa statistics to measure the concordance of opinions between experts and evaluate the model according to the following parameters: sensitivity (Se), specificity (Sp), positive predictive value (PPV), negative predictive value (NPV), overall effectiveness (EVG) and the likelihood ratio (LR).
Bayes model for predicting mortality
The Bayesian prediction model is grounded in a probabilistic framework that integrates prior knowledge with observed data to estimate the likelihood of future events. In the context of predicting mortality associated with EVD, this model facilitates the assessment of risk factors by synthesising available information.
In this study, available data will be collected from experts involved in the clinical management of patients with EVD.
The selected experts were chosen based on their years of experience and involvement in Ebola response efforts. They were drawn from the Ministry of Public Health, Hygiene and Prevention, specifically the Epidemiological Surveillance Division, as well as from the National Biomedical Research Institute, Africa Centres for Disease Control and Prevention (CDC) and the World Health Organization (WHO).
Seven experts participated in this study. With respect to the experts’ opinions, between 3 and 6 experts for a simple model and between 7 and 12 experts for a complex or interdisciplinary model are recommended for Bayesian statistics to ensure diverse opinions. The following steps were taken to develop this mortality model:
Expert panel on Ebola case management
To ensure the validity and relevance of our Bayesian prediction model for Ebola mortality, experts were selected based on the following criteria:
Professional Qualifications: Medical Doctor, Nurse.Professional Experience: Minimum of 5 years in managing cases of EVD.Research Participation: Contributed to at least two relevant or similar scientific studies.Availability: Commitment to active participation throughout all phases of the study, including model development and validation.
Additionally, an extra criterion was introduced:
Epidemic Response Experience: Active involvement in the Ebola response in Guinea (2014–2016) and in the provinces of North Kivu, South Kivu and Ituri in the DRC (2018–2020), specifically in clinical management activities.
These criteria were established in accordance with recommendations from the WHO and the CDC, emphasising the importance of technical expertise, familiarity with study objectives and effective communication skills in selecting experts for epidemic response missions.
Expert interviews and capacity building in Bayesian statistics
The experts selected for the development of the model were interviewed individually. Each presented their curriculum vitae highlighting their experience in the management of the Ebola epidemic. Following this step, the objectives, scientific relevance and methodology of the study were explained, including a simplified overview of the Bayesian approach.
An individual questionnaire was then administered to identify a provisional list of factors associated with EBOV-related mortality. This questionnaire pursued two main objectives, namely to:
Confirm and retain, among the preselected candidates, those who met the participation criteria.Collect preliminary elements necessary for the development of the model.
In practice, each interview was structured around three key components:
Presentation of the expert’s identity, qualifications, current role and professional experience.Briefing on the objectives and methodology of the study.Clarification of the operational definitions of the factors associated with EBOV-related mortality in North Kivu, South Kivu and Ituri provinces.
Finally, an official invitation letter, signed by the Dean of the Faculty of Medicine of the University of Kinshasa, was sent to the experts to formalise their participation in the study.
Development of a comprehensive list of factors associated with Ebola virus disease severity
The provisional list of factors generated from the expert interviews was used to establish the final list of variables. Experts then proceeded to define the operational parameters for each independent factor. Subsequently, the factors were organised into groups of independent and mutually exclusive variables.
Calculation of the prior probability quotient
To determine the prior LR, the following question was posed to obtain the a priori probability (QAPRI) of mortality:
Among 10 individuals who died from laboratory-confirmed Ebola virus disease, how many exhibited the clinical factors/signs/symptoms included in the grouping?
To obtain the complementary probability, a second question was asked:
Among 10 individuals who died from laboratory-confirmed Ebola virus disease, how many did not present the clinical factors/signs/symptoms included in the grouping?
Based on these questions, the probability of actual death because of EVD (P(D)) for a patient admitted to the ETC with the specified signs or symptoms, as well as the probability of survival (P(S)) given the presence of these signs or symptoms, was determined.
After calculating the arithmetic mean of the different expert estimates, the a priori Ebola mortality prediction ratio was computed using the following formula (Equation 1):
This approach allowed the integration of expert knowledge with observed clinical patterns to inform a Bayesian predictive model of Ebola mortality.
Estimating the likelihood ratio for each factor with respect to fatal outcomes in Ebola virus disease (likelihood ratio)
To estimate the LR for predicting EVD mortality, experts were asked the following question regarding deceased patients:
Among 10 individuals who died from laboratory-confirmed Ebola virus disease, how many exhibited each of the consensus clinical factors/signs/symptoms: F_1_, F_2_, F_3_, …, F_n_?
From the experts’ responses, the probability of each factor occurring given death (P(Fi|D)) was calculated (Equation 2):
The complementary probabilities of not having the factors given death were computed as (Equation 3):
Similarly, to account for survival, experts were asked:
Among 10 individuals who survived Ebola virus disease, how many exhibited each of the consensus clinical factors/signs/symptoms: F_1_, F_2_, F_3_, …, F_n_?
This allowed calculation of the probabilities of each factor occurring given survival (P(Fi|S)) (Equation 4):
And the complementary probabilities of not having the factors given survival were derived as (Equation 5):
The arithmetic means of the expert estimates were then used to compute the LR for each factor, summarised in a table (see Table 4). The interpretation of the LR values is as follows:
LR > 1: The factor increases the probability of EVD mortality and has a significant positive impact on predicting death.LR < 1: The factor decreases the probability of EVD mortality and has a non-significant or protective effect.LR = 0: The factor is neutral; no conclusion can be drawn regarding its effect.
Calculation of the posterior probability quotient
Using the QAPRI of mortality and the LRs for each factor, the QAPO for predicting EVD mortality was calculated.
For the prediction of EVD mortality, the QAPO is computed as (Equation 6):
Equivalently, this can be expressed as the product of individual factor LRs multiplied by the a priori probability ratio (Equation 7):
Once the QAPO is obtained, the posterior probability for a patient to die from EVD is calculated using the following formula (Equation 8):
This approach allows integration of expert knowledge and observed clinical factors to provide a quantitative prediction of mortality for patients with EVD.
Internal validation of the mortality prediction model
Each expert constructed six hypothetical cases: three in which mortality occurred in the presence of severity factors and three in which mortality occurred in their absence.
We validated the Bayesian predictive model against expert consensus using 42 hypothetical Ebola cases carefully constructed by the experts. Their responses served as the primary reference standard against which model performance was assessed.
Internal validation of the Bayesian model was carried out by comparing the experts’ a priori probability estimates across hypothetical Ebola mortality cases. We then calculated the LR, posterior probability quotients (PPQs) and standard diagnostic performance metrics including Se, Sp, PPV, NPV, overall accuracy and assessed inter-rater agreement using Cohen’s kappa statistic.
Data availability statement
The data available for the development of this predictive model were generated by a group of experts in the clinical management of Ebola during the development of the subjective prognostic model for Ebola patients.
Ethical considerations
Ethical clearance to conduct this study was obtained from the University of Kinshasa School of Public Health Ethics Committee (No. ESP/CE/114B/2025), dated 12 September 2022. Confidentiality was ensured, as the patients’ names were removed from the database, and analyses were conducted anonymously. Informed consent was obtained from each expert to participate in the development of the subjective Ebola mortality model. They were free to agree or refuse to provide their opinion on the EVD case.
Results
Various severity factors listed by the experts in the management of Ebola virus disease
The list of 50 factors (signs and symptoms) indicating the severity of EVD, as cited by the Ebola management experts, is provided in Table 2. These 50 factors are grouped into eight independent factors in Table 2.
Determination of the a priori probability quotient of Ebola mortality
The experts answered the following question: ‘Out of 10 patients with Ebola, what is the probability of dying for a patient who has various symptoms and/or clinical signs?’ The various answers were used to calculate the QAPRI, which is shown in Table 3^20^ (see Equation 9):
The QAPRI value was greater than 1, so the experts’ predictions were that a patient with the EVD factors listed above is more likely to die than to survive.
Determination of the likelihood ratio according to each factor related to Ebola mortality
Each expert predicted the probability of death in a patient with biologically confirmed EVD according to each individual factor. This prediction was used to determine the LR of each factor for predicting mortality. The results in Table 4 indicate that all eight factors in the LR table have a significantly positive effect on EVD mortality (LR > 1).
On the basis of the data shown in Table 4, we used the different LRs and a priori probabilities from Table 2 to calculate the corresponding a posteriori probabilities, as shown in Table 5.
The table presenting all combinations of Ebola severity factors is provided in Table 1-A1. A total of 248 combinations were identified.
We used the following formulae to determine the PPQ with all eight mortality-related severity factors present in a patient (Equation 10):
The same formula was used to determine the PPQ with all eight mortality-related severity factors absent in a patient (Equation 11):
Determining the probability of mortality with signs or symptoms related to Ebola virus disease severity
Given the QAPO findings, we calculated the different probabilities of mortality with the different factors (signs and symptoms) related to the severity of EVD using the following formula (Equation 12):
Generally, as shown in this Table 5, when the number of factors increases, the probability of mortality also increases. However, certain factors, even in small numbers, increase the probability of mortality. This is the case for one combination of factors: F3, haemorrhagic syndrome; F6, neurological disorders and F7, biological alteration and dehydration. Moreover, when a patient presents with all eight factors, the chance of survival is close to zero. A total of 248 combinations of predictive factors for Ebola severity were identified. Among these, one combination of eight factors, four combinations of seven factors and two combinations of six factors each yielded mortality predictions ≥ 99.0%. Notably, any combination that included factor F6 was consistently associated with a markedly high probability of mortality (Table 1-A1). The complete set of factor combinations is presented in Table 1-A1.
Evaluation of the Ebola virus disease mortality prediction model
This model was evaluated by determining the degree of agreement between and among experts in two rounds, depending on the answer to the following question: ‘Out of 6 patients that you know of with different EVD-related factors, how many died?’ The ‘cut-off point’ discrimination criterion was determined to evaluate the effectiveness of the subjective Bayes model.
Determination of the discrimination criterion for mortality (cut-off point)
For our study, this criterion was defined as the value at which the model simultaneously exhibited both very high Se and Sp. The criterion is given by a value between 0.1 and 0.9. Table 6 was constructed for each value between 0.1 and 0.9.
The highest values for both Se and Sp were obtained at the 0.4 cut-off point, which was chosen for the internal validation of our model, enabling us to compare subjective Bayesian model (SBM) with the expert consensus.
Determining the degree of agreement within and between experts
On the basis of the construction of six hypothetical cases by each expert in the first and second rounds and the determination of a consensus on 42 hypothetical cases generated by all the experts, we used the kappa statistic to analyse these results (cut-off point of 0.4).
The results obtained in relation to intraexpert approval showed that six out of seven experts had an acceptable degree of approval for themselves, as their K values were between 0.4 ≤ K ≤ 75. These values are shown diagonally in Table 7. Regarding interexpert approval, 15 out of 21 approvals, which are shown below the diagonal values, were acceptable.
Given that the majority of experts had an acceptable degree of agreement, we considered the group to be a single person, and we used the arithmetic mean of their estimates to represent agreement to evaluate the Bayes model.
Internal validation of the mortality prediction model
The internal validation of the mortality prediction model was performed by calculating the following validation parameters: Se, Sp, PPV, NPV, overall efficacy value and the kappa statistic. The data used for these different calculations came from the comparison of the subjective Bayes model and the expert consensus on hypothetical cases (Table 8).
Model performance parameter calculations (Equation 13):
The internal validity of the subjective Bayes model for predicting Ebola mortality was established, with a K value of 0.84. The experts’ agreement among themselves on the Ebola severity factors (EVM signs/symptoms) was almost perfect because it was between 0.81 and 1.00.
Discussion
Knowledge of the factors that worsen the health status of patients with EVD is essential for good medical management.
Our mortality prediction model highlights eight key factors that are considered to worsen the state of health of a patient with EVD. Among these eight factors, the Bayesian model identified three factors (signs and symptoms) as signs of severe EVD. F3 is among these eight factors: haemorrhagic syndrome (unexplained bleeding, bleeding gums, bleeding from the injection, bloody nose, bloody stools, haematemesis, bloody vomit, bloody cough, bleeding from the vagina, bleeding skin, bloody urine and other bleeding). This result aligns with the findings reported by the WHO Ebola response team in West Africa, as well as those of Aylward et al.,^10^ Barry et al.^17^ and Hunt et al.^16^
F6 is also included among the factors indicating severe EVD: neurological disorders (coma, unconsciousness, psychosis, convulsions, aggression and loss of vision). Some researchers have also identified this factor, such as Qin et al.^14^ and Zhang et al.^15^ In addition to F3 and F6, F7 is also included: biological alteration and dehydration (jaundice, altered liver function, altered biological state between diagnosis and follow-up (haematological factors, biochemical factors, protein factors), hyperglycaemia, altered renal function and dehydration). Some researchers have also identified this factor as a sign of severe EVD. This was the case in the study by Schieffelin et al.,^11^ Hunt et al.^16^ and de La Vega et al.^18^
In her article entitled ‘Predicting Ebola Severity: A Clinical Prioritization Score for Ebola virus disease’, Mary-Anne Hartley prioritised clinical signs and symptoms in patients with fatal outcomes because of EVD.^13^ The eight factors identified through the Bayesian approach were consistently validated by the Mary-Anne scoring method, which relies on clinical data. This concordance highlights the robustness of the Bayesian model and underscores the complementarity of the two approaches in predicting EBV severity.
With respect to the Bayesian approach, the results indicate that if a patient exhibits all eight of the factors identified by management experts, the patient has a 99.8% chance of dying; conversely, if all eight factors are absent, the patient has a 0.6% chance of dying.
Among the eight factors listed by the experts, the Bayesian model identified three factors with a very high impact on calculating the probability of death. These factors include F3 (haemorrhagic syndrome), F6 (neurological disorders) and F7 (biological alterations and dehydration). The elements of F3, F6 and F7 are shown in Table 5. Apart from these three factors, with an LR well above 1, F8 (High viral load) and F2 (alteration of general state and comorbidity) are included, which have an RV close to 2.
When we calculate the probability of a patient dying of Ebola with F3, F6 and F7, the probability of death is 74.0%. However, if we remove F7 and add F1 and F2, that is, combining F1, F2, F3 and F6, the patient will have a 79.7% chance of dying.
According to the scale proposed by Landis and Koch,^20^ given that our K values (0.84) ranged from 0.81 to 1, there was almost perfect agreement between our experts regarding the prediction of mortality as a function of the eight factors listed above.
This study has the limitation of lacking external validation of this Bayesian model using real Ebola death data.
Conclusion
This study highlights the factors influencing the fatal outcome (mortality) of Ebola patients at ETCs. These factors are of vital importance to those providing medical care to patients in ETCs. When providers know the risk factors for death in advance, management is improved by focusing interventions on the harmful factors that can very easily lead to death. Our results, obtained using Bayes’ mathematical model, are similar to those reported by other researchers using different methodological approaches. Our results are more telling because we considered the opinions of experts and internally validated the model using the kappa statistic.
The results of this research will enable ETCs to save more lives during future Ebola epidemics by effectively triaging patients who require intensive care. This model not only predicts mortality but also supports preparedness by guiding upgrades of ETCs and training experts in advanced clinical care. Such measures could improve patient survival and strengthen outbreak response.
Other contributing factors, for example, economic conditions (availability of medical supplies, therapies, …) at ETCs should be discussed as additional factors that could contribute to a patient’s death despite applying the knowledge from the Bayesian model.
The reference list from the paper itself. Each links out to its DOI / PubMed record.
- 1Martinez MJ, Salim AM, Hurtado JC, Kilgore PE. Ebola virus infection: Overview and update on prevention and treatment. Infect Dis Ther. 2015;4(4):365–390. 10.1007/s 40121-015-0079-526363787 PMC 4675769 · doi ↗ · pubmed ↗
- 2Centers for Disease Control and Prevention. Ebola Outbreak History. Atlanta (GA): National Center for Emerging and Zoonotic Infectious Diseases; 2024.
- 3Grinnell M, Dixon MG, Patton M, et al. Ebola virus disease in health care workers – Guinea, 2014. MMWR Morb Mortal Wkly Rep. 2014;64(38):1083–1087. 10.15585/mmwr.mm 6438 a 626421761 · doi ↗ · pubmed ↗
- 4World Health Organization. Ebola virus disease – Democratic Republic of the Congo: Health emergency update [homepage on the Internet]. Geneva: World Health Organization; 2019 [updated 2019 Nov 21]. Available from: https://www.who.int/emergencies/disease-outbreak-news/item/2019-DON 209
- 5Ministry of Health, Democratic Republic of the Congo. Strategic response plan for the Ebola virus disease outbreak in North Kivu and Ituri provinces, Democratic Republic of the Congo (July–December 2019). Kinshasa: Ministry of Health; 2019.
- 6Siedner MJ, Gostin LO, Cranmer HH, Kraemer JD. Strengthening the detection of and early response to public health emergencies: Lessons from the West African Ebola epidemic. P Lo S Med. 2015;12(3):e 1001804. 10.1371/journal.pmed.100180425803303 PMC 4371887 · doi ↗ · pubmed ↗
- 7Judson SD, Munster VJ. The multiple origins of Ebola disease outbreaks. J Infect Dis. 2023;228(Suppl 7):S 465–S 473. 10.1093/infdis/jiad 35237592878 PMC 10651193 · doi ↗ · pubmed ↗
- 8Levine AC, Shetty PP, Burbach R, et al. Derivation and internal validation of the Ebola prediction score for risk stratification of patients with suspected Ebola virus disease. Ann Emerg Med. 2015;66(3):285–293.e 1. 10.1016/j.annemergmed.2015.03.01125845607 · doi ↗ · pubmed ↗