Comparison of postprocessing metrics in multimetabolic APT-weighted CEST and 2-deoxy-D-glucose-CEST-MRI for differentiating breast cancer subtypes in a murine model
Daniela Prinz, Silvester J. Bartsch, Joachim Friske, Martin Krššák, Daniela Laimer-Gruber, Thomas H. Helbich, Katja Pinker

TL;DR
This study compares advanced MRI metrics for identifying breast cancer types in mice, showing that newer methods outperform traditional ones.
Contribution
The paper introduces the use of MTRREX and AREX as superior postprocessing metrics for metabolic CEST-MRI in breast cancer subtyping.
Findings
MTRREX and AREX effectively differentiated Luminal A from HER2+ and triple-negative tumors in APTw-CEST.
AREX distinguished Luminal A from HER2+ tumors in 2-deoxy-D-glucose-CEST.
MTRasym failed to separate tumor subtypes in CEST-MRI.
Abstract
Chemical exchange saturation transfer (CEST)-magnetic resonance imaging (MRI), particularly amide proton transfer-weighted (APTw)-CEST and 2-deoxy-D-glucose-CEST, holds promise for noninvasive molecular breast cancer (BC) characterization. However, quantification remains challenging due to field inhomogeneities, overlapping exchange pools, and the limited robustness of conventional metrics such as the magnetization transfer ratio asymmetry (MTRasym). This study evaluates four CEST postprocessing metrics—MTRasym, Lorentzian amplitudes, MTR relaxation exchange (MTRREX), and apparent exchange-dependent relaxation (AREX)—for their diagnostic performance in differentiating BC subtypes using endogenous APTw-CEST and exogenous 2-deoxy-D-glucose-CEST in a murine BC xenograft model of Luminal A, human epidermal growth factor receptor 2 (HER2)+, and triple-negative tumors. Metabolic CEST-MRI was…
Genes, proteins, chemicals, diseases, species, mutations and cell lines named across the full text — each resolved to its canonical identifier and authoritative record.
Click any figure to enlarge with its caption.
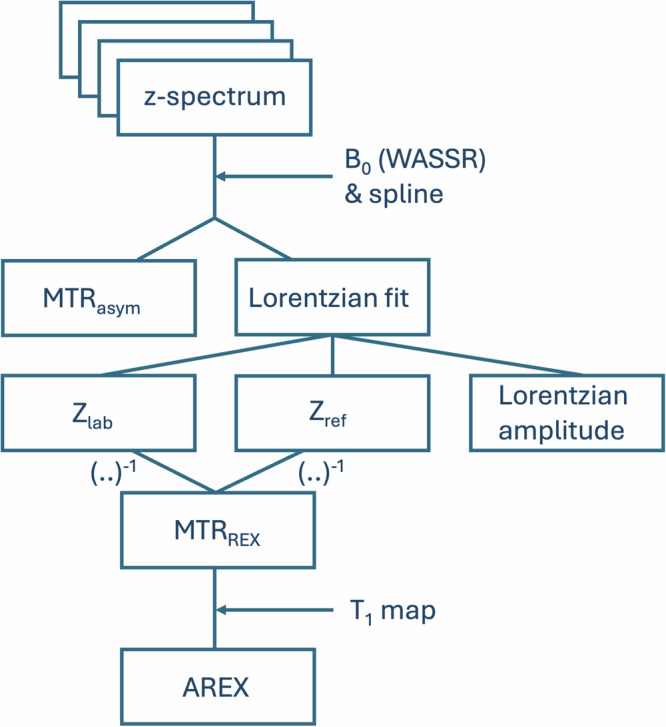 Figure 1
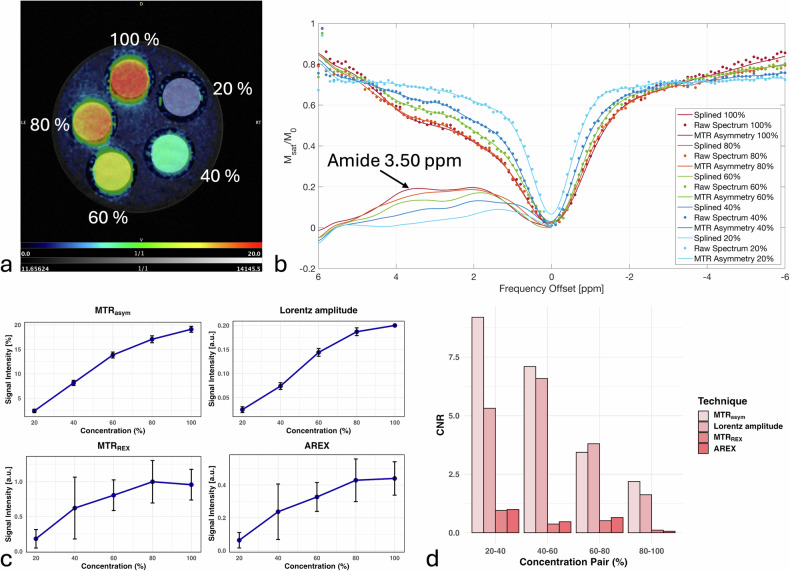 Figure 2
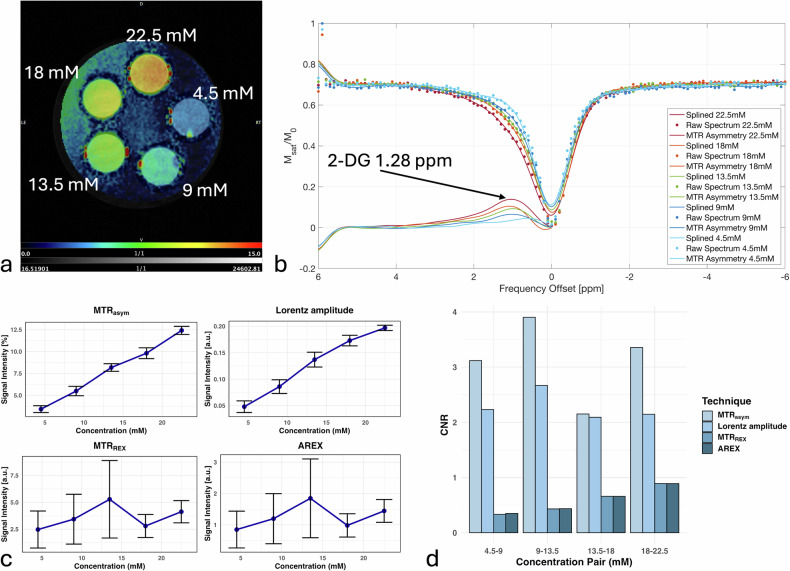 Figure 3
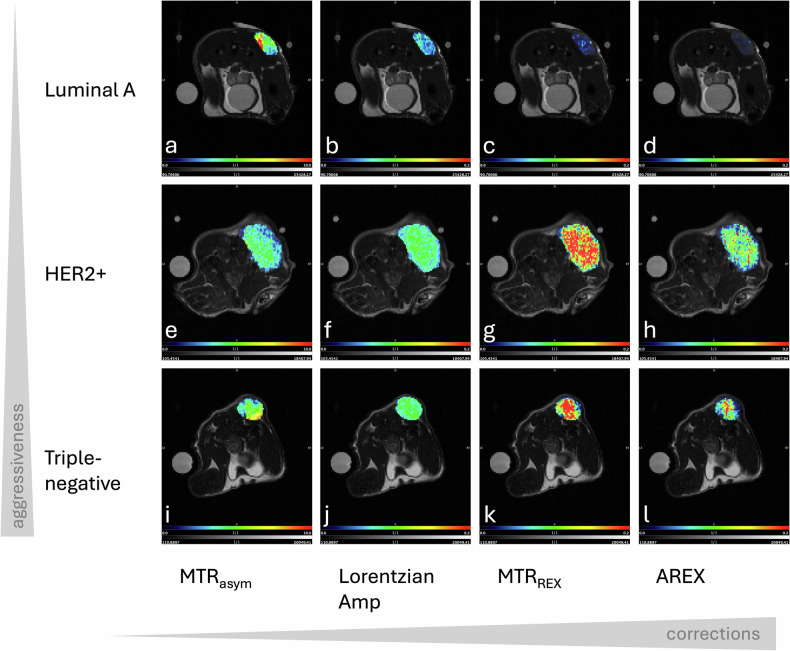 Figure 4
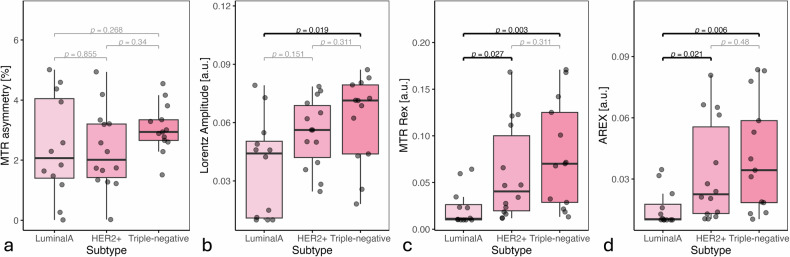 Figure 5
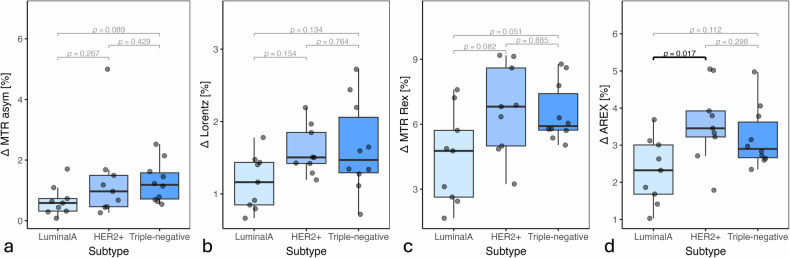 Figure 6
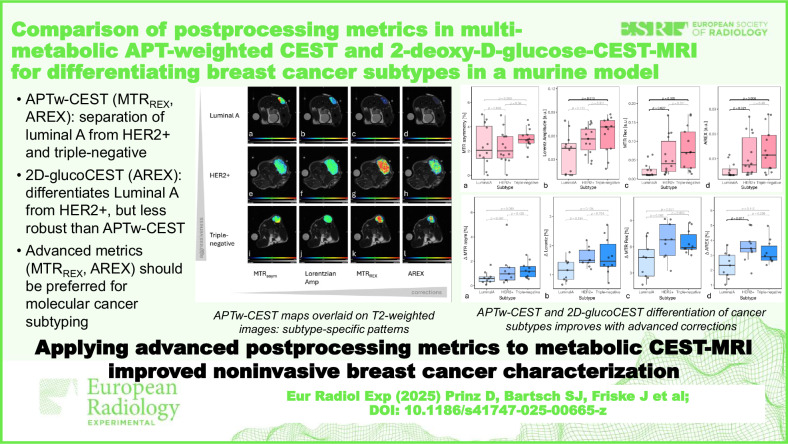 Figure 7
- —http://dx.doi.org/10.13039/501100001821Vienna Science and Technology Fund
Peer Reviews
No public reviews on file for this paper yet. If you reviewed it on a platform where reviews are public (OpenReview, ICLR, NeurIPS, ICML), you can paste yours below so the community can read it here.
Videos
No videos yet. Explain this paper in a talk, walkthrough, or lecture? Add one.
Taxonomy
TopicsLanthanide and Transition Metal Complexes · MRI in cancer diagnosis · Magnetism in coordination complexes
Background
Chemical exchange saturation transfer (CEST)-magnetic resonance imaging (MRI) is a noninvasive metabolic imaging technique that relies on the exchange of selectively saturated solute protons with bulk water protons, leading to a detectable reduction in the water signal [1–3]. CEST-MRI enables imaging of both endogenous and exogenous solutes [4, 5].
Endogenous CEST includes several types, among them amide proton transfer-weighted (APTw)-CEST (-NH_2_) for imaging intracellular proteins and pH, glycoCEST (-OH, -NH) for glycogen, gagCEST for glycosaminoglycans in cartilage (-OH and -NH), and gluCEST (-NH_2_) for glutamate in the brain. Exogenous CEST applications include iopamidol-based acidoCEST for pH imaging (-OH) and glucoCEST to image glucose metabolism (-OH) [6]. For cancer imaging [7–10], the endogenous APTw-CEST [11–16] and glucoCEST [17–23] are promising as they provide insights into cancer biology. APTw-CEST allows imaging of highly proliferating tissues through the elevated signal originating from mobile proteins. Notably, glucoCEST, particularly 2D-glucoCEST using 2-deoxy-D-glucose (2-DG), is of interest as well, as it allows assessment of tumor glucose uptake similar to [^18^F]-fluorodeoxyglucose ([^18^F]FDG)-positron emission tomography (PET). Moreover, 2D-glucoCEST offers a radiation-free alternative with higher spatial resolution.
CEST-MRI implementation and quantification remain challenging due to artifacts arising from field inhomogeneities, sensitivity to motion, spillover from other exchange pools and complex postprocessing [24]. Most often, the CEST spectrum is quantified by applying a simple magnetization transfer ratio asymmetry (MTR_asym_) analysis, which is known to be affected by the intrinsic asymmetry of the spectrum influenced by the nuclear Overhauser effect (NOE). Advanced metrics that rely on Lorentzian fitting have been proposed to improve quantification accuracy [13, 25–31]. While extensively applied in APTw-CEST, their potential in glucoCEST remains largely unexplored. Although clinical APTw-CEST studies in breast cancer (BC) have reported variable absolute values, most indicate higher signals in more aggressive subtypes. Here, we employ advanced quantification metrics to improve specificity beyond conventional MTRasym [32–38].
This study aims to evaluate the performance of advanced CEST postprocessing metrics—originally developed in APTw-CEST—when applied and adapted to accommodate 2D-glucoCEST with a particular focus on distinguishing between three BC molecular subtypes in a well-established xenograft model. To achieve this, four CEST quantification metrics—MTR_asym_, Lorentzian amplitudes, MTR relaxation exchange (MTR_REX_), and apparent exchange-dependent relaxation (AREX)—are applied and compared for both APTw-CEST and 2D-glucoCEST across adjusted phantoms and experimental murine BC xenograft models.
Materials and methods
In vitro experiments
Phantom measurements were performed as a quality control step to assess z-spectra, fit and contrast-to-noise ratio (CNR). APTw-CEST z-spectra were evaluated on egg white + phosphate-buffered saline (PBS) phantoms at five egg white concentrations (20%, 40%, 60%, 80%, 100%) submerged into a vial containing 3% agarose + PBS to improve shimming and reduce vibrations. Egg whites are commonly used for in vitro APTw-CEST measurements [39]. For 2D-glucoCEST assessment, phantoms of 2-DG + PBS at five 2-DG concentrations were produced (4.5 mM, 9 mM, 13.5 mM, 18 mM, 22.5 mM) and submerged in a vial containing 3% agarose + PBS.
In vivo experiments
Animal experiments were conducted in accordance with the Austrian Federal Ministry of Education, Science and Research and the Intramural Committee for Animal Experimentation of the Medical University of Vienna. Experiments complied with the Directive 2010/63/EU and adhered to Animal Research: Reporting of in vivo Experiments (ARRIVE) guidelines [40]. Additional details on animal housing, monitoring procedures, and humane endpoint criteria are provided in the Supplementary Material.
We utilized a well-established BC xenograft model of three different human BC subtypes for all 2D-glucoCEST and APTw-CEST measurements. The three BC cell lines with varying levels of aggressiveness were obtained from the American Type Culture Collection. This included the less aggressive Luminal A (MCF-7) cells, which are estrogen and progesterone hormone receptor positive, the more aggressive human epidermal growth factor receptor 2 (HER2) + SKBR-3 cells (which exhibit amplified and overexpressed HER2/neu while lacking hormone receptors, and contain a TP53 mutation), and the most aggressive triple-negative MDA-MB-231 cells (which lack both hormone receptors and HER2). Cells were grown under standard cell culture conditions (humidified air, 37 °C, 5% CO_2_) according to a protocol previously proposed by Bartsch et al [41]. Luminal A cells were kept in Roswell Park Memorial Institute‒RPMI medium, while HER2+ and triple-negative cells were maintained in Dulbecco’s Modified Eagle Medium‒DMEM, both supplemented with 10% fetal bovine serum.
Female athymic BALB/c-derived nude mice were injected subcutaneously into the right flank with 1 \documentclass[12pt]{minimal} \usepackage{amsmath} \usepackage{wasysym} \usepackage{amsfonts} \usepackage{amssymb} \usepackage{amsbsy} \usepackage{mathrsfs} \usepackage{upgreek} \setlength{\oddsidemargin}{-69pt} \begin{document}$$\times$$\end{document} 10^7^ Luminal A cells (n = 16), 3 \documentclass[12pt]{minimal} \usepackage{amsmath} \usepackage{wasysym} \usepackage{amsfonts} \usepackage{amssymb} \usepackage{amsbsy} \usepackage{mathrsfs} \usepackage{upgreek} \setlength{\oddsidemargin}{-69pt} \begin{document}$$\times$$\end{document} 10^6^ HER2+ cells (n = 17) and 3 \documentclass[12pt]{minimal} \usepackage{amsmath} \usepackage{wasysym} \usepackage{amsfonts} \usepackage{amssymb} \usepackage{amsbsy} \usepackage{mathrsfs} \usepackage{upgreek} \setlength{\oddsidemargin}{-69pt} \begin{document}$$\times$$\end{document} 10^6^ triple-negative cells (n = 25) under constant anesthesia using isoflurane (Zoetis Österreich GmbH). Tumors were allowed to grow for approximately 2 weeks. One week prior to MCF-7 cell inoculation, isoflurane-anesthetized mice were implanted subcutaneously in the neck region with low-dose estrogen pellets (0.36 mg/day, 60-day release, Innovative Research of America) using a 10-G precision trocar [42]. Tumor growth was monitored by regular visual inspection and palpation, with MRI performed either 2‒3 weeks post-inoculation or when tumors approached a maximum diameter of 1 cm. For in vivo MRI measurements, mice were placed into an induction box with 3% isoflurane mixed with medical air to initiate anesthesia. They were then positioned on a heating pad (37 °C) under continued anesthesia through a nose cone. A 30-G needle containing heparinized saline solution (0.9%) with a 10 cm-long catheter was injected into the lateral tail vein. The mice were then transferred into the MRI cradle with continuous anesthesia (0.5‒1.5%) to keep the respiratory rate at 60–80 breaths per minute. Breathing rate was monitored, and body temperature was maintained. The tail vein catheter was connected to a 1-mL syringe mounted to an infusion pump (PHD 2000, Harvard Apparatus) to enable remote-controlled injection. A 2-m tubing line (Tycon® Flexible Plastic Tubing) with an inner diameter of 0.25 mm was prefilled with a 2-DG solution (Sigma Aldrich, Merck KGaA). 150 \documentclass[12pt]{minimal} \usepackage{amsmath} \usepackage{wasysym} \usepackage{amsfonts} \usepackage{amssymb} \usepackage{amsbsy} \usepackage{mathrsfs} \usepackage{upgreek} \setlength{\oddsidemargin}{-69pt} \begin{document}$$\mu$$\end{document} L of 2-DG, corresponding to a dose of 0.5 g/kg body weight, was injected, adjusted to the weight of the animal. Infusion was initiated in three steps to enhance tolerability: 0.04 mL at 0.03 mL/min, followed by 0.06 mL at 0.015 mL/min and 0.05 mL at 0.03 mL/min. Total anesthesia time was limited to 120 min. After in vivo PET/MRI, animals were euthanized using 300 mg/kg pentobarbital intravenously injected (Release, WDT) and tumors collected.
MRI acquisition
All MRI measurements followed the protocol outlined previously by Bartsch et al [41] and were performed using the same setup for both in vitro and in vivo measurements. MRI scans were performed on a 9.4 T preclinical Biospin 30/94 USR scanner (Bruker) equipped with a BGA 20 gradient system and PET-optimized 35 mm ^1^H volume coil. The system operated with ParaVision v360.33 software (Bruker BioSpin GmbH).
After scout images, T2-weighted anatomic images were acquired using a rapid acquisition with relaxation enhancement (RARE) sequence (repetition time (TR) 2,000 ms, echo time (TE) 35 ms, spatial resolution 0.102 × 0.107 mm^2^, slice thickness 1 mm, matrix size 320 × 320, number of slices 10, acquisition time (TA) 1:20 min:s). Based on those anatomic images, for in vitro images, a slice that did not contain air, and for in vivo images, the axial slice with the largest tumor cross section was chosen for all following single slice scans (WASSR, CEST, T1 map). Water saturation shift referencing (WASSR) [43], to correct for B_0_ inhomogeneities and CEST imaging were performed based on the same RARE-based sequence proposed by Villano et al [44], which was adjusted to be compatible with this scanner and software version. WASSR was performed using 30 offsets from +1.5 ppm to -1.5 ppm, steps 0.1 ppm, TR 3,313 ms, TE 4.3 ms, spatial resolution 0.234 × 0.234 mm^2^, slice thickness 1 mm, matrix size 128 × 128, field-of-view 30 × 30 mm^2^, saturation pulse strength 0.2 \documentclass[12pt]{minimal} \usepackage{amsmath} \usepackage{wasysym} \usepackage{amsfonts} \usepackage{amssymb} \usepackage{amsbsy} \usepackage{mathrsfs} \usepackage{upgreek} \setlength{\oddsidemargin}{-69pt} \begin{document}$$\mu$$\end{document} T, TA 2 min.
CEST images were obtained with following parameters: 120 frequency offsets from +6 ppm to -6 ppm, steps 0.1 ppm, TR 3,000 ms, TE 4.3 ms, spatial resolution: 0.234 × 0.234 mm^2^, slice thickness 1 mm, field-of-view 30 × 30 mm^2^, matrix size 128 × 128, saturation pulse strength 3 \documentclass[12pt]{minimal} \usepackage{amsmath} \usepackage{wasysym} \usepackage{amsfonts} \usepackage{amssymb} \usepackage{amsbsy} \usepackage{mathrsfs} \usepackage{upgreek} \setlength{\oddsidemargin}{-69pt} \begin{document}$$\mu$$\end{document} T, saturation pulse length 3,000 ms, TA 7 min. WASSR and CEST imaging were done at baseline for APTw-CEST and repeated 24 min after 2-DG application in vivo. In vitro, a single WASSR and CEST acquisition was conducted. Then, a T1-weighted map was acquired using a RARE sequence to correct T1 times in the AREX metric as described in Eq. 7. The T1-weighted map was acquired using following parameters: variable TR 867–6,000 ms, TE 28 ms, spatial resolution 0.234 × 0.234 mm^2^, slice thickness 1 mm, matrix size 128 × 128, field-of-view 30 × 30 mm^2^, TA 4:27 min:s.
CEST-MRI metrics: MTRasym, Lorentz amplitude, MTRREX and AREX
The CEST z-spectrum (Eq. 1) is defined by the fraction of steady state magnetization before \documentclass[12pt]{minimal} \usepackage{amsmath} \usepackage{wasysym} \usepackage{amsfonts} \usepackage{amssymb} \usepackage{amsbsy} \usepackage{mathrsfs} \usepackage{upgreek} \setlength{\oddsidemargin}{-69pt} \begin{document}$${M}_{Z}^{0}\left(\Delta \omega \right)$$\end{document} and after \documentclass[12pt]{minimal} \usepackage{amsmath} \usepackage{wasysym} \usepackage{amsfonts} \usepackage{amssymb} \usepackage{amsbsy} \usepackage{mathrsfs} \usepackage{upgreek} \setlength{\oddsidemargin}{-69pt} \begin{document}$${M}_{Z}\left(\Delta \omega \right)$$\end{document} application of the radiofrequency pulse band. The commonly used MTR_asym_ is calculated by subtracting the CEST ratio (Eq. 1) on the y-axis of the z-spectrum for various frequency offsets \documentclass[12pt]{minimal} \usepackage{amsmath} \usepackage{wasysym} \usepackage{amsfonts} \usepackage{amssymb} \usepackage{amsbsy} \usepackage{mathrsfs} \usepackage{upgreek} \setlength{\oddsidemargin}{-69pt} \begin{document}$$(\Delta \omega )$$\end{document} on the x-axis, taken from opposite sides of the bulk water reference peak at 0 ppm (Eq. 2). 2-DG exhibits four exchange pools at +0.66 ppm, +1.28 ppm, +2.08 ppm and +2.88 ppm, with the most prominent exchange occurring at +1.28 ppm. This frequency is used as the 2-DG reference frequency offset [20]. For imaging of endogenous APTw-CEST signal, the reference frequency offset of +3.50 ppm was used.
\documentclass[12pt]{minimal} \usepackage{amsmath} \usepackage{wasysym} \usepackage{amsfonts} \usepackage{amssymb} \usepackage{amsbsy} \usepackage{mathrsfs} \usepackage{upgreek} \setlength{\oddsidemargin}{-69pt} \begin{document}$$Z\left(\Delta \omega \right)=\frac{{M}_{Z}\left(\Delta \omega \right)}{{M}_{Z}^{0}\left(\Delta \omega \right)}$$\end{document} \documentclass[12pt]{minimal} \usepackage{amsmath} \usepackage{wasysym} \usepackage{amsfonts} \usepackage{amssymb} \usepackage{amsbsy} \usepackage{mathrsfs} \usepackage{upgreek} \setlength{\oddsidemargin}{-69pt} \begin{document}$${MT}{R}_{{asym}}\left(\Delta \omega \right)=Z\left(-\Delta \omega \right)-Z\left(\Delta \omega \right)$$\end{document}The MTR_asym_, however, is sensitive to artifacts caused by motion, B_0_ and B_1_ inhomogeneities and the interference from other exchange pools such as amide, amine, the semi-solid magnetization transfer and NOE [45]. To mitigate these influences, advanced corrections based on Lorentzian fitting (Eq. 3) as proposed by Windschuh et al [46] can be applied post-acquisition. Here \documentclass[12pt]{minimal} \usepackage{amsmath} \usepackage{wasysym} \usepackage{amsfonts} \usepackage{amssymb} \usepackage{amsbsy} \usepackage{mathrsfs} \usepackage{upgreek} \setlength{\oddsidemargin}{-69pt} \begin{document}$$I$$\end{document} is the image intensity, \documentclass[12pt]{minimal} \usepackage{amsmath} \usepackage{wasysym} \usepackage{amsfonts} \usepackage{amssymb} \usepackage{amsbsy} \usepackage{mathrsfs} \usepackage{upgreek} \setlength{\oddsidemargin}{-69pt} \begin{document}$${I}_{0}$$\end{document} the image intensity without pre-saturation, \documentclass[12pt]{minimal} \usepackage{amsmath} \usepackage{wasysym} \usepackage{amsfonts} \usepackage{amssymb} \usepackage{amsbsy} \usepackage{mathrsfs} \usepackage{upgreek} \setlength{\oddsidemargin}{-69pt} \begin{document}$$K$$\end{document} the Number of Lorentzian pools (in this case \documentclass[12pt]{minimal} \usepackage{amsmath} \usepackage{wasysym} \usepackage{amsfonts} \usepackage{amssymb} \usepackage{amsbsy} \usepackage{mathrsfs} \usepackage{upgreek} \setlength{\oddsidemargin}{-69pt} \begin{document}$$K$$\end{document} = 5), ω the frequency, \documentclass[12pt]{minimal} \usepackage{amsmath} \usepackage{wasysym} \usepackage{amsfonts} \usepackage{amssymb} \usepackage{amsbsy} \usepackage{mathrsfs} \usepackage{upgreek} \setlength{\oddsidemargin}{-69pt} \begin{document}$${a}_{k}$$\end{document} the amplitude, \documentclass[12pt]{minimal} \usepackage{amsmath} \usepackage{wasysym} \usepackage{amsfonts} \usepackage{amssymb} \usepackage{amsbsy} \usepackage{mathrsfs} \usepackage{upgreek} \setlength{\oddsidemargin}{-69pt} \begin{document}$${\omega }_{k}^{c}$$\end{document} the width and \documentclass[12pt]{minimal} \usepackage{amsmath} \usepackage{wasysym} \usepackage{amsfonts} \usepackage{amssymb} \usepackage{amsbsy} \usepackage{mathrsfs} \usepackage{upgreek} \setlength{\oddsidemargin}{-69pt} \begin{document}$${\sigma }_{k}$$\end{document} the frequency offset of the Lorentzian fit.
\documentclass[12pt]{minimal} \usepackage{amsmath} \usepackage{wasysym} \usepackage{amsfonts} \usepackage{amssymb} \usepackage{amsbsy} \usepackage{mathrsfs} \usepackage{upgreek} \setlength{\oddsidemargin}{-69pt} \begin{document}$$L\left({a}_{k},{\omega }_{k}^{c},{\sigma }_{k}\right)=1-\frac{I}{{I}_{0}}={\sum }_{k=1}^{K}\frac{{a}_{k}}{1+4{\left(\frac{\omega -{\omega }_{k}^{c}}{{\sigma }_{k}}\right)}^{2}}$$\end{document}This is already established in APTw-CEST postprocessing but not common practice for the analysis of glucoCEST datasets. The z-spectrum is affected by spillover from adjacent pools. To address this, the MTR_REX_ metric accounts for these effects by subtracting the inverse sum of all other exchange pools [31]. \documentclass[12pt]{minimal} \usepackage{amsmath} \usepackage{wasysym} \usepackage{amsfonts} \usepackage{amssymb} \usepackage{amsbsy} \usepackage{mathrsfs} \usepackage{upgreek} \setlength{\oddsidemargin}{-69pt} \begin{document}$${Z}_{{lab}}$$\end{document} represents the \documentclass[12pt]{minimal} \usepackage{amsmath} \usepackage{wasysym} \usepackage{amsfonts} \usepackage{amssymb} \usepackage{amsbsy} \usepackage{mathrsfs} \usepackage{upgreek} \setlength{\oddsidemargin}{-69pt} \begin{document}$$Z$$\end{document} value at the label frequency and is calculated in Eq. 4 by subtracting the sum over all Lorentzian fits from the parameter \documentclass[12pt]{minimal} \usepackage{amsmath} \usepackage{wasysym} \usepackage{amsfonts} \usepackage{amssymb} \usepackage{amsbsy} \usepackage{mathrsfs} \usepackage{upgreek} \setlength{\oddsidemargin}{-69pt} \begin{document}$${Z}_{{base}}$$\end{document} which corrects the constant signal reduction. In Eq. 5, the reference \documentclass[12pt]{minimal} \usepackage{amsmath} \usepackage{wasysym} \usepackage{amsfonts} \usepackage{amssymb} \usepackage{amsbsy} \usepackage{mathrsfs} \usepackage{upgreek} \setlength{\oddsidemargin}{-69pt} \begin{document}$$Z$$\end{document} signal \documentclass[12pt]{minimal} \usepackage{amsmath} \usepackage{wasysym} \usepackage{amsfonts} \usepackage{amssymb} \usepackage{amsbsy} \usepackage{mathrsfs} \usepackage{upgreek} \setlength{\oddsidemargin}{-69pt} \begin{document}$${Z}_{{ref},j}$$\end{document} is calculated by excluding the exchange pool \documentclass[12pt]{minimal} \usepackage{amsmath} \usepackage{wasysym} \usepackage{amsfonts} \usepackage{amssymb} \usepackage{amsbsy} \usepackage{mathrsfs} \usepackage{upgreek} \setlength{\oddsidemargin}{-69pt} \begin{document}$$i$$\end{document} at the label frequency. The final MTR_REX_ is then defined by the inverse subtraction of those two \documentclass[12pt]{minimal} \usepackage{amsmath} \usepackage{wasysym} \usepackage{amsfonts} \usepackage{amssymb} \usepackage{amsbsy} \usepackage{mathrsfs} \usepackage{upgreek} \setlength{\oddsidemargin}{-69pt} \begin{document}$$Z$$\end{document} values, as seen in Eq. 6. This is proven to be essential in APTw-CEST and should also benefit 2D-glucoCEST quantification since the 2-DG exchange pools are closely spaced. For the MTR_REX_ metric in APTw-CEST, the amide frequency at +3.50 ppm is chosen as the label, while signals from water (0 ppm), NOE (-3.5 ppm), MT (-2 ppm), and amine (+2.2 ppm) are removed. In 2-DG calculations, the label frequency is set to the dominant exchange pool at +1.28 ppm, while contributions from water at 0 ppm, and other 2-DG pools at +0.66 ppm, +2.08 ppm and +2.88 ppm are subtracted (Supplementary Tables 1, 2).
\documentclass[12pt]{minimal} \usepackage{amsmath} \usepackage{wasysym} \usepackage{amsfonts} \usepackage{amssymb} \usepackage{amsbsy} \usepackage{mathrsfs} \usepackage{upgreek} \setlength{\oddsidemargin}{-69pt} \begin{document}$${Z}_{{lab}}\left(\Delta \omega \right)={Z}_{{base}}-{\sum }_{i}^{n=K}L_{i}(\Delta \omega )$$\end{document} \documentclass[12pt]{minimal} \usepackage{amsmath} \usepackage{wasysym} \usepackage{amsfonts} \usepackage{amssymb} \usepackage{amsbsy} \usepackage{mathrsfs} \usepackage{upgreek} \setlength{\oddsidemargin}{-69pt} \begin{document}$${Z}_{{ref},j}\left(\Delta \omega \right)={Z}_{{base}}-{\sum }_{i\ne j}^{n=K}L_{i}(\Delta \omega )$$\end{document} \documentclass[12pt]{minimal} \usepackage{amsmath} \usepackage{wasysym} \usepackage{amsfonts} \usepackage{amssymb} \usepackage{amsbsy} \usepackage{mathrsfs} \usepackage{upgreek} \setlength{\oddsidemargin}{-69pt} \begin{document}$${{MTR}}_{{REX}}\left({\delta }_{i}\right)=\frac{1}{{Z}_{{lab}}({\delta }_{i})}-\frac{1}{{Z}_{{ref},i}({\delta }_{i})}$$\end{document}Since CEST is also influenced by \documentclass[12pt]{minimal} \usepackage{amsmath} \usepackage{wasysym} \usepackage{amsfonts} \usepackage{amssymb} \usepackage{amsbsy} \usepackage{mathrsfs} \usepackage{upgreek} \setlength{\oddsidemargin}{-69pt} \begin{document}$${T1}_{{obs}}$$\end{document} relaxation times, the AREX metric (Eq. 7) was introduced to correct MTR_REX_ values by accounting for T1-relaxation effects [31]:
\documentclass[12pt]{minimal} \usepackage{amsmath} \usepackage{wasysym} \usepackage{amsfonts} \usepackage{amssymb} \usepackage{amsbsy} \usepackage{mathrsfs} \usepackage{upgreek} \setlength{\oddsidemargin}{-69pt} \begin{document}$${AREX}\left({\delta }_{i}\right)=\frac{{{MTR}}_{{REX}}\left({\delta }_{i}\right)}{{T1}_{{obs}}}$$\end{document}Finally, based on these four quantification metrics, delta maps were generated to assess signal differences before and after challenge application, as demonstrated in the case of 2-DG. The complete postprocessing pipeline is illustrated in Fig. 1.Fig. 1. Scheme of postprocessing pipeline. After z-spectrum acquisition, B_0_ correction with WASSR and spline fitting is applied. Then the MTR_asym_ is computed and Lorentzian fitting is performed using two different 5-pool models according to APTw-CEST or 2D-glucoCEST (Supplementary Tables S1, S2). Simple amplitude extraction from Lorentzian fits allows the generation of parametric Lorentzian amplitude maps. Then, based on Lorentzian fitting parameters, Z_lab_ (Eq. 4) and Z_ref_ (Eq. 5) can be computed where the inverse sum results in the MTR_REX_ metric (Eq. 6). At the end, a T1 mapping allows for the computation of the T1-independent AREX metric (Eq. 7). AREX, Apparent exchange-dependent relaxation; MTR_asym_, Magnetization transfer ratio asymmetry; MTR_REX_, Magnetization transfer ratio relaxation exchange; WASSR, Water saturation shift referencing; Z_lab_, \documentclass[12pt]{minimal} \usepackage{amsmath} \usepackage{wasysym} \usepackage{amsfonts} \usepackage{amssymb} \usepackage{amsbsy} \usepackage{mathrsfs} \usepackage{upgreek} \setlength{\oddsidemargin}{-69pt} \begin{document}$$Z$$\end{document} value at the label frequency; Z_ref_, \documentclass[12pt]{minimal} \usepackage{amsmath} \usepackage{wasysym} \usepackage{amsfonts} \usepackage{amssymb} \usepackage{amsbsy} \usepackage{mathrsfs} \usepackage{upgreek} \setlength{\oddsidemargin}{-69pt} \begin{document}$$Z$$\end{document} value calculated by excluding the exchange pool \documentclass[12pt]{minimal} \usepackage{amsmath} \usepackage{wasysym} \usepackage{amsfonts} \usepackage{amssymb} \usepackage{amsbsy} \usepackage{mathrsfs} \usepackage{upgreek} \setlength{\oddsidemargin}{-69pt} \begin{document}$$i$$\end{document} at the label frequency
CEST postprocessing
For in vitro and in vivo CEST postprocessing, T2-weighted anatomical reference images (.dcm), T1 maps (.nii) and raw CEST data (*.2Dseq) were exported from ParaVision v360.33 software (Bruker BioSpin GmbH). The initial steps of CEST postprocessing included dataset import, B_0_ correction using WASSR images, spline fitting of z-spectra and Lorentzian fits. These steps were performed in MATLAB version R2023a (MathWorks) using previously published code (cest-sources.org) [47]. The remaining quantification was carried out using MATLAB code developed in-house. Image readings were performed by two supervised PhD students with experience in preclinical imaging, who consulted with each other during regions of interest (ROIs) placement to ensure consistency. Both readers were aware of the assignment of the animals to the respective groups. ROIs were manually drawn on axial T2-weighted anatomical reference images, and parametric CEST maps were generated according to Eqs. 2, 3, 6 and 7 and overlaid using the Fusion module of pmod (version 4.4, PMOD Technologies LLC, Switzerland) [48]. This process was repeated for egg white phantoms in vitro and in vivo pre-contrast images on endogenous APTw-CEST signals using a five-pool Lorentzian model (Supplementary Table 1) and for 2-DG phantoms in vitro and in vivo post-contrast images to assess exogenous 2D-glucoCEST, applying a different five-pool Lorentzian model to account for 2-DG exchange pools (Supplementary Table 2). In addition to inspection of the z-spectra in vitro for both APTw-CEST and 2D-glucoCEST, the CNR for the four quantification metrics was calculated based on a mean value within two signal producing ROIs \documentclass[12pt]{minimal} \usepackage{amsmath} \usepackage{wasysym} \usepackage{amsfonts} \usepackage{amssymb} \usepackage{amsbsy} \usepackage{mathrsfs} \usepackage{upgreek} \setlength{\oddsidemargin}{-69pt} \begin{document}$$({{{\rm{\mu }}}}_{1/2})$$\end{document} and their standard deviations \documentclass[12pt]{minimal} \usepackage{amsmath} \usepackage{wasysym} \usepackage{amsfonts} \usepackage{amssymb} \usepackage{amsbsy} \usepackage{mathrsfs} \usepackage{upgreek} \setlength{\oddsidemargin}{-69pt} \begin{document}$$({{{\rm{\sigma }}}}_{1/2})$$\end{document} :
\documentclass[12pt]{minimal} \usepackage{amsmath} \usepackage{wasysym} \usepackage{amsfonts} \usepackage{amssymb} \usepackage{amsbsy} \usepackage{mathrsfs} \usepackage{upgreek} \setlength{\oddsidemargin}{-69pt} \begin{document}$${{\rm{CNR}}}=\frac{|{\mu }_{1}-{\mu }_{2}|}{\sqrt{{\sigma }_{1}^{2}+{\sigma }_{2}^{2}}}$$\end{document}Statistical analysis
In vitro experiments
Coregistered maps and ROIs were exported from pmod as *.nii and evaluated with R version 4.4.0, 2024-04-24 using RStudio (Posit Software, PBC, Boston, USA). Values were reported as mean ± standard deviation. Additionally, CNR was calculated between consecutive concentrations according to Eq. 8.
In vivo experiments
Coregistered maps and ROIs were exported from pmod as *.nii, and statistical analysis was performed using R Studio. Maps with obvious artifacts (e.g., motion or stripe artifacts caused by the heating water bed) were excluded, and outliers were identified using Eq. 9.
\documentclass[12pt]{minimal} \usepackage{amsmath} \usepackage{wasysym} \usepackage{amsfonts} \usepackage{amssymb} \usepackage{amsbsy} \usepackage{mathrsfs} \usepackage{upgreek} \setlength{\oddsidemargin}{-69pt} \begin{document}$$Q3+1.5 \, \times \, {IQR} \, < \, x \, < \, Q1-1.5 \, \times \, {IQR}$$\end{document}where \documentclass[12pt]{minimal} \usepackage{amsmath} \usepackage{wasysym} \usepackage{amsfonts} \usepackage{amssymb} \usepackage{amsbsy} \usepackage{mathrsfs} \usepackage{upgreek} \setlength{\oddsidemargin}{-69pt} \begin{document}$$Q1$$\end{document} is the first quartile, \documentclass[12pt]{minimal} \usepackage{amsmath} \usepackage{wasysym} \usepackage{amsfonts} \usepackage{amssymb} \usepackage{amsbsy} \usepackage{mathrsfs} \usepackage{upgreek} \setlength{\oddsidemargin}{-69pt} \begin{document}$$Q3$$\end{document} is the third quartile, \documentclass[12pt]{minimal} \usepackage{amsmath} \usepackage{wasysym} \usepackage{amsfonts} \usepackage{amssymb} \usepackage{amsbsy} \usepackage{mathrsfs} \usepackage{upgreek} \setlength{\oddsidemargin}{-69pt} \begin{document}$${IQR}$$\end{document} the interquartile range and \documentclass[12pt]{minimal} \usepackage{amsmath} \usepackage{wasysym} \usepackage{amsfonts} \usepackage{amssymb} \usepackage{amsbsy} \usepackage{mathrsfs} \usepackage{upgreek} \setlength{\oddsidemargin}{-69pt} \begin{document}$$x$$\end{document} the observed variable.
A flowchart of animal numbers and exclusions can be found in Supplementary Fig. S1. After all exclusions, the final sample sizes were as follows: APTw-CEST: n = 12 (Luminal A), n = 14 (HER2+) and n = 13 (triple-negative) and 2D-glucoCEST: n = 9 (Luminal A), n = 9 (HER2+), and n = 10 (triple-negative). Animals were assigned to experimental groups using random cage selection, ensuring that the average body weights per assigned group (~25 g) were the same to minimize baseline variability. A power calculation to determine sample sizes was conducted and can be found in the Supplementary Material. Tumor volumes were calculated from T2-weighted axial images using manual segmentation in PMOD based on voxel dimensions (Supplementary Table S3). All values are reported as mean ± standard deviation. Normality was assessed using the Shapiro–Wilk test. If the dataset showed normal distribution, one-way analysis of variance (ANOVA) was conducted with Tukey HSD post hoc pairwise comparisons. If the dataset was non-normally distributed, the Kruskal–Wallis test was performed with Benjamini–Hochberg post hoc corrections and pairwise comparisons. (*p < 0.05, **p < 0.01).
Results
In vitro experiments
The CEST measurements demonstrated stable and reliable signal detection across different phantoms, allowing for clear peak identification and quantitative CNR comparisons. In egg white measurements, a stable APTw-CEST signal was observed, with a well-fitted spline and distinct amide peak at +3.50 ppm (Fig. 2b).Fig. 2In vitro egg white phantoms to illustrate APTw-CEST contrast. a T2-weighted anatomical image overlayed with MTR_asym_ map of egg white + PBS phantoms at 5 different concentrations (20%, 40%, 60%, 80%, 100%). b Single-pixel z-spectra of egg white + PBS phantoms at 5 different concentrations. Dots represent raw data while solid lines show the spline fit. The MTR_asym_ can be seen in the lower left corner. The amide peak at +3.50 ppm is clearly visible and marked by an arrow. c Signal intensity of MTR_asym_, Lorentz amplitude, MTR_REX_ and AREX at 5 different concentrations. An increase in signal intensity with increasing concentration can be seen across all metrics. d CNR according to Eq. 8 between neighboring concentrations, highest CNR can be seen for the MTR_asym_, followed by Lorentzian amplitudes, AREX and MTR_REX_. AREX, Apparent exchange-dependent relaxation; CNR, Contrast-to-noise ratio; MTR_asym_, Magnetization transfer ratio asymmetry; MTR_REX_, Magnetization transfer ratio relaxation exchange
For 2-DG phantoms at five different concentrations (4.5 mM, 9 mM, 13.5 mM, 18 mM, 22.5 mM), the 2D-glucoCEST z-spectrum remained stable with a well-fitted spline, and MTR_asym_ maxima increased with rising concentrations (Fig. 3b).Fig. 3In vitro 2-DG phantoms to illustrate glucoCEST contrast. a T2-weighted anatomical image overlayed with MTR_asym_ map of a phantom containing 5 different concentrations of 2-DG in PBS (4.5 mM, 9 mM, 13.5 mM, 18 mM, 22.5 mM). b Single-pixel z-spectra of 2-DG + PBS phantoms. Dots represent raw data while solid lines show the spline fit. The MTR_asym_ can be seen in the lower left corner. The 2-DG peak at +1.28 ppm is clearly visible and marked by an arrow. c Signal intensity of MTR_asym_, Lorentz amplitude, MTR_REX_ and AREX at 5 different concentrations. An increase in signal intensity with increasing concentration can be seen across MTR_asym_ and Lorentz amplitude; however, for MTR_REX_ and AREX, the signal decreases for the two highest concentrations. d CNR according to Eq. 8 between neighboring concentrations, the highest CNR can be seen for the MTR_asym_, followed by Lorentzian amplitudes, AREX and MTR_REX_. 2-DG, 2-Deoxy-D-glucose; AREX, Apparent exchange-dependent relaxation; CNR, Contrast-to-noise ratio; MTR_asym_, Magnetization transfer ratio asymmetry; MTR_REX_, Magnetization transfer ratio relaxation exchange
In vivo experiments
Advanced quantification metrics, including MTR_REX_ and AREX, revealed significant distinctions between BC subtypes for both APTw-CEST and 2D-glucoCEST. Distinct spatial variations across BC subtypes were most pronounced in the MTR_REX_ and AREX parametric maps for both APTw-CEST (Fig. 4) and 2D-glucoCEST images (Supplementary Fig. 2).Fig. 4T2-weighted anatomical images in axial orientation with a phantom on the left and tumor at the dorsal side, overlapped with APTw-CEST parametric maps. The first row shows the Luminal A tumor, the second row the HER2+ tumor and the third row the triple-negative tumor. The following parametric maps are shown: (a, e, i) MTR_asym_, (b, f, j) Lorentz amplitude, (c, g, k) MTR_REX_ and (d, h, l) AREX. AREX, Apparent exchange-dependent relaxation; MTR_asym_, Magnetization transfer ratio asymmetry; MTR_REX_, Magnetization transfer ratio relaxation exchange
Among the four postprocessing metrics applied to APTw-CEST, AREX and MTR_REX_ (Fig. 5c, d) significantly differentiated Luminal A from HER2+ (*p = 0.021; *p = 0.027) and Luminal A from triple-negative (**p = 0.006; **p = 0.003), demonstrating rising APTw-CEST signals with increasing BC subtype aggressiveness. The Lorentzian amplitude (Fig. 5b) successfully differentiated only Luminal A from triple-negative (*p = 0.019). MTR_asym_ (Fig. 5a) was unable to distinguish between BC subtypes. Notably, none of the applied APTw-CEST metrics revealed significant differences between HER2+ and triple-negative tumors.Fig. 5APTw-CEST signal across three different breast cancer subtypes. Light pink represents Luminal A tumors, medium pink HER2+ tumors and the dark pink represents triple-negative tumors, according to subtype aggressiveness. The boxplots show mean values over tumor ROIs for mice inoculated with the respective subtype. An increase in signal according to aggressiveness can be observed across all figures: (a) MTR_asym_, (b) Lorentz amplitudes, (c) MTR_REX_, and (d) AREX, where all metrics enable significant differentiation between the subtypes except for the MTR_asym_ in a. AREX, Apparent exchange-dependent relaxation; MTR_asym_, Magnetization transfer ratio asymmetry; MTR_REX_, Magnetization transfer ratio relaxation exchange
Among the four applied postprocessing metrics for 2D-glucoCEST, only \documentclass[12pt]{minimal} \usepackage{amsmath} \usepackage{wasysym} \usepackage{amsfonts} \usepackage{amssymb} \usepackage{amsbsy} \usepackage{mathrsfs} \usepackage{upgreek} \setlength{\oddsidemargin}{-69pt} \begin{document}$$\Delta$$\end{document} AREX (Fig. 6d) was able to significantly differentiate Luminal A from HER2+ (*p = 0.017) and showed a decrease in the 2D-glucoCEST signal for the triple-negative subtype. \documentclass[12pt]{minimal} \usepackage{amsmath} \usepackage{wasysym} \usepackage{amsfonts} \usepackage{amssymb} \usepackage{amsbsy} \usepackage{mathrsfs} \usepackage{upgreek} \setlength{\oddsidemargin}{-69pt} \begin{document}$$\Delta$$\end{document} MTR_REX_ (Fig. 6c), \documentclass[12pt]{minimal} \usepackage{amsmath} \usepackage{wasysym} \usepackage{amsfonts} \usepackage{amssymb} \usepackage{amsbsy} \usepackage{mathrsfs} \usepackage{upgreek} \setlength{\oddsidemargin}{-69pt} \begin{document}$$\Delta$$\end{document} Lorentzian amplitudes (Fig. 6b) and \documentclass[12pt]{minimal} \usepackage{amsmath} \usepackage{wasysym} \usepackage{amsfonts} \usepackage{amssymb} \usepackage{amsbsy} \usepackage{mathrsfs} \usepackage{upgreek} \setlength{\oddsidemargin}{-69pt} \begin{document}$$\Delta$$\end{document} MTR_asym_ (Fig. 6a) varied between BC subtypes but without any significance.Fig. 6 \documentclass[12pt]{minimal} \usepackage{amsmath} \usepackage{wasysym} \usepackage{amsfonts} \usepackage{amssymb} \usepackage{amsbsy} \usepackage{mathrsfs} \usepackage{upgreek} \setlength{\oddsidemargin}{-69pt} \begin{document}$$\Delta$$\end{document} 2D-glucoCEST signal across three different breast cancer subtypes. Light blue represents Luminal A tumors, medium blue HER2+ tumors and dark blue the triple-negative tumors according to subtype aggressiveness. The boxplots show mean values over tumor ROIs for mice inoculated with the respective subtype. A signal increase from Luminal A to HER2+ can be seen across all metrics: (a) MTR_asym_, (b) Lorentz amplitude, (c) MTR_REX_, and (d) significantly in AREX. However, only Lorentz amplitude, MTR_REX_ and AREX display a decrease in signal for the most aggressive triple-negative subtype. AREX, Apparent exchange-dependent relaxation; MTR_asym_, Magnetization transfer ratio asymmetry; MTR_REX_, Magnetization transfer ratio relaxation exchange
Mean values \documentclass[12pt]{minimal} \usepackage{amsmath} \usepackage{wasysym} \usepackage{amsfonts} \usepackage{amssymb} \usepackage{amsbsy} \usepackage{mathrsfs} \usepackage{upgreek} \setlength{\oddsidemargin}{-69pt} \begin{document}$$\pm$$\end{document} standard deviation for APTw-CEST and \documentclass[12pt]{minimal} \usepackage{amsmath} \usepackage{wasysym} \usepackage{amsfonts} \usepackage{amssymb} \usepackage{amsbsy} \usepackage{mathrsfs} \usepackage{upgreek} \setlength{\oddsidemargin}{-69pt} \begin{document}$$\Delta$$\end{document} 2D-glucoCEST signals are presented in Table 1. These values demonstrated a consistent increase in mean APTw-CEST signals with increasing BC subtype aggressiveness for the three postprocessing metrics that produced significant results (Lorentzian amplitude, MTR_REX_, AREX), whereas MTR_asym_ remains inconclusive. For \documentclass[12pt]{minimal} \usepackage{amsmath} \usepackage{wasysym} \usepackage{amsfonts} \usepackage{amssymb} \usepackage{amsbsy} \usepackage{mathrsfs} \usepackage{upgreek} \setlength{\oddsidemargin}{-69pt} \begin{document}$$\Delta$$\end{document} 2D-glucoCEST, \documentclass[12pt]{minimal} \usepackage{amsmath} \usepackage{wasysym} \usepackage{amsfonts} \usepackage{amssymb} \usepackage{amsbsy} \usepackage{mathrsfs} \usepackage{upgreek} \setlength{\oddsidemargin}{-69pt} \begin{document}$$\Delta$$\end{document} AREX had a mean signal intensity of 2.3‒3.2% while \documentclass[12pt]{minimal} \usepackage{amsmath} \usepackage{wasysym} \usepackage{amsfonts} \usepackage{amssymb} \usepackage{amsbsy} \usepackage{mathrsfs} \usepackage{upgreek} \setlength{\oddsidemargin}{-69pt} \begin{document}$$\Delta$$\end{document} MTR_REX_ had a mean signal intensity of 4.5‒6.5% as it is still influenced by T1. \documentclass[12pt]{minimal} \usepackage{amsmath} \usepackage{wasysym} \usepackage{amsfonts} \usepackage{amssymb} \usepackage{amsbsy} \usepackage{mathrsfs} \usepackage{upgreek} \setlength{\oddsidemargin}{-69pt} \begin{document}$$\Delta$$\end{document} Lorentz amplitude and \documentclass[12pt]{minimal} \usepackage{amsmath} \usepackage{wasysym} \usepackage{amsfonts} \usepackage{amssymb} \usepackage{amsbsy} \usepackage{mathrsfs} \usepackage{upgreek} \setlength{\oddsidemargin}{-69pt} \begin{document}$$\Delta$$\end{document} MTR_asym_ showed relatively low values of 0.7‒1.6%.Table 1. Mean values (± standard deviation) for each quantification metric across the three breast cancer subtype groups for both APTw-CEST and \documentclass[12pt]{minimal} \usepackage{amsmath} \usepackage{wasysym} \usepackage{amsfonts} \usepackage{amssymb} \usepackage{amsbsy} \usepackage{mathrsfs} \usepackage{upgreek} \setlength{\oddsidemargin}{-69pt} \begin{document}$$\Delta$$\end{document} 2D-glucoCESTAPTw-CESTMTR_asym_ (%)Lorentz amplitude (a.u.)MTR_REX_ (a.u.)AREX (a.u.)Luminal A2.43 \documentclass[12pt]{minimal} \usepackage{amsmath} \usepackage{wasysym} \usepackage{amsfonts} \usepackage{amssymb} \usepackage{amsbsy} \usepackage{mathrsfs} \usepackage{upgreek} \setlength{\oddsidemargin}{-69pt} \begin{document}$$\pm$$\end{document} 1.690.037 \documentclass[12pt]{minimal} \usepackage{amsmath} \usepackage{wasysym} \usepackage{amsfonts} \usepackage{amssymb} \usepackage{amsbsy} \usepackage{mathrsfs} \usepackage{upgreek} \setlength{\oddsidemargin}{-69pt} \begin{document}$$\pm$$\end{document} 0.0250.023 \documentclass[12pt]{minimal} \usepackage{amsmath} \usepackage{wasysym} \usepackage{amsfonts} \usepackage{amssymb} \usepackage{amsbsy} \usepackage{mathrsfs} \usepackage{upgreek} \setlength{\oddsidemargin}{-69pt} \begin{document}$$\pm$$\end{document} 0.0200.016 \documentclass[12pt]{minimal} \usepackage{amsmath} \usepackage{wasysym} \usepackage{amsfonts} \usepackage{amssymb} \usepackage{amsbsy} \usepackage{mathrsfs} \usepackage{upgreek} \setlength{\oddsidemargin}{-69pt} \begin{document}$$\pm$$\end{document} 0.009HER2+2.34 ± 1.320.055 ± 0.0180.059 ± 0.0510.033 ± 0.025Triple-negative3.06 ± 0.800.062 ± 0.0220.079 ± 0.0570.041 ± 0.027 \documentclass[12pt]{minimal} \usepackage{amsmath} \usepackage{wasysym} \usepackage{amsfonts} \usepackage{amssymb} \usepackage{amsbsy} \usepackage{mathrsfs} \usepackage{upgreek} \setlength{\oddsidemargin}{-69pt} \begin{document}$$\Delta$$\end{document} 2D-glucoCEST \documentclass[12pt]{minimal} \usepackage{amsmath} \usepackage{wasysym} \usepackage{amsfonts} \usepackage{amssymb} \usepackage{amsbsy} \usepackage{mathrsfs} \usepackage{upgreek} \setlength{\oddsidemargin}{-69pt} \begin{document}$$\Delta$$\end{document} MTR_asym_ (%) \documentclass[12pt]{minimal} \usepackage{amsmath} \usepackage{wasysym} \usepackage{amsfonts} \usepackage{amssymb} \usepackage{amsbsy} \usepackage{mathrsfs} \usepackage{upgreek} \setlength{\oddsidemargin}{-69pt} \begin{document}$$\Delta$$\end{document} Lorentz amplitude (a.u.) \documentclass[12pt]{minimal} \usepackage{amsmath} \usepackage{wasysym} \usepackage{amsfonts} \usepackage{amssymb} \usepackage{amsbsy} \usepackage{mathrsfs} \usepackage{upgreek} \setlength{\oddsidemargin}{-69pt} \begin{document}$$\Delta$$\end{document} MTR_REX_ (a.u.) \documentclass[12pt]{minimal} \usepackage{amsmath} \usepackage{wasysym} \usepackage{amsfonts} \usepackage{amssymb} \usepackage{amsbsy} \usepackage{mathrsfs} \usepackage{upgreek} \setlength{\oddsidemargin}{-69pt} \begin{document}$$\Delta$$\end{document} AREX (a.u.)Luminal A0.653 ± 0.4901.16 \documentclass[12pt]{minimal} \usepackage{amsmath} \usepackage{wasysym} \usepackage{amsfonts} \usepackage{amssymb} \usepackage{amsbsy} \usepackage{mathrsfs} \usepackage{upgreek} \setlength{\oddsidemargin}{-69pt} \begin{document}$$\pm$$\end{document} 0.384.45 ± 2.132.31 ± 0.88HER2+1.35 ± 1.451.59 ± 0.336.67 ± 2.073.59 ± 1.04Triple-negative1.28 ± 0.671.64 ± 0.636.52 ± 1.363.21 ± 0.82Interquartile ranges can be found in Supplementary Table S4 and reflect a consistent distribution of values for all four metrics across tumors within each subtype2D 2-Deoxy-D-glucose, APTw Amide proton transfer weighted, AREX Apparent exchange-dependent relaxation, CEST Chemical exchange saturation transfer, MTRasym Magnetization transfer ratio asymmetry, MTRREX Magnetization transfer ratio relaxation exchange
Discussion
Metabolic CEST-MRI is a promising noninvasive imaging technique [7–10]. Particularly, the endogenous APTw-CEST [11–16, 49] and exogenous glucoCEST [17–23] are of importance as they provide insights into cancer biology. However, CEST imaging and quantification are influenced by various parameters related to hardware, imaging sequences, and postprocessing metrics. Recent efforts have aimed to address potential sources of artifacts, including field inhomogeneities, motion, and signal contamination from overlapping pools, through increasingly sophisticated postprocessing approaches [12, 13, 29–31, 43, 46, 50–52]. Early studies highlighted critical challenges, particularly the influence of the NOE on the MTR_asym_ of amide at +3.50 ppm.
This spectral interference complicates conventional quantification from mobile macromolecular relaxation processes occurring symmetrically opposite the amide peak in the z-spectrum at around -3.50 ppm upfield from the water resonance. Furthermore, fat correction was challenging [15]. To overcome these technical hurdles, advanced postprocessing metrics were developed. Among them, MTR_REX_ and AREX have demonstrated superior performance in glioblastoma and ischemic stroke studies [27, 28, 31, 46], allowing a differentiation between healthy and pathological brain tissue.
To our knowledge, this is one of the first studies to apply these postprocessing metrics in xenograft models of BCs, where we anticipate similarly promising results as in glioblastoma studies, as the underlying biological processes—specifically protein metabolism, perfusion, and pH regulation—are known to be similar between glioblastoma and BC tissues [10].
Among the four postprocessing metrics applied, only MTR_REX_ and AREX allow molecular subtyping with APTw-CEST in vivo. On the other hand, in 2D-glucoCEST only AREX shows similar results. Notably, in our in vitro experiments, APTw-CEST spectra from egg white were stable with increasing protein concentration across all metrics, with MTR_asym_ yielding the highest CNR. In 2-DG phantoms, slight deviations in MTR_REX_ and AREX curves at the highest concentrations coincided with minor image artifacts—likely due to complex phantom preparation. These findings indicated that CEST quantification varies depending on the contrast type, with different signal intensity trends observed with rising concentrations for APTw-CEST and 2D-glucoCEST phantom signals.
Although few studies have assessed the clinical utility of APTw-CEST in BC, a recent review of 14 studies reported contradictory findings on whether the APTw signals are higher or lower in malignant versus benign breast lesions [32]. For instance, one study reported an APTw signal of 2.7% in benign and 1.2% in malignant lesions [33], whereas most reported elevated malignant values, such as 1.55% versus 0.54% in Liu et al [34].
BC subtype-specific results from Kamitani et al showed 1.74% (Luminal type), 1.83% (HER2+) and 2.75% (triple-negative) [36]. In line with this, Zhang et al [35] reported mean APTw signals of 2.30% (Luminal A), 2.30% (Luminal B), 2.23% (HER2+) and 3.20% (triple-negative) in a prospective cohort of 205 patients, further underlining the clinical relevance of CEST imaging. While their work compared different modalities such as dynamic contrast-enhanced (DCE) imaging, intravoxel incoherent motion (IVIM) and CEST, our study adds value by systematically identifying the most suitable CEST postprocessing metric for reliable molecular subtyping, which can guide future translational and clinical studies.
While most studies were conducted at 3 T, our 9.4-T preclinical data followed the same trend of increasing APTw signal with subtype aggressiveness, supporting the majority of clinical findings. Thus, our findings hold translational relevance for clinical scanners operating at 3 T, where APTw-CEST has already demonstrated feasibility by keeping efficient acquisition times between 4 and 7 min in several clinical studies [33–35].
Notably, all of the mentioned studies relied solely on the MTR_asym_ metric, except for Zhang et al [14], who additionally incorporated Lorentzian amplitude analysis. However, it has been widely recognized that the specificity of the MTR_asym_ is limited, as it is influenced by other exchange pools. To overcome these limitations, our study applied multi-pool CEST contrast using MTR_REX_, while diffusion-related effects were accounted for by calculating AREX, thereby enhancing both specificity and biological interpretability.
Our findings show that while Lorentzian fitting modestly improved contrast, only corrections employing advanced postprocessing metrics, such as MTR_REX_ and AREX, allowed accurate molecular subtyping, enabling differentiation of less aggressive Luminal A from moderate aggressive HER2+ and highly aggressive triple-negative BCs. Future studies should investigate the integration of these postprocessing metrics into clinical breast MRI, as additional validation, standardization, and multi-center evaluation will be necessary before their potential to enhance diagnostic utility and reproducibility can be fully realized.
GlucoCEST allows quantification of glucose metabolism typically elevated in cancer tissue and has emerged as a potential complementary technique to [^18^F]FDG-PET. In contrast to APTw-CEST, advanced postprocessing metrics have not yet been widely applied to glucoCEST imaging. This is the first study quantifying a 2D-glucoCEST dataset beyond MTR_asym_ by incorporating Lorentzian amplitudes, MTR_REX_ and AREX analysis. In a study by Anemone et al, an MTR_asym_ signal of 1‒2% at 3 T and 2‒3% at 7 T was observed in a melanoma mouse model for two different glucose analogs, similar to what we found [53]. Our results demonstrate, however, that only AREX enables molecular subtyping in BC with increasing 2D-glucoCEST signals from the Luminal A to the more aggressive HER2 + BC subtype. However, the triple-negative BC subtype displayed an unexpectedly lower signal compared to the HER2+ subtype. This contradictory effect may be attributed to two factors: (1) insufficient delivery of 2-DG, particularly to the tumor core, due to leaky vasculature from rapid tumor growth [54], and (2) an increased intracellular pH in tumor cells, which could shift the base-catalyzed CEST from a slow-to-intermediate to a fast exchange rate, leading to a reduction in its signal due to undetectably fast exchange [55–57]. This is consistent with findings by Chan et al [22], who similarly reported a reduced glucoCEST contrast in the more aggressive triple-negative subtype. They suggested, this may be due to reduced perfusion, less favorable extracellular pH, or diminished glucose retention in highly aggressive tumors. Future studies could complement CEST-MRI with dynamic contrast-enhanced (DCE) MRI to noninvasively assess vascular perfusion and permeability in vivo and would provide functional information directly relevant to the proposed mechanism, while vascular immunohistochemistry could additionally validate these findings.
While glucoCEST holds promise as a noninvasive metabolic imaging technique, its clinical translation faces several barriers. These include rapid wash-out of glucose post-injection, spectral overlap between hydroxyl exchange and water resonance—specifically at low field strengths—and vascular integrity [20]. Although alternative glucose analogs like 3-O-methyl-D-glucose, D-glucosamine, and others have been proposed to address some of these limitations [20, 53, 58], their hydroxyl exchange sites remain close to the water resonance. Therefore, improvements in glucoCEST performance at clinical field strengths may be limited with these analogs alone. However, as seen in our study, even when applying an advanced postprocessing metric using AREX, 2D-glucoCEST remained less effective than APTw-CEST in differentiating BC subtypes.
The study is hampered by some limitations. First, magnetic field shimming during CEST acquisition affected image quality, leading to the exclusion of some datasets. Second, while B_0_ inhomogeneities were corrected using WASSR, B_1_ inhomogeneities were not addressed, as methods such as WASABI [52] could not be implemented due to time constraints. Incorporating B_1_ corrections may further improve quantification accuracy.
Additionally, we acknowledge that tumor sizes differed by up to a factor of three between Luminal A and the more aggressive HER2+ and triple-negative BC subtypes, although cross-sectional areas remained largely comparable (3.8 ± 2.2 mm^2^, mean ± standard deviation), and therefore, a systematic bias from tumor size differences is unlikely. Moreover, although three major and biologically distinct subtypes (Luminal A, HER2+, triple-negative BC) were included, Luminal B could not be feasibly added. Furthermore, interobserver variability was not assessed, and measurements were performed by non-radiologists.
Despite these limitations, our study is strengthened by what constitutes a comparatively large and diverse dataset for a preclinical xenograft study, encompassing three biologically distinct and clinically relevant molecular BC subtypes. While this cannot be directly compared in scale to clinical cohorts such as Zhang et al [35] with 205 participants, it nevertheless provides an important experimental foundation and lays the groundwork for future validation in additional tumor models and clinical research.
In conclusion, our study highlights the importance of advanced postprocessing metrics in APTw-CEST and 2D-glucoCEST imaging. The accuracy of molecular subtyping in a BC model varies considerably depending on the postprocessing metric applied. Among the four evaluated metrics, MTR_REX_ and AREX emerged as the most effective for both APTw-CEST and 2D-glucoCEST. Nevertheless, the advantages of advanced postprocessing metrics are more pronounced in APTw-CEST compared to 2D-glucoCEST. From a clinical perspective, these findings are highly relevant, as they pave the way for noninvasive, imaging-based biomarkers for improved cancer characterization.
Supplementary information
ELECTRONIC SUPPLEMENTARY MATERIAL Supplementary Tables
The reference list from the paper itself. Each links out to its DOI / PubMed record.
- 1CEST sources (2014) CEST resources for chemical exchange saturation transfer MRI. Available via https://cest-sources.org/doku.php. Accessed 9 Dec 2024
- 2PMOD Technologies LLC (2023) PMOD: biomedical image quantification. Available via https://www.pmod.com/web/. Accessed 10 Jun 2025