Association between abdominal CT-based body composition parameters and early diabetic kidney disease in type 2 diabetes mellitus: a retrospective cross-sectional study
Yinying Tang, Xinyi Cen, Qi Dai, Hai Chen, Jie Zhang, Fangfang Zhou, Jianjun Zheng, Jingfeng Zhang

TL;DR
This study shows that CT-based body composition analysis, particularly renal sinus fat density, can help identify early diabetic kidney disease in type 2 diabetes patients.
Contribution
The study introduces CT-based renal sinus fat density as a novel imaging biomarker for early diabetic kidney disease risk stratification.
Findings
Renal sinus fat density is significantly associated with early DKD in T2DM patients.
A combined clinical-body composition model outperforms clinical-only models in predicting early DKD.
CT-based body composition analysis improves predictive performance for DKD screening.
Abstract
Early identification of diabetic kidney disease (DKD) in type 2 diabetes mellitus (T2DM) remains challenging due to limitations of conventional biomarkers. Body composition analysis using computed tomography (CT) may provide novel insights into DKD risk stratification. To investigate the association between abdominal CT-based body composition parameters and early diagnosis of DKD in patients with T2DM. This retrospective cohort study enrolled 310 patients with T2DM from the Second Hospital of Ningbo between January 2020 and December 2024. Patients were stratified into the early DKD group (n = 131) and the T2DM control group without DKD (n = 179) based on the results of renal function assessment. Using Slice-O-Matic software, we measured area, index, and radiodensity of skeletal muscle and adipose tissue depots at the L3 vertebral level on abdominal CT images. Spearman correlation…
Genes, proteins, chemicals, diseases, species, mutations and cell lines named across the full text — each resolved to its canonical identifier and authoritative record.
Click any figure to enlarge with its caption.
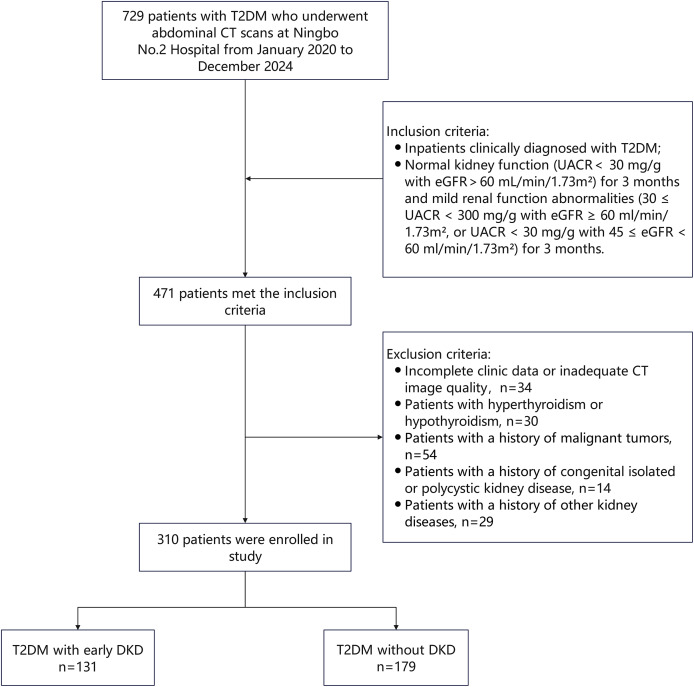 Figure 1
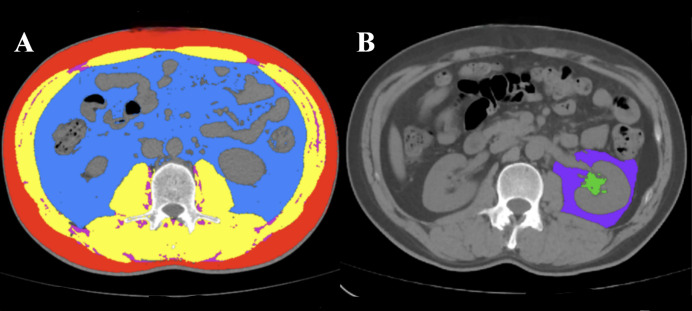 Figure 2
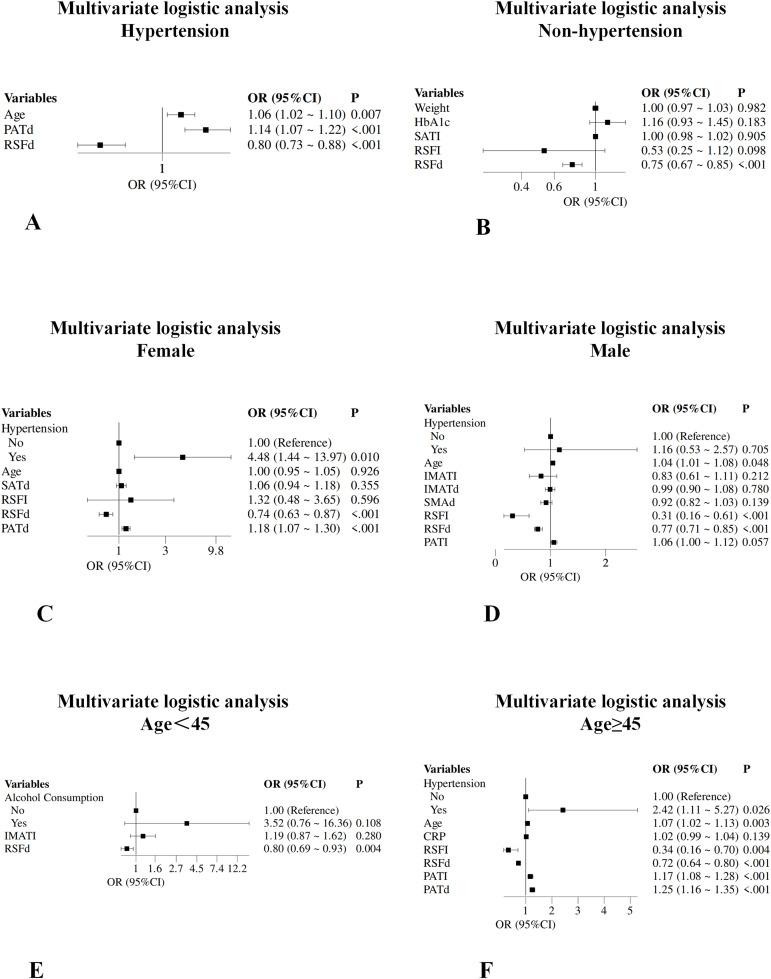 Figure 3
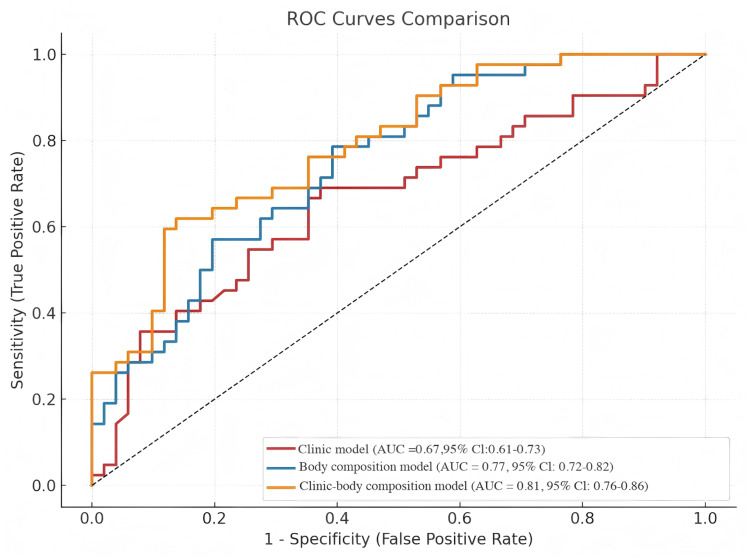 Figure 4
- —Project of National Key Clinical Specialty
- —Ningbo Key Laboratory of Digital Imaging and Medical-Engineering Interdisciplinarity
Peer Reviews
No public reviews on file for this paper yet. If you reviewed it on a platform where reviews are public (OpenReview, ICLR, NeurIPS, ICML), you can paste yours below so the community can read it here.
Videos
No videos yet. Explain this paper in a talk, walkthrough, or lecture? Add one.
Taxonomy
TopicsChronic Kidney Disease and Diabetes · Dialysis and Renal Disease Management · Cardiovascular Function and Risk Factors
Introduction
Diabetic kidney disease (DKD) represents the most devastating microvascular complication of type 2 diabetes mellitus (T2DM) and constitutes the leading cause of end-stage renal disease globally (Meir et al., 2024). Epidemiological evidence indicates that approximately 40% of T2DM patients eventually progress to DKD, with a substantial proportion advancing to end-stage renal disease, significantly compromising patient outcomes and quality of life (Umanath & Lewis, 2018). The clinical and economic burden of DKD continues to escalate worldwide, necessitating improved strategies for early detection and intervention.
Current diagnostic paradigms for DKD primarily rely on microalbuminuria detection and estimated glomerular filtration rate (eGFR) assessment (Ning et al., 2020). However, these conventional biomarkers exhibit inherent limitations in sensitivity, often failing to accurately identify early pathological changes before irreversible renal damage occurs (Thomas et al., 2009). Notably, emerging evidence suggests that selected patients with early DKD may achieve disease stabilization or even reversal through timely therapeutic interventions (Beyerstedt et al., 2025), underscoring the critical importance of establishing more sensitive and precise early diagnostic frameworks.
Obesity has been established as a pivotal risk factor for T2DM development and progression (Chandrasekaran & Weiskirchen, 2024). Compared to generalized obesity, abnormal abdominal fat distribution patterns demonstrate stronger associations with DKD occurrence in T2DM patients (Hu et al., 2016). Computed tomography (CT) technology enables precise quantification of regional fat distribution based on tissue radiodensity differences. It is widely recognized as the imaging gold standard for body composition assessment (Tolonen et al., 2021). Beyond accurate measurement of adipose tissue area and volume at various anatomical sites, CT facilitates indirect evaluation of adipose tissue quality characteristics through density analysis.
Furthermore, sarcopenia has emerged as an essential risk factor for insulin resistance, with growing recognition of its association with diabetic complications (Son et al., 2017). Recent investigations demonstrate that CT-measured adipose tissue density can indirectly reflect metabolic activity and inflammatory status of fat depots. For instance, pericoronary adipose tissue density has been validated as a non-invasive marker for coronary inflammation and cardiovascular risk assessment (Zhihong et al., 2025).
Building on this scientific foundation, the present study aimed to systematically evaluate body composition characteristics in T2DM patients using abdominal CT imaging technology. We comprehensively assessed muscle tissue and regional adipose tissue parameters, including area, indices, and radiodensity (measured in Hounsfield Units (HU), a quantitative measure of tissue density that reflects tissue quality and composition), to investigate their associations with early DKD development risk, thereby providing novel imaging-based evidence for early DKD identification and risk stratification.
Materials and Methods
Study design and participants
This retrospective cross-sectional study analyzed baseline data from T2DM patients who received inpatient care and underwent abdominal CT examination at the Second Hospital of Ningbo between January 2020 and December 2024.
Inclusion criteria: (1) T2DM diagnosis according to Chinese Diabetes Society criteria (Chinese Diabetes Society, 2025); (2) Normal renal function (urinary albumin-to-creatinine ratio (UACR) < 30 mg/g with eGFR ≥ 60 mL/min/1.73 m^2^) sustained for ≥3 months, or mild renal dysfunction (30 ≤ UACR < 300 mg/g with eGFR ≥ 60 ml/min/1.73 m^2^, or UACR < 30 mg/g with 45 ≤ eGFR < 60 ml/min/1.73 m^2^) sustained for ≥3 months (Kidney Disease: Improving Global Outcomes (KDIGO) Diabetes Work Group, 2022). Exclusion criteria: (1) Incomplete clinic data or inadequate CT image quality; (2) Patients with hyperthyroidism or hypothyroidism; (3) Patients with a history of malignant tumors; (4) Patients with a history of congenital isolated or polycystic kidney disease; (5) Patients with a history of other kidney diseases.
Based on these criteria, 310 eligible T2DM patients were enrolled and stratified into two groups according to renal function status: T2DM without DKD group (normal renal function: UACR < 30 mg/g with eGFR ≥ 60 mL/min/1.73 m^2^, n = 179) and T2DM with early DKD group (mild renal dysfunction: 30 ≤ UACR < 300 mg/g with eGFR ≥ 60 ml/min/1.73 m^2^, or UACR < 30 mg/g with 45 ≤ eGFR < 60 ml/min/1.73 m^2^, n = 131). Figure 1 shows the patient selection flowchart.
The patient selection flowchart.CT, computed tomography; DKD, diabetic kidney disease; T2DM, type 2 diabetes mellitus.
The study protocol received approval from the Ethics Committee of the Second Hospital of Ningbo (Ethics approval number: PJ-NBEY-KY-2025-014-01). Informed consent was waived due to the retrospective nature of the study.
Clinical data collection
Demographic characteristics and clinical data of patients were collected through the hospital’s electronic medical record system, encompassing baseline characteristics (sex, age, height, weight, body mass index (BMI), history of hypertension, smoking status, alcohol use, and current medications including SGLT2 inhibitors, metformin, alpha-glucosidase inhibitors, insulin secretagogue, thiazolidinediones, insulin, and DPP-4 Inhibitors) and laboratory parameters, including renal function (estimated glomerular filtration rate (eGFR), urea, uric acid, and urinary albumin-to-creatinine ratio (UACR)), lipid profile (total cholesterol (TC), triglycerides (TG), low-density lipoprotein cholesterol (LDL-C), and high-density lipoprotein cholesterol (HDL-C)), inflammatory markers (high-sensitivity C-reactive protein (CRP)), and glycemic control indicators (glycated hemoglobin (HbA1c) and serum C-peptide).
BMI was calculated as weight (kg) divided by height squared (m^2^). eGFR was determined using the Chronic Kidney Disease Epidemiology Collaboration (CKD-EPI) equation.
CT imaging protocol
Abdominal CT examinations were performed using a 96-slice dual-source dual-detector CT scanner (SOMATOM Force, Siemens Healthineers, Erlangen, Germany). Standardized scanning parameters included: tube voltage 110 kV, automatic tube current modulation, pitch 1.2 mm, slice spacing 5 mm, slice thickness 5 mm, matrix 512 × 512, scan field of view (SFOV) 50 cm, display field of view (DFOV) 39 cm, and gantry rotation time 2.88 s. Patients were positioned supine and examined during end-inspiratory breath-hold for unenhanced abdominal CT acquisition.
Body composition analysis
A trained radiologist, blinded to clinical information, used Slice-O-Matic software (version 5.0, TomoVision, Montreal, Canada) to measure skeletal muscle (SM), intermuscular adipose tissue (IMAT), visceral adipose tissue (VAT) and subcutaneous adipose tissue (SAT) at the mid-L3 vertebral level, and to measure perirenal adipose tissue (PAT) and renal sinus fat (RSF) at the level of the renal artery entering the renal sinus (Cheng et al., 2018; Wagner et al., 2012). The measurements were performed using semi-automatic segmentation based on CT density thresholds. For both PAT and RSF, the left and right kidneys were contoured separately, and the average values were calculated for analysis.
Measured parameters included: (1) SM: Psoas, erector spinae, quadratus lumborum, transverse abdominis, external oblique, internal oblique, and rectus abdominis muscles; (2) IMAT: Fat within abdominal wall skeletal muscle interfaces; (3) VAT: Intra-abdominal fat surrounding organs; (4) SAT: Fat between skin and abdominal wall muscles; (5) PAT: Fat between anterior and posterior renal fascia; (6) RSF: Adipose tissue within the renal sinus. Tissue density thresholds: SM: −29 to 150 HU; VAT, PAT, RSF: −150 to −50 HU; SAT, IMAT: −190 to −30 HU (Fan et al., 2024; Chen et al., 2021).
Body composition indices were calculated by dividing cross-sectional tissue areas by height squared, yielding visceral adipose tissue index (VATI), subcutaneous adipose tissue index (SATI), intermuscular adipose tissue index (IMATI), skeletal muscle index (SMI), perirenal adipose tissue index (PATI), and renal sinus fat index (RSFI). Mean tissue radiodensity values were simultaneously recorded. The mean radiodensities were collected from the same regions of interest used for body composition areas (subcutaneous adipose tissue density (SATd), visceral adipose tissue density (VATd), intermuscular adipose tissue (IMATd), skeletal muscle area density (SMAd), perirenal adipose tissue density (PATd), and renal sinus fat density (RSFd)).
To assess measurement reliability, an independent senior radiologist performed duplicate measurements on randomly selected images from 30 patients for inter-observer agreement evaluation. The body composition drawing is shown in Fig. 2.
Representative cross-sectional CT images and muscle and fat of each part.(A) SAT (red), VAT (blue), SM (yellow) and IIMAT (magenta); (B) RSF (green) and PAT (purple).
Statistical analysis
Statistical analyses were performed using Zstats software (www.zstats.net) and R software (version 4.3.3). The normality of data distribution was assessed using the Kolmogorov-Smirnov test. For descriptive statistics, normally distributed continuous variables were presented as mean ± standard deviation ( \documentclass[12pt]{minimal} \usepackage{amsmath} \usepackage{wasysym} \usepackage{amsfonts} \usepackage{amssymb} \usepackage{amsbsy} \usepackage{upgreek} \usepackage{mathrsfs} \setlength{\oddsidemargin}{-69pt} \begin{document} {{\bar{\rm x}}\pm s}\end{document} ), non-normally distributed variables as median (interquartile range) [M(Q1, Q3)], and categorical variables as frequencies (percentages). Mean imputation was applied to continuous variables exhibiting less than 5% missing data. In terms of between-group comparisons, the independent samples t-test was used for normally distributed continuous variables, the Mann-Whitney U test for non-normally distributed variables, and the \documentclass[12pt]{minimal} \usepackage{amsmath} \usepackage{wasysym} \usepackage{amsfonts} \usepackage{amssymb} \usepackage{amsbsy} \usepackage{upgreek} \usepackage{mathrsfs} \setlength{\oddsidemargin}{-69pt} \begin{document} \chi^2\end{document} test or Fisher’s exact test for categorical variables. Correlation analysis was conducted using Spearman correlation to evaluate the associations between body composition parameters and renal function indicators (eGFR, UACR). The criteria for correlation strength were as follows: |r| ≥ 0.9 indicated a strong correlation, 0.7 ≤ |r| < 0.9 a moderate-to-strong correlation, 0.4 ≤ |r| < 0.7 a moderate correlation, 0.2 ≤ |r| < 0.4 a weak correlation, and |r| < 0.2 a negligible correlation. For regression analysis, variables with a p-value of less than 0.05 in the univariate analysis were included in the multivariate logistic regression using stepwise selection to identify independent risk factors for early DKD. Considering potential influences of gender, age (<45, ≥45), and hypertension status on body composition, stratified analyses were performed. The performance of the predictive model was evaluated by constructing receiver operating characteristic (ROC) curves and calculating the area under the curve (AUC). Statistical significance of the difference between AUC using various indicators was calculated by DeLong’s test (Table S1). Intraclass correlation coefficients (ICCs) were used to assess the reproducibility of inter-observer measurements. The interpretation of ICC values was as follows: <0.50 indicated poor agreement, 0.50–0.75 moderate agreement, 0.75–0.90 good agreement, and >0.90 excellent agreement. All statistical tests were two-sided, with a P-value of less than 0.05 considered statistically significant.
Results
Baseline characteristics
The study cohort comprised 310 T2DM patients: 189 males (61.0%) and 121 females (39.0%), with a mean age of 54 years. According to renal function status, the study included two groups: early DKD (n = 131) and non-DKD (n = 179). Baseline comparisons revealed that early DKD patients were significantly older (58.00 vs 52.00 years, P < 0.001) with higher hypertension prevalence (64.12% vs 39.11%, P < 0.001). Body composition analysis revealed that patients with early DKD had significantly higher VATII (56.02 vs 51.76, P = 0.049), IMAT (3.42 vs 3.00, P = 0.023), RSFI (1.21 vs 0.85, P < 0.001), and PATI (16.37 vs 13.52, P = 0.002) compared to the non-DKD group. Other clinical biochemical parameters and remaining body composition variables showed no significant between-group differences (P > 0.05). Detailed baseline characteristics are presented in Table 1.
Table 1: Baseline characteristics of the population.
Inter-observer reliability assessment
Intraclass correlation coefficients (ICC) with 95% confidence intervals for body composition parameters demonstrated excellent reproducibility: VATI (ICC = 0.967, 95% CI [0.932–0.984]); VATd (ICC = 0.931, 95% CI [0.862–0.967]); SATI (ICC = 1.000, 95% CI [1.000–1.000]); SATd (ICC = 0.995, 95% CI [0.990–0.998]); IMATI (ICC = 0.960, 95% CI [0.919–0.981]); IMATd (ICC = 0.885, 95% CI [0.775–0.944]); SMI (ICC = 0.949, 95% CI [0.897–0.975]); SMAd (ICC = 0.998, 95% CI [0.996–0.999]); RSFI (ICC = 0.968, 95% CI [0.936–0.985]); RSFd (ICC = 0.976, 95% CI [0.950–0.988]); PATI (ICC = 0.999, 95% CI [0.998–1.000]); PATd (ICC = 0.973, 95% CI [0.945–0.987]). All body composition parameters exhibited excellent inter-observer measurement reproducibility and reliability (ICC > 0.75). For details, see Table S2.
Risk factor analysis for early DKD
Univariate logistic regression analysis identified significant associations with early DKD for: age (OR = 1.03, 95% CI [1.01–1.05], P = 0.001), hypertension history (OR = 2.78, 95% CI [1.75–4.44], P < 0.001), CRP (OR = 1.02, 95% CI [1.01–1.03], P = 0.014), IMATI (OR = 1.13, 95% CI [1.03–1.23], P = 0.008), IMATd (OR = 0.95, 95% CI [0.92–0.99], P = 0.025), SMAd (OR = 0.97, 95% CI [0.94–0.99], P = 0.036), RSFI (OR = 1.65, 95% CI [1.23–2.21], P < 0.001), RSFd (OR = 0.85, 95% CI [0.80–0.89], P < 0.001), and PATI (OR = 1.05, 95% CI [1.02–1.08], P = 0.001).
Multivariate logistic regression analysis using stepwise selection identified four independent risk factors for early DKD: age (OR = 1.03, 95% CI [1.01–1.06], P = 0.044), CRP (OR = 1.02, 95% CI [1.01–1.04], P = 0.005), RSFI (OR = 0.50, 95% CI [0.30–0.85], P = 0.010), and RSFd (OR = 0.79, 95% CI [0.74–0.85], P < 0.001) (Table 2).
Table 2: Logistic regression analysis of early DKD in T2DM patients.
Subgroup analysis
Multivariate logistic regression subgroup analysis showed that RSFd had a consistent protective effect across all subgroups. Additionally, in male patients, age and PATI (OR = 1.06, P = 0.057) were independent risk factors; in females, hypertension (OR = 4.48, P = 0.010) and PATd (OR = 1.18, P < 0.001) were independent risk factors. In the hypertension stratification, the non-hypertensive group had only RSFd as a protective factor; in the hypertensive group, besides RSFd, age (OR = 1.06, P = 0.007) and PATd (OR = 1.14, P < 0.001) were risk factors. Age stratification showed that in patients aged ≥45 years, besides RSFd (OR = 0.72, P < 0.001), hypertension, age, PATI, and PATd were all risk factors (Fig. 3).
Subgroup analysis forest plot.The forest plot shows the predictive ability of independent factors obtained by multivariate survival analysis in hypertensive (A), non-hypertensive (B), female (C), male (D), age < 45 (E), and age ≥ 45 (F) subgroups. PATd, perirenal adipose tissue density; BMI, body mass index; SATI, subcutaneous adipose tissue index; RSFI, renal sinus fat index; RSFd, renal sinus fat density; PATI, perirenal adipose tissue index; SATd, subcutaneous adipose tissue density; CRP, high-sensitivity C-reactive protein; VATI, visceral adipose tissue index; IMATI, intermuscular adipose tissue index; IMATd, intermuscular adipose tissue; SMAd, skeletal muscle area density.
Correlations between body composition parameters and renal function
Spearman correlation analysis showed that RSTd was weakly negatively correlated with UACR (r = −0.31, P < 0.001), while RSFI was weakly positively correlated with UACR (r = 0.20, P < 0.001). Additionally, SMAd was weakly negatively correlated with UACR (r = −0.17, P = 0.002), and PATI was weakly positively correlated with UACR (r = 0.18, P = 0.001). Regarding eGFR, MATI showed a weak negative correlation (r = −0.13, P = 0.023), while MATd showed a marginal negative correlation (r = −0.10, P = 0.067). VATI was weakly positively correlated with UACR (r = 0.12, P = 0.035). No other adipose or muscle composition indicators showed statistically significant correlations with UACR or eGFR in this dataset (Fig. S1).
Multiple linear regression analysis after adjusting for confounding variables demonstrated that RSFd was the only parameter maintaining significant associations with both renal function indicators: negative correlation with UACR (β = −1.88, P < 0.001) and positive correlation with eGFR (β = 0.22, P = 0.017) (Table 3).
Table 3: Multiple linear regression analysis for renal function indicators.
Predictive model development and validation
Based on multivariate logistic regression results, three predictive models were constructed: body composition parameter model, clinical parameter model, and combined clinical-body composition model. ROC curve analysis demonstrated: Clinical model AUC: 0.67 (95% CI [0.61–0.73]); Body composition parameter model AUC: 0.77 (95% CI [0.72–0.82]); Combined model AUC: 0.81 (95% CI [0.76–0.86]). The combined model achieved significantly superior predictive performance compared to individual models, indicating that body composition parameters substantially enhance early DKD risk prediction capability (See Fig. 4 and Table 4).
ROC curves for predicting early DKD in T2DM patients using clinical parameters and body composition parameters.ROC, receiver operating characteristic; AUC, the area under ROC curve.
Table 4: Predictive value of clinical parameters and body composition parameters for early DKD in T2DM patients.
The AUC was compared among three models using DeLong’s test. The results demonstrated that the body composition parameter model and the combined clinical-body composition model exhibited comparable predictive performance (Table S1).
Discussion
This systematic abdominal CT body composition analysis represents the first study to identify RSFd as being independently associated with early DKD in patients with T2DM. Our findings demonstrate that lower RSFd is significantly associated with early DKD (OR = 0.79, P < 0.001). This association remained consistent across subgroups stratified by gender, age, and hypertension status, supporting its potential utility as an imaging biomarker.
RSF, situated within the renal sinus and fibrous membrane (Liu, Sun & Kong, 2019; Irazabal & Eirin, 2016), may link obesity to DKD by compressing sinus structures, potentially raising blood pressure and impairing renal function. This view is supported by Spit et al. (2020) who first linked higher RSF volume in T2DM patients to reduced eGFR and increased renal vascular resistance, suggesting a role in hypertension. These findings are consistent with our study, wherein increased renal sinus fat was an independent risk factor for early DKD.
The radiodensity of adipose tissue measured by CT is a reliable indicator of its biological function. White adipose tissue, as the primary energy storage organ, exhibits abnormal intracellular lipid accumulation when its function is impaired. This leads to an increased proportion of lipids per unit volume, while high-density components such as water and proteins relatively decrease, ultimately resulting in lower CT values (Wang et al., 2023; Proença et al., 2014). Therefore, the reduced renal sinus fat density observed in early DKD patients in this study likely reflects the pathological state of lipid accumulation and functional disorder. In addition, lipid overload can also lead to changes in renal sinus fat density through a series of complex pathophysiological pathways, including oxidative stress, mitochondrial dysfunction, inflammation, and fibrosis (Santillana et al., 2023).
Notably, our findings contrast with Liao et al. (2024), who reported that elevated RSFd increased T2DM renal dysfunction risk. These differences may stem from several methodological variations: in terms of the population, this study was limited to early DKD patients, whereas Liao et al.’s (2024) study included participants with a broader range of renal function impairment; regarding thresholds, this study defined RSF in the range of −150 to −50 HU, while Liao et al. (2024) used a wider range of −190 to −30 HU, which could affect density values; the study endpoints also fundamentally differed, as this study was cross-sectional, aiming to explore the association between RSFd and early DKD, whereas Liao et al. (2024) conducted a longitudinal analysis to assess the predictive value of RSFd for the risk of chronic kidney disease progression. Additionally, Fan et al. (2024) identified associations between reduced skeletal muscle density and early DKD but did not incorporate RSF parameters, resulting in different conclusions.
Our investigation revealed that conventional BMI was not an independent risk factor for early DKD in T2DM patients (P > 0.05), contrasting with Garofalo et al. (2017). This discrepancy may be attributed to BMI limitations as a global obesity indicator: inability to distinguish muscle from adipose tissue or quantify specific fat distribution patterns and quality characteristics (Li et al., 2022). This finding emphasizes that early DKD development may relate to the heterogeneous distribution of specific adipose depots rather than overall obesity status.
Regarding abdominal fat distribution and renal function relationships, our study confirmed mild correlations between VAT and PAT with renal function indicators. However, neither emerged as an independent risk factor for early DKD. VAT induces insulin resistance, mitochondrial dysfunction, and oxidative stress through abundant adipokine production, ultimately causing renal injury (Ziegler & Scheele, 2024; Hall et al., 2021). PAT, representing specialized VAT surrounding kidneys, may demonstrate closer DKD associations due to unique anatomical positioning and developmental heterogeneity (Zbrzeźniak-Suszczewicz et al., 2025). However, our results suggest VAT and PAT may indirectly influence renal function through interactions with multiple metabolic factors rather than directly causing early DKD.
We observed weak negative correlations between SMI and eGFR, and between SMAd and UACR, suggesting associations between muscle loss, muscle fat infiltration, and renal dysfunction, consistent with previous research (Avesani et al., 2023; Huang et al., 2022). However, these correlations were relatively weak, possibly related to our study population comprising early DKD patients with relatively slight renal function indicator variations, some within normal ranges.
Our established multifactor predictive model incorporated four independent risk factors: age, CRP, RSFI, and RSFd. Notably, RSFI exhibited opposite association directions in univariate vs multivariate analyses: univariate analysis showed elevated RSFI increased DKD risk (OR = 1.65), while multivariate analysis yielded OR = 0.50, suggesting RSFI effects on early DKD risk are modulated by other confounding factors (Kaneko et al., 2024).
CRP, as an inflammatory marker, may exacerbate renal tissue injury and fibrosis through transforming growth factor-β (TGF-β)/Smad3 signaling pathways (Tang et al., 2022). Age, as a non-modifiable risk factor, demonstrates well-established associations with DKD development (Fabre & Rangel, 2024). These findings further support the critical roles of inflammation and aging in early DKD pathogenesis.
Subgroup analyses demonstrated RSFd as an independent risk factor across all subgroups, emphasizing stable predictive value. Additionally, in hypertensive, age ≥ 45 and female patient subgroups, PATd emerged as an independent risk factor, suggesting that in patients with hypertension, age ≥ 45, and in female patients, special attention should be paid to the elevation of PATd, potentially related to adipose tissue-associated inflammatory mechanisms (Kashiwagi, 2025).
Through ROC curve analysis, we observed that the model based only on clinical parameters produced an AUC of 0.67 (95% CI [0.61–0.73]). In contrast, the body composition parameter model exhibited meaningfully higher discriminative performance, with an AUC of 0.77 (95% CI [0.72–0.82]). Most importantly, the combined clinical–body composition model achieved the highest predictive accuracy, with an AUC of 0.81 (95% CI [0.76–0.86]). These findings underscore the value of incorporating body composition metrics into conventional clinical models to improve early detection of DKD in T2DM patients.
Several limitations warrant acknowledgment: First, although we ensured that the selected patients did not have COVID-19 in their discharge diagnoses, all study subjects were recruited during the COVID-19 pandemic, a period of universal susceptibility. Coupled with evidence of poorer outcomes in chronic kidney disease patients with COVID-19, this contextual factor may potentially influence the study results (Chen et al., 2020; Yang et al., 2020). Second, this single-center retrospective study has a limited sample size, and its models lack internal validation; these factors may collectively compromise the generalizability of the findings. Therefore, future multicenter, large-scale prospective studies or external validation are required to further confirm the findings of this research. Third, the regression models developed in this study were not subjected to internal validation, which may lead to over-optimistic estimates of their performance; therefore, external validation is required to confirm their generalizability. Fourth, while CT represents the gold standard for body composition assessment, the inherent ionizing radiation exposure limits its routine application in healthy populations. However, opportunistic body composition evaluation in patients receiving abdominal CT for other medical indications provides significant clinical value. Finally, inclusion criteria based on renal dysfunction may miss occult DKD patients with negative laboratory findings; future research could incorporate renal biopsy pathological diagnosis for enhanced study design.
Conclusions
Through systematic abdominal CT body composition analysis, this study found that renal sinus fat density is an independent factor associated with the risk of early diabetic nephropathy in patients with type 2 diabetes. The multifactorial model, which includes RSFd, RSFI, age, and CRP, performed well and may provide potential imaging indicators for the identification and risk assessment of early diabetic nephropathy. Despite certain limitations, this study offers new insights for the screening of early diabetic nephropathy. Future multicenter prospective studies are necessary to validate the clinical applicability of these findings and further explore the role of body composition parameters in the diagnosis and intervention strategies of early diabetic nephropathy.
Supplemental Information
10.7717/peerj.20535/supp-1Supplemental Information 1Univariate correlation analysis of eGFR and UACR with body composition parameters.(A) Correlation analysis between eGFR and body composition. (B) Correlation analysis between UACR and body composition.
10.7717/peerj.20535/supp-2Supplemental Information 2Comparing the AUC under different ROC curves using DeLong’s test.The differences in predictive performance (AUC) between three different models (Clinic, Body composition, and Combined), along with their 95% confidence intervals and corresponding P-values.
10.7717/peerj.20535/supp-3Supplemental Information 3Intraclass correlation coefficients.ICC: Intraclass correlation coefficients; All body composition parameters exhibited excellent inter-observer measurement reproducibility and reliability (ICC >0.75).
10.7717/peerj.20535/supp-4Supplemental Information 4Original Dataset.The raw anonymized data underlying all analyses of this study, including all subjects’ basic clinical indicators, body composition parameters, and renal function assessment results.
10.7717/peerj.20535/supp-5Supplemental Information 5Interpret numerical values.An explanation of the numbers in the categorical variables.
10.7717/peerj.20535/supp-6Supplemental Information 6STROBE Documentation.
The reference list from the paper itself. Each links out to its DOI / PubMed record.
- 1Avesani CM de Abreu AM Ribeiro HSB Stenvinkel PTB Sabatino A Lindhoim B Muscle fat infiltration in chronic kidney disease: a marker related to muscle quality, muscle strength and sarcopenia Journal of Nephrology 202336389591010.1007/s 40620-022-01553-036719556 PMC 10090035 · doi ↗ · pubmed ↗
- 2Beyerstedt S Franco ML Carlos AKG Arjona J Josefi-Rocha GR Barbosa BS Balby-Rocha MTA da Silva AF Alves TMR Mariano MO Klein MCS RangelÉB Combining sodium-glucose co-transporter-2 inhibitor with mesenchymal stem cells and brown adipose tissue (BAT) and white adipose tissue (WAT) transplantation to mitigate the progression of diabetic kidney disease: a pre-clinical approach Stem Cell Research & Therapy 202516125410.1186/s 13287-025-04358-740394690 PMC 12093872 · doi ↗ · pubmed ↗
- 3Chandrasekaran P Weiskirchen R The role of obesity in type 2 diabetes mellitus—an overview International Journal of Molecular Sciences 2024253188210.3390/ijms 2503188238339160 PMC 10855901 · doi ↗ · pubmed ↗
- 4Chen X Mao Y Hu J Han S Gong L Luo T Yang S Qing H Wang Y Du Z Mei M Zheng L Lv X Tang Y Zhao Q Zhou Y He JC Li Q Wang Z Perirenal fat thickness is significantly associated with the risk for development of chronic kidney disease in patients with diabetes Diabetes 202170102322233210.2337/db 20-103134593536 · doi ↗ · pubmed ↗
- 5Chen Y Yang D Cheng B Chen J Peng A Yang C Liu C Xiong M Deng A Zhang Y Zheng L Huang K Clinical characteristics and outcomes of patients with diabetes and COVID-19 in association with glucose-lowering medication Diabetes Care 20204371399140710.2337/dc 20-066032409498 · doi ↗ · pubmed ↗
- 6Cheng X Zhang Y Wang C Deng W Wang L Duanmu Y Li K Yan D Xu L Wu C Shen W Tian W The optimal anatomic site for a single slice to estimate the total volume of visceral adipose tissue by using the quantitative computed tomography (QCT) in Chinese population European Journal of Clinical Nutrition 201872111567157510.1038/s 41430-018-0122-129559725 PMC 6329297 · doi ↗ · pubmed ↗
- 7Chinese Diabetes Society Guideline for the prevention and treatment of diabetes mellitus in China (2024 edition)Chinese Journal of Diabetes 2025171613910.3760/cma.j.cn 115791-20241203-00705 · doi ↗
- 8Fabre L RangelÉB Age-related markers and predictors of diabetic kidney disease progression in type 2 diabetes patients: a retrospective cohort study Therapeutic Advances in Endocrinology and Metabolism 2024152042018824124294710.1177/2042018824124294738585445 PMC 10999127 · doi ↗ · pubmed ↗