Deep learning with satellite images enables high-resolution income estimation: A case study of Buenos Aires
Nicolás F. Abbate, Leonardo Gasparini, Franco Ronchetti, Facundo M. Quiroga, Krishna Vadrevu, Beata Calka, Beata Calka, Beata Calka

TL;DR
This paper shows how satellite images and deep learning can create detailed income maps, helping policymakers in Buenos Aires and beyond.
Contribution
The study introduces a high-resolution income estimation model using satellite imagery and machine learning.
Findings
The model achieved an R2 score of 0.878 in predicting household incomes in Buenos Aires.
The spatial resolution of the model is over 20 times finer than existing methods.
The approach can generate income maps for any time period using arbitrary satellite images.
Abstract
High-resolution income data is crucial for informing policy decisions as it allows policymakers to better understand the distribution of wealth and poverty. However, obtaining this information is often cost-prohibitive, especially in developing countries. We evaluate the potential of using high-resolution satellite imagery and machine learning techniques to create income maps with a high level of geographic detail. We train a neural network with satellite images from the Metropolitan Area of Buenos Aires (Argentina) and 2010 census data to estimate per capita income at a 50x50 meter resolution for 2013, 2018 and 2022. The model, based on the EfficientNetV2 architecture, demonstrates strong predictive accuracy for household incomes (R2 = 0.878), achieving a spatial resolution over 20 times finer than existing methods in the literature. The model also allows estimating income maps for…
Genes, proteins, chemicals, diseases, species, mutations and cell lines named across the full text — each resolved to its canonical identifier and authoritative record.
Click any figure to enlarge with its caption.
 Figure 1
 Figure 2
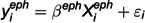 Figure 3
 Figure 4
 Figure 5
 Figure 6
 Figure 7
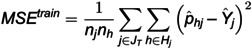 Figure 8
 Figure 9
 Figure 10
 Figure 11
 Figure 12
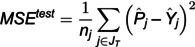 Figure 13
 Figure 14
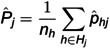 Figure 15
 Figure 16
 Figure 17
 Figure 18
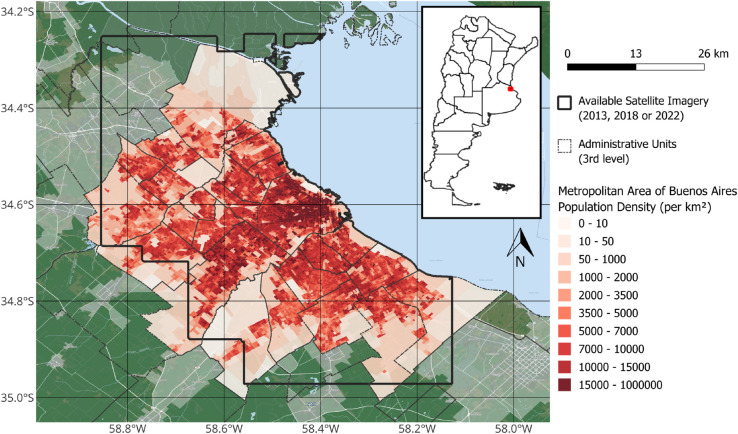 Figure 19
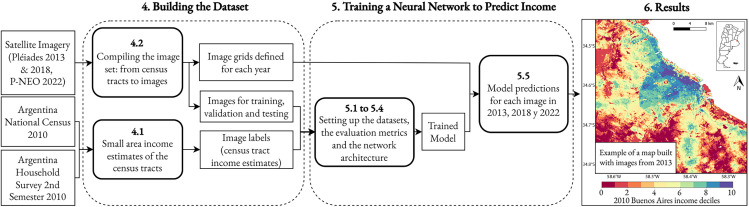 Figure 20
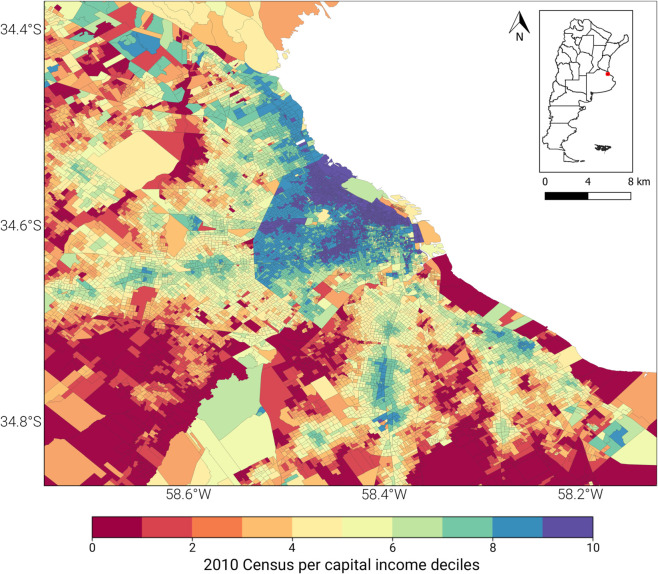 Figure 21
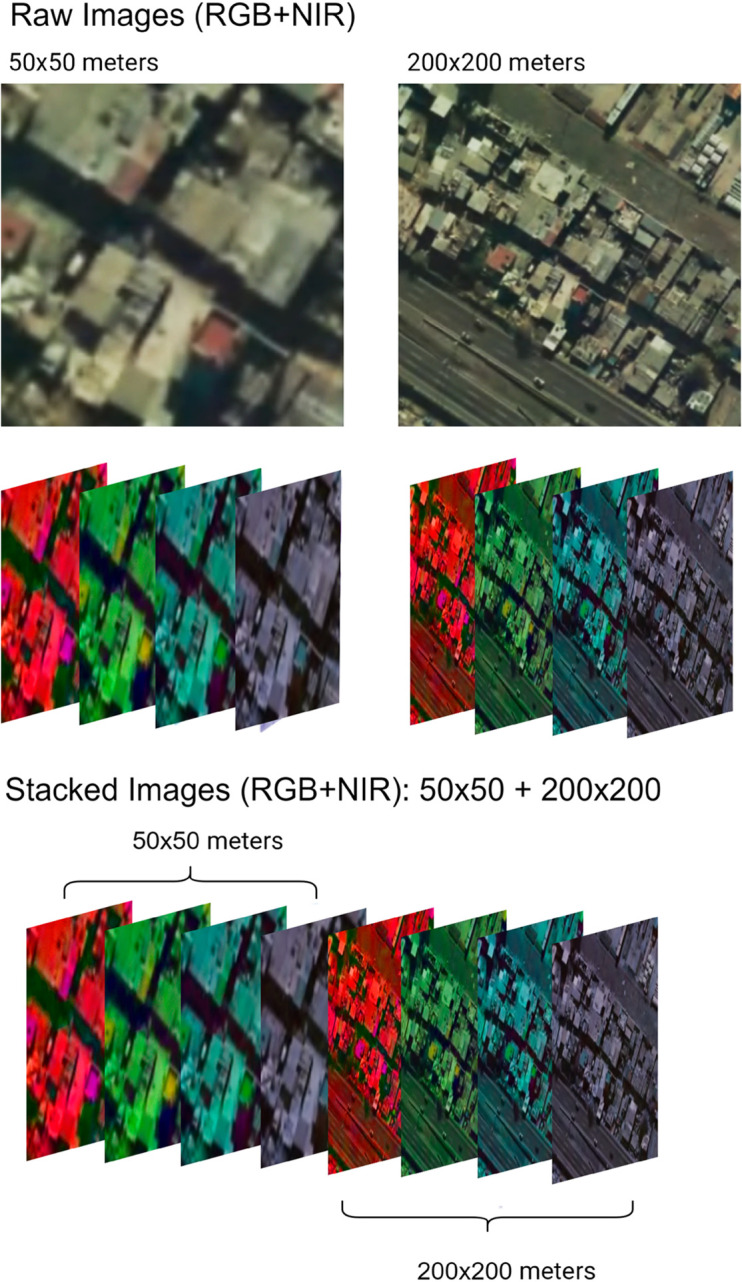 Figure 22
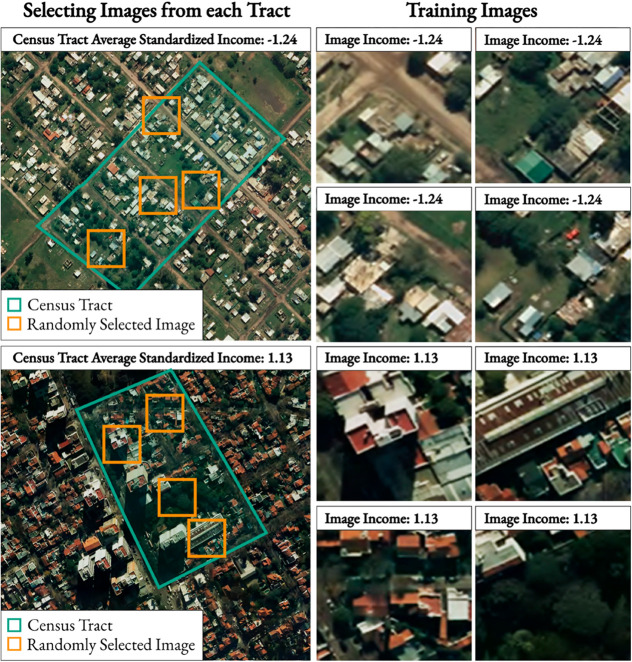 Figure 23
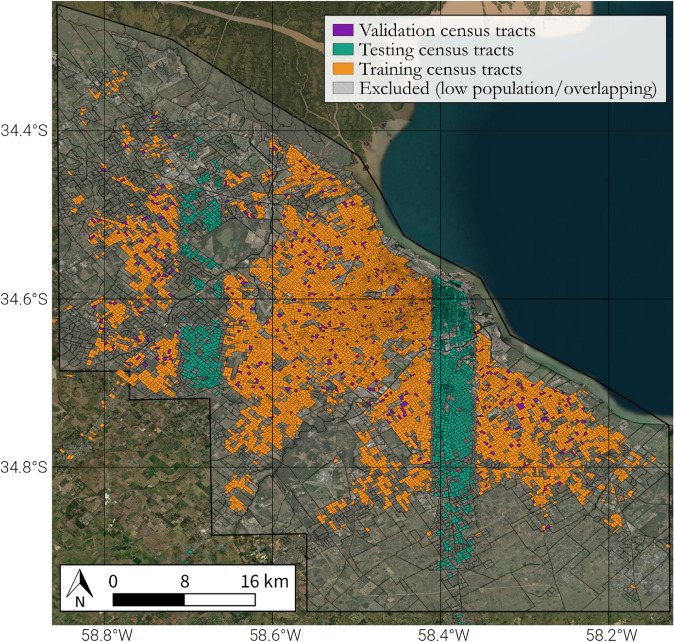 Figure 24
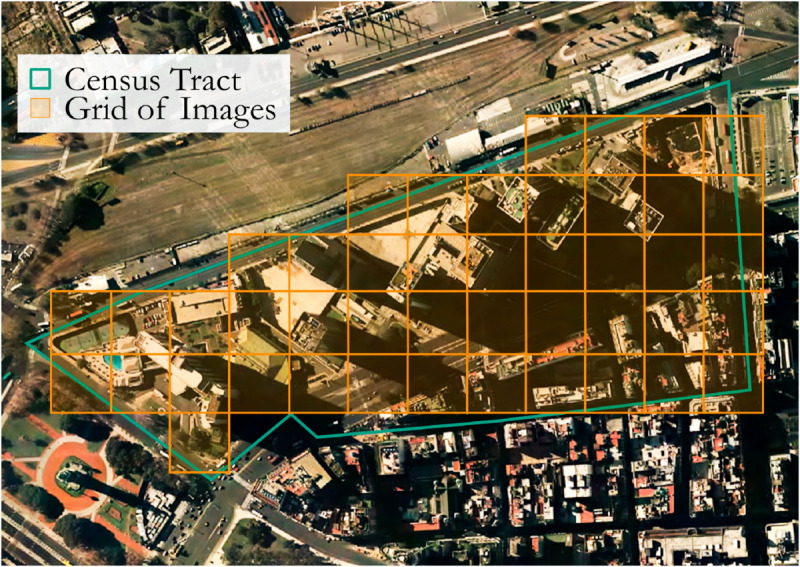 Figure 25
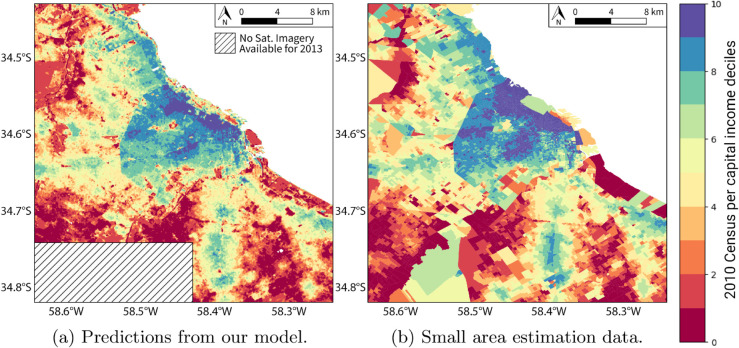 Figure 26
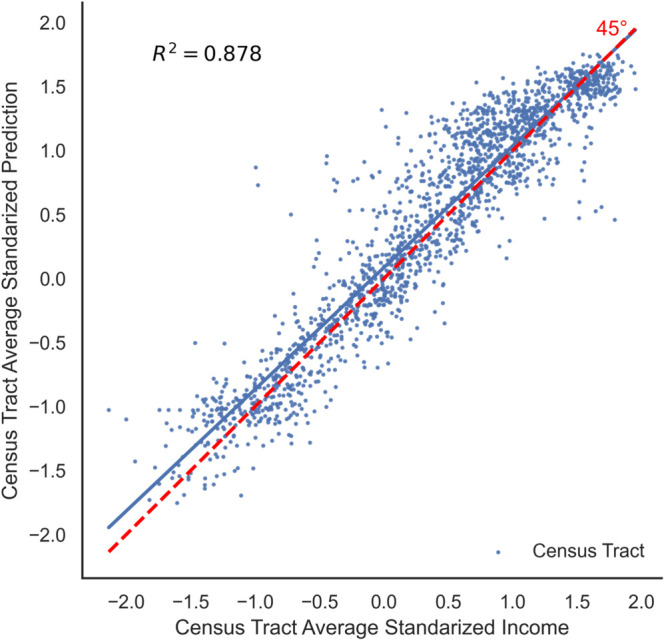 Figure 27
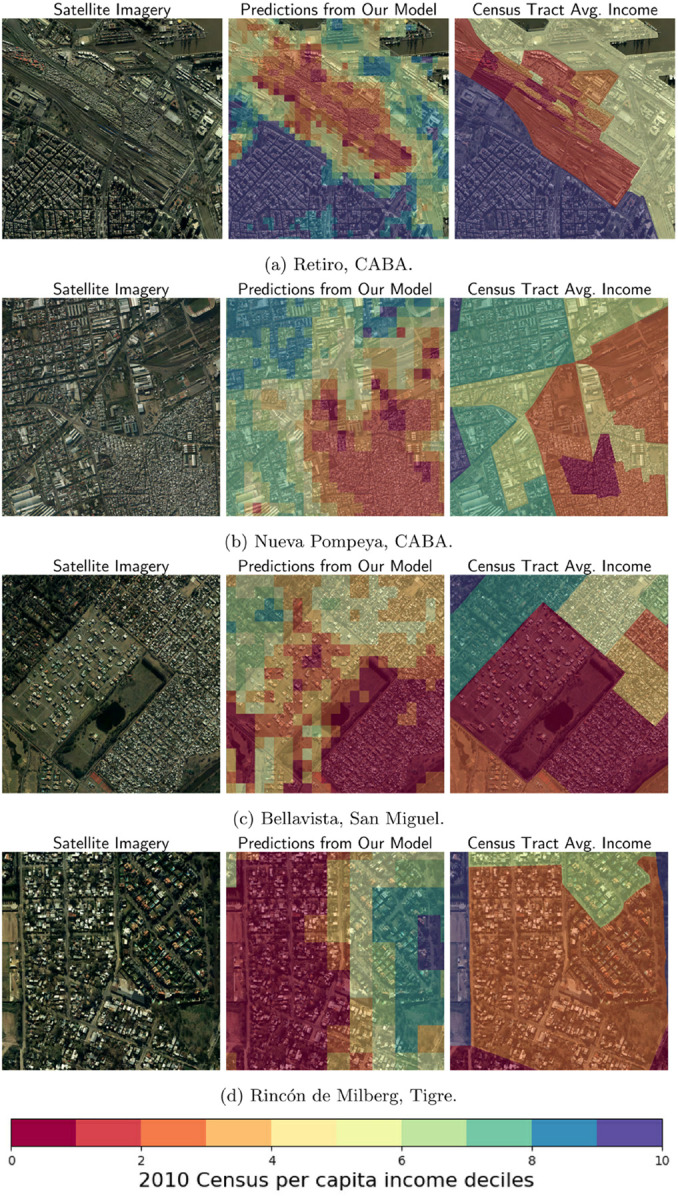 Figure 28
 Figure 29
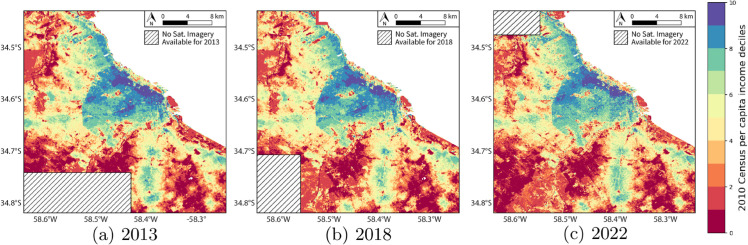 Figure 30
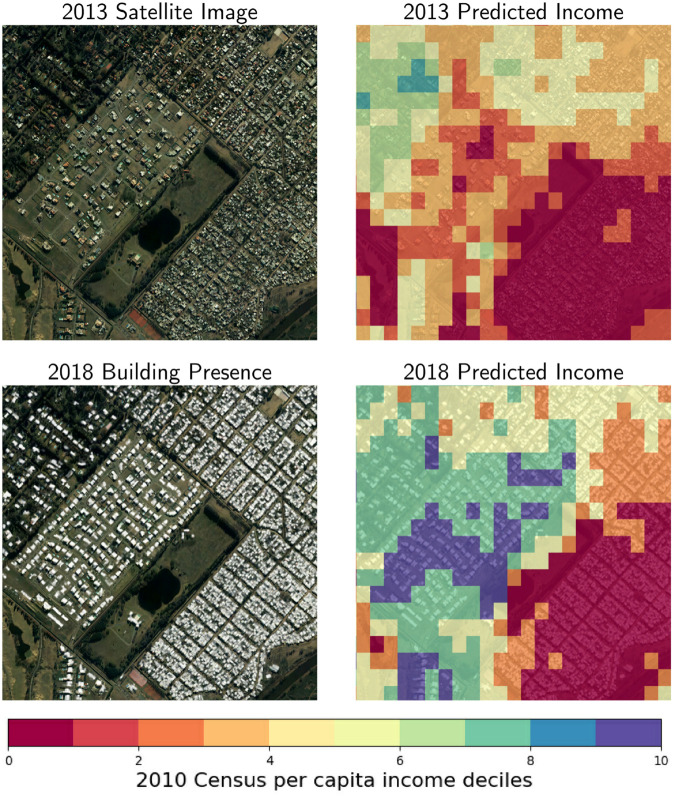 Figure 31
 Figure 32
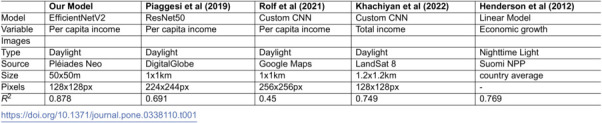 Figure 33
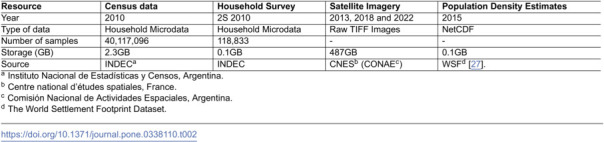 Figure 34
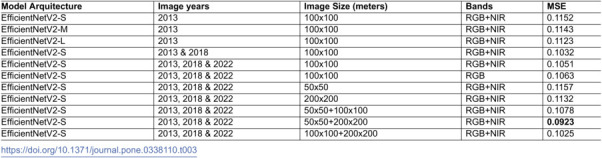 Figure 35
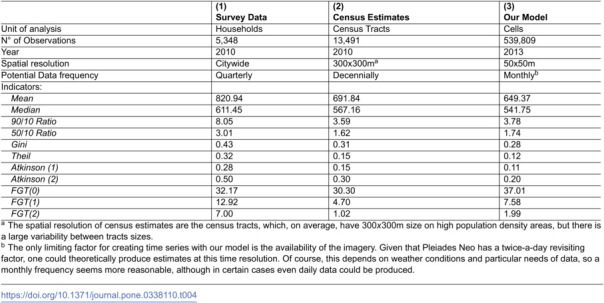 Figure 36
Peer Reviews
No public reviews on file for this paper yet. If you reviewed it on a platform where reviews are public (OpenReview, ICLR, NeurIPS, ICML), you can paste yours below so the community can read it here.
Videos
No videos yet. Explain this paper in a talk, walkthrough, or lecture? Add one.
Taxonomy
TopicsImpact of Light on Environment and Health · Income, Poverty, and Inequality · Remote-Sensing Image Classification