Comparative FT-IR Spectroscopy Salivary Profiles of University Students: E‑Cigarette Users vs Nonusers
Camila Lopes Ferreira, Emanuelly Caroline dos Santos Rocha, Yasmin Ferreira Azevedo dos Reis, Raphael Zanon Guimarães, Sara Maria Santos Dias da Silva, Rodrigo Teodoro Gomes de Paiva, Jean Patrick dos Santos Moraes, Laurita dos Santos, Luis Felipe das Chagas e Silva de Carvalho

TL;DR
This study used infrared spectroscopy to compare saliva samples from e-cigarette users and nonusers, finding detectable biochemical differences that may affect oral health.
Contribution
The study demonstrates that e-cigarette use is associated with measurable changes in salivary composition, particularly in protein and lipid profiles.
Findings
E-cigarette users showed a unique spectral band at 3273 cm–1 and shifted peaks in the 3050–2800 cm–1 region.
The amide region (1720–1490 cm–1) showed altered protein peaks in users with moderate classification accuracy.
The fingerprint region (1200–900 cm–1) showed minor intensity differences but no clear separation between groups.
Abstract
This study investigated whether the use of e-cigarettes induces detectable alterations in salivary composition through Fourier-transform infrared spectroscopy (FT-IR). Saliva samples were collected from 60 young university students (30 e-cigarette users and 30 nonusers) at the University of Taubaté (Taubaté-SP). A total of 181 spectra were acquired in triplicate, resulting in 90 spectra for e-cigarette users and 91 for controls, because one control was measured in quadruplicate. Data were preprocessed by baseline correction, Savitzky–Golay smoothing, and vector normalization. Three spectral regions were examined (3050–2800 cm–1, 1720–1490 cm–1, and 1200–900 cm–1), and discriminatory analysis was performed using a Support Vector Machine (SVM) classifier with repeated 10-fold cross-validation. In the 3050–2800 cm–1 region, controls exhibited five peaks (3290, 2962, 2925, 2874, and 2853…
Genes, proteins, chemicals, diseases, species, mutations and cell lines named across the full text — each resolved to its canonical identifier and authoritative record.
Click any figure to enlarge with its caption.
 1
1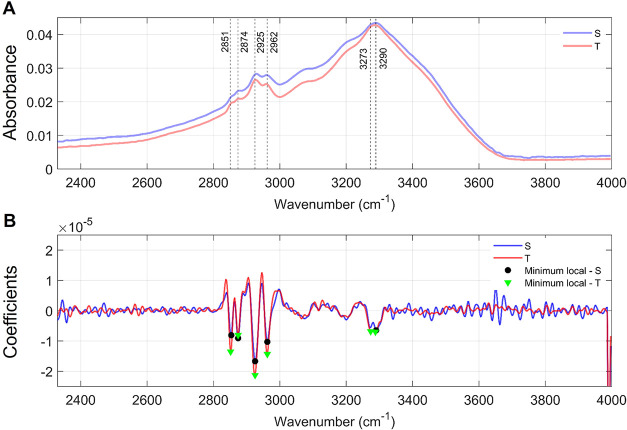 2
2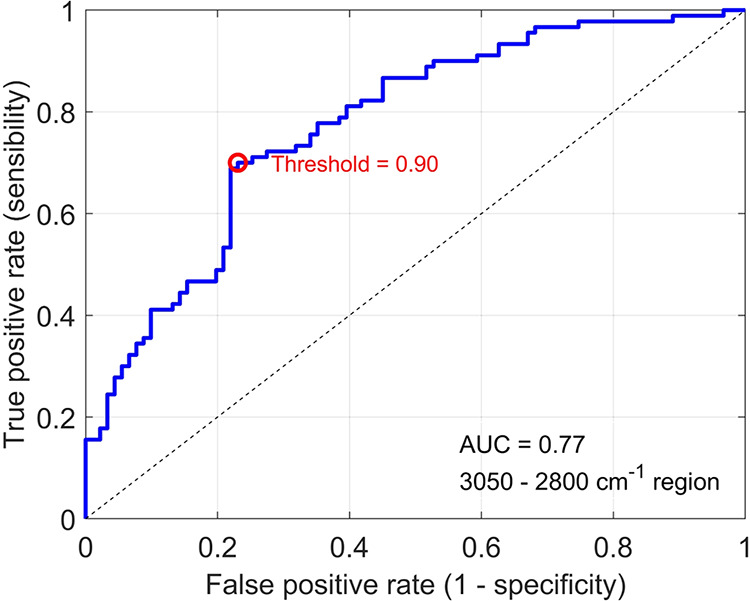 3
3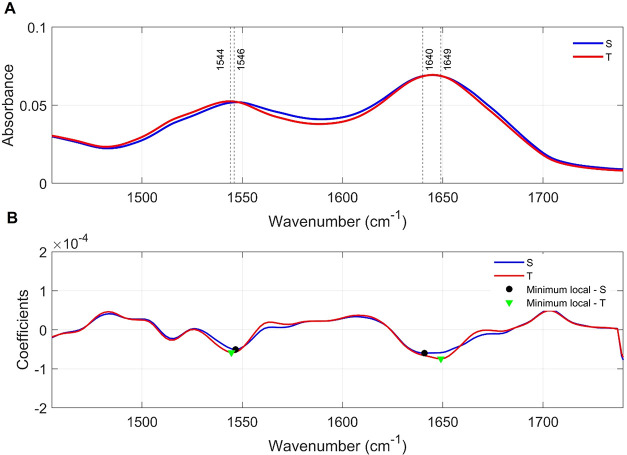 4
4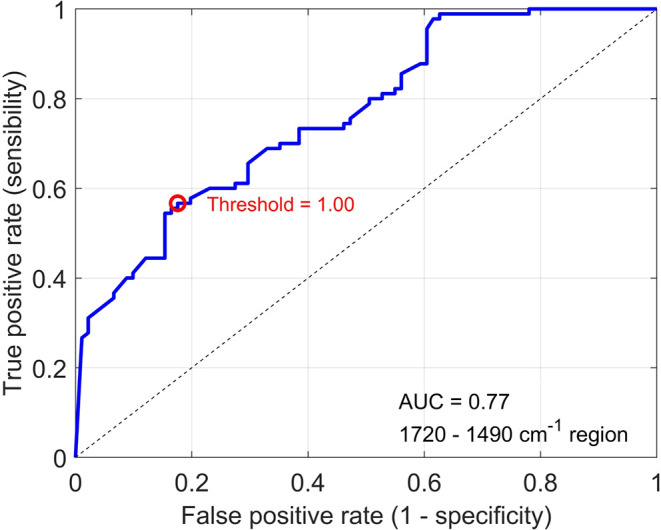 5
5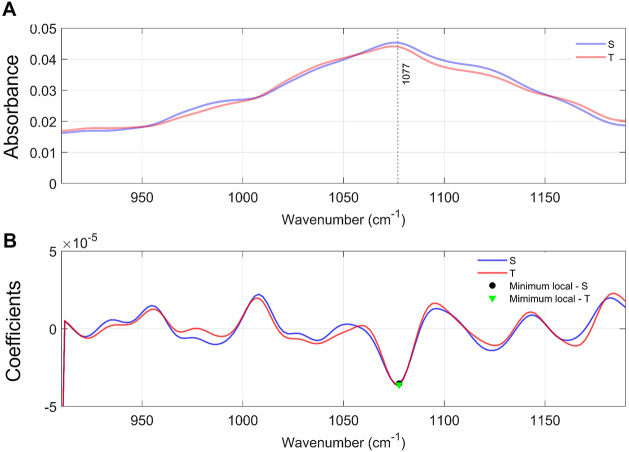 6
6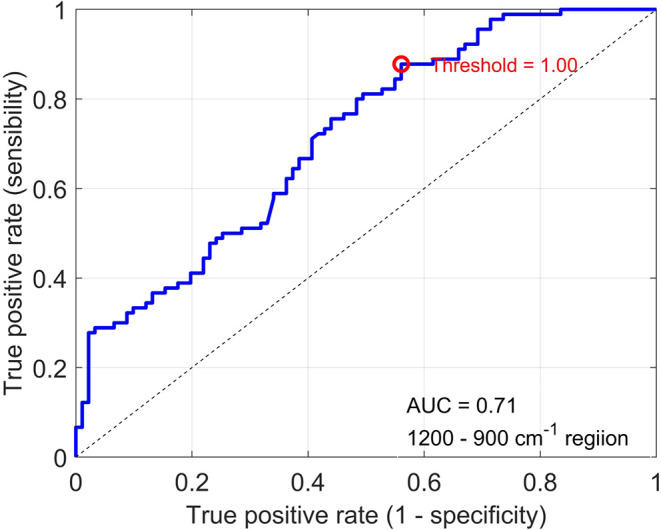 7
7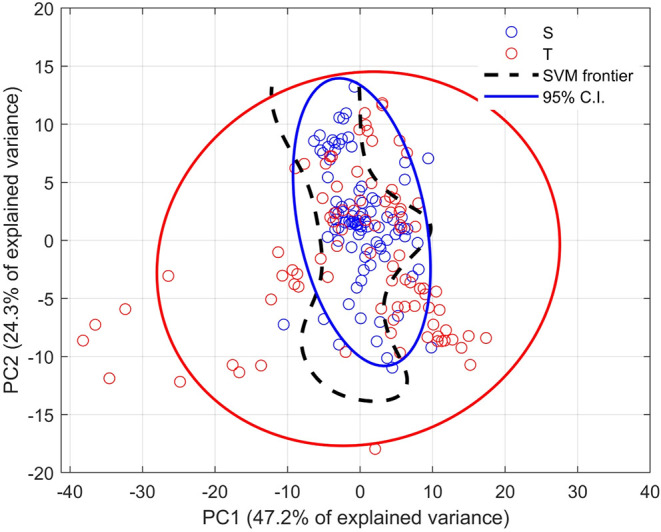 8
8| bands (cm–1) | vibrational modes | biomolecular components | group where vibrational mode appears |
|---|---|---|---|
| 3290 (3288) | stretching OH symmetric | water | both groups – maybe a shift 3288 cm–1 (T group) |
| 3273 | νO–H (water), νN–H (protein) | water and proteins | T group |
| 2962 | CH3 asymmetric stretching, CH stretching, νas CH3, asymmetric stretching mode of the methyl groups | lipids, proteins, carbohydrates and nucleic acids | both groups |
| 2925 | νC–H, νas CH2, and CH3, stretching C–H | lipids, proteins, carbohydrates and nucleic acids | both groups |
| 2874 | νs CH3, stretching C–H and N–H, CH3 symmetric stretching, symmetric stretching vibration of CH3 of acyl chains | lipids, peptides/proteins, and contribution from carbohydrates, nucleic acids with C–H and N–H bonds | both groups |
| 2853 (2851) | νs CH2 of lipids, νC–H, CH2 symmetric stretching, asymmetric CH2 stretching mode of methylene chains in membrane lipids | lipids and small contribution of carbohydrates, nucleic acids and proteins with C–H bonds | both groups – maybe a shift 2851 cm–1 (T group) |
| metrics calculated from the SVM classification | mean value ± standard deviation (20 repetitions of 10-fold cross-validation) |
|---|---|
| accuracy | 0.6994 ± 0.0169 |
| sensitivity (recall) | 1.0000 ± 0 |
| specificity | 0.0 |
| F1 score | 0.6642 ± 0.0 |
| precision | 0,4972 ± 0.0 |
| AUC | 0.7623 ± 0.0191 |
| bands (cm–1) | vibrational modes | biomolecular components | group where vibrational mode appears |
|---|---|---|---|
| 1649 | amide I (proteins/H–OH deformations of water, amide I) | proteins and water | T group |
| 1640 | α-helix | protein | S group |
| 1546 | amide II band (N–H stretch); α-helical structure | proteins and peptide | S group |
| 1546 (1544) | amide II band, amide II band (N–H stretch), amide I (CN stretch and NH bend) | proteins and peptide | T group–maybe a shift in 1546 (S group) |
| SVM classification metrics | mean value ± standard deviation (20 repetitions of 10-fold cross-validation) |
|---|---|
| accuracy | 0.6555 ± 0.0188 |
| sensitivity (recall) | 0.9994 ± 0.0025 |
| specificity | 0.2198 ± 0.0133 |
| F1 score | 0.7169 ± 0.0039 |
| precision | 0.5589 ± 0.0044 |
| AUC | 0.7348 ± 0.0262 |
| bands (cm–1) | vibrational modes | biomolecular components | group where vibrational mode appears |
|---|---|---|---|
| 1077 | sugar moieties and glycosylated proteins and PO4 compounds;
skeletal | carbohydrates, phosphate groups (PO2 –) and glycogen or other sugar derivatives | both groups |
| 1125 | CH2,6 in-plane bend and C1–Ca–Ha bend | polysaccharides; structural carbohydrates | S group |
| SVM classification metrics | mean value ± standard deviation (20 repetitions of 10-fold cross-validation) |
|---|---|
| accuracy | 0.6204 ± 0.0160 |
| sensitivity (recall) | 0.9978 ± 0.0046 |
| specificity | 0.1236 ± 0.0356 |
| F1 score | 0.6921 ± 0.0081 |
| precision | 0.5298 ± 0.0096 |
| AUC | 0.6897 ± 0.0227 |
- —Fundação de Amparo à Pesquisa do Estado de São Paulo10.13039/501100001807
- —Fundação de Amparo à Pesquisa do Estado de São Paulo10.13039/501100001807
- —Conselho Nacional de Desenvolvimento CientÃfico e Tecnológico10.13039/501100003593
- —Conselho Nacional de Desenvolvimento CientÃfico e Tecnológico10.13039/501100003593
Peer Reviews
No public reviews on file for this paper yet. If you reviewed it on a platform where reviews are public (OpenReview, ICLR, NeurIPS, ICML), you can paste yours below so the community can read it here.
Videos
No videos yet. Explain this paper in a talk, walkthrough, or lecture? Add one.
Taxonomy
TopicsSalivary Gland Disorders and Functions · Dental Health and Care Utilization · Spectroscopy Techniques in Biomedical and Chemical Research
Introduction
The use of electronic cigarettes (E-Cigarette), popularly known as “vapes,” has significantly increased, especially among young people. Presented as a potentially safer alternative to combat nicotine addiction, its growing use has raised concerns regarding the possible long-term adverse health effects.?
Several publications on the impact of electronic cigarettes on the oral cavity have pointed out adverse effects such as periodontal problems, dental caries, and reduced salivary flow. ?−? ? ? ? The vapor produced by electronic cigarettes, due to the chemical substances present in the liquid used, comes into direct contact with the oral cavity during inhalation, potentially causing significant impacts on oral health.?
Considering these findings, the need for a more detailed investigation into their effects is highlighted, both to promote improvements in public health and to increase awareness and advance knowledge in this area of study, especially considering the potential risk of developing oral diseases with the possibility of malignant transformation, such as cancer. ?−? ?
Saliva plays essential roles in maintaining oral health, and changes in its composition can indicate imbalances and predispositions to various diseases. ?−? ? Taking this into consideration, Fourier Transform Infrared (FTIR) spectroscopy, a technique used to analyze the chemical structure and composition of materials through their interaction with infrared radiation, has been applied to human biofluids for the early diagnosis of various diseases. Among these biofluids, saliva stands out due to its easy accessibility and collection, as well as its great potential for utilization.?
Characterization of saliva constituents in the context of different pathological conditions allows for a better understanding of the pathophysiology involved in various situations, in addition to favoring the development of rapid, accessible, noninvasive, and clinically applicable diagnostic methods. ?,?,?
This study aimed to analyze salivary alterations in electronic cigarette users, comparing them with nonsmokers. For this purpose, FTIR spectroscopy was employed to perform a comparative analysis, focusing on the effects of electronic cigarettes on the oral cavity and exploring possible associations between vaping and the incidence of oral diseases.
Methodology
Clinical Protocol and Patient Information
The present study was approved by the clinical research ethics committee under protocol number 19436919.7.0000.5501. The participants, volunteers among students at the University of Taubaté (Taubaté/SP), were informed about the research and signed an informed consent form before saliva sample collection.
The samples were divided into two groups: the first, composed of electronic cigarette users (T), and the second, a systemically healthy control group (S). “The T group was defined as individuals who use electronic cigarettes and do not abstain from conventional cigarettes or other substances. This information was obtained through an electronic self-report questionnaire, and it was not possible to classify the duration of prior consumption, dose dependence, or daily frequency of use within the collected sample.”
Saliva samples were collected from 60 young adults, comprising 30 e-cigarette users (group T) and 30 nonusers (group S). Each sample was analyzed in triplicate, resulting in 90 spectra for group T and 91 spectra for group S, as one control sample was acquired in quadruplicate.
Sample Collection
Before saliva collection, patients were instructed to rinse their mouths with water. Collection was performed using the spitting method, where participants spat approximately 10 mL into universal collection vials. The saliva samples were transferred to microtubes and stored at −80 °C until analysis.
Sample Processing
Samples were pipetted onto the spectrometer crystal. After each acquisition, the crystal was cleaned with 70% ethanol and allowed to dry completely before the next measurement. As the equipment features an ATR system with heating, which facilitates the drying process directly on the crystal. Spectra were also recorded after full sample drying. Raw spectral data in the 500–4000 cm^–1^ range were analyzed covering the high-wavenumber, amide region and fingerprint. To avoid contamination, a background scan was performed between each sample.
Data Analysis
FT-IR spectra were acquired from two groups: 91 spectra from group S and 90 from group T. The spectral data were preprocessed in three steps. First, a linear baseline correction was applied using the ranges 4000–3735 cm^–1^ and 2329–1801 cm^–1^ as reference points. Second, spectra were smoothed using a Savitzky–Golay filter with a second-order polynomial and a window size of 11 points. Finally, each spectrum was vector-normalized (L2 norm) by dividing all intensity values by the Euclidean norm of the spectrum.
Three spectral regions of interest were analyzed: (a) 3050–2800 cm^–1^, (b) 1720–1490 cm^–1^, and (c) 1200–900 cm^–1^. Band positions were determined from local minima in the second derivative of the mean spectra. These spectral regions were selected based on their biochemical relevance to saliva composition, as they encompass vibrational modes associated with lipids (high-wavenumber CH stretching), proteins (amide I and II bands), and carbohydrate- and phosphate-related structures (fingerprint region). Preliminary tests using the full spectral range (500 −4000 cm^–1^) and the broader biofingerprint region (900 −1800 cm^–1^) were also performed; however, these approaches resulted in lower metrics values. Thus, focusing on the targeted regions improved the signal-to-noise ratio and enhanced the discriminatory capacity for the present data set. Band positions were determined from local minima in the second derivative of the mean spectra for each group.
To assess the discriminatory power of these regions, a Support Vector Machine (SVM) classifier with a radial basis function (RBF) kernel was implemented. Model performance was evaluated using 10-fold cross-validation repeated 20 times, ensuring robust estimates of predictive metrics. For each fold, approximately 8–10 samples from each group were included in the test set. The metrics calculated included accuracy, sensitivity (recall), specificity, precision, F1-score, and the area under the receiver operating characteristic curve (AUC)
AUC = area under curve ROC TP = true positive; FN = false negative; TN = true negative; FP = false positive
The Support Vector Machines (SVM) was chosen as the primary classifier because it is one of the most widely used and well-validated machine learning methods for spectral data, particularly in small-to-moderate sample scenarios. SVM is known to perform robustly with high-dimensional, collinear data sets such as FT-IR spectra, and it has been successfully applied in several previous studies involving classification of biological or chemical samples. ?,?
Results
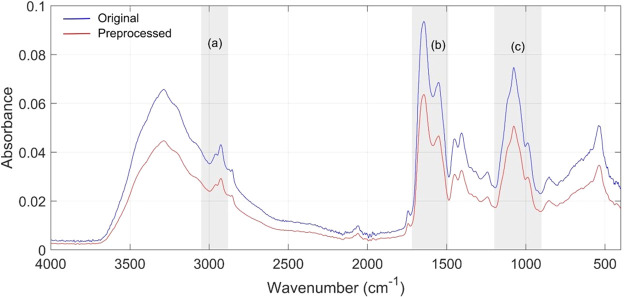
The FT-IR spectroscopic analysis of saliva samples from e-cigarette users (group T) and healthy controls (group S) generated raw spectral data within the 500–4000 cm^–1^ range (Figure).
Preprocessing of an FTIR Spectrum Legend: Comparison between the original and preprocessed spectrum. Highlighted regions in gray: (a) 3050–2800 cm–1, (b) 1720–1490 cm–1, (c) 1200–900 cm–1.
In the high wavenumber region (3050–2800 cm^–1^), the mean salivary spectra of both groups revealed characteristic peaks corresponding to water, proteins, lipids, carbohydrates, and nucleic acids (Figure and Table).
Comparison of the mean spectra for the high wavenumber region. Legend -(A) Mean spectra highlighting the band centers established from the local minima obtained from the second derivative of the mean spectra of each group (B). Note that there are five local minima for group S (black markers) and six local minima for group T (green markers). Peaks in group S occur at 3290 cm–1, 2962 cm–1, 2925 cm–1, 2874 cm–1, and 2853 cm–1, whereas peaks in group T occur at 3288 cm–1 (suggesting a shift), 3273 cm–1 (present only in group T), 2962 cm–1, 2925 cm–1, 2874 cm–1, and 2851 cm–1 (also suggesting a shift).
1: Bands and Biomolecular Components
Group S presented five local minima at 3290, 2962, 2925, 2874, and 2853 cm^–1^, whereas group T exhibited six minima, including a unique band at 3273 cm^–1^ and slight shifts at 3288 and 2851 cm^–1^. These variations highlight subtle differences in band positions between groups, while most peaks were common to both. Table summarizes the vibrational assignments of these bands, indicating their relation to stretching modes of groups, with contributions from water, proteins, lipids, carbohydrates, and nucleic acids.
In the 3050–2800 cm^–1^ region, group S exhibited five band centers at 3290, 2962, 2925, 2874, and 2853 cm^–1^, while group T presented six band centers, including a unique peak at 3273 cm^–1^ and slight shifts at 3288 and 2851 cm^–1^. These variations suggest alterations in lipid- and protein-associated vibrational modes. Classification with the SVM model achieved a mean accuracy of 0.6994 ± 0.0169, with very high sensitivity (1.0000 ± 0) but no specificity (0.0). The model also showed a precision of 0,4972 ± 0.0, an F1-score of 0.6642 ± 0.0, and an AUC of 0.7623 ± 0.0191 (Table).
2: High Wavenumber Region 2800–3050 cm–1
The ROC curve obtained from one of the 20 rounds of the SVM to show the AUC value for this wavenumber range (Figure).
ROC curve of 2800–3050 cm–1 range.
In the amide region (1720–1490 cm^–1^), the mean spectra revealed two peaks for both groups. Group S presented band centers at 1640 and 1546 cm^–1^, while group T showed band centers at 1649 and 1544 cm^–1^, with small shifts in peak position and subtle differences in absorbance intensity (Figure).
Amide Region. Comparison of the mean spectra in the 1720–1490 cm–1 range. Legend: (A) Mean spectra highlighting the band centers established from the local minima obtained from the second derivative of the mean spectra of each group in (B). Note that there are 2 local minima for both group S and group T. However, the absorbance intensity is slightly different for some mean band centers.
The vibrational assignments of these bands, mainly associated with amide I and amide II modes of proteins and peptides, are summarized in (Table).
3: Vibrational Bands and Biomolecular Components in the Amide Region (1720–1490 cm–1)
Classification using the SVM model in this region demonstrated better discriminatory performance compared with the high-wavenumber region, achieving a mean accuracy of 0.65 ± 0.01, sensitivity of 0.99 ± 0.00, specificity of 0.21 ± 0.01, precision of 0.55 ± 0.00, F1-score of 0.71 ± 0.00, and an AUC of 0.73 ± 0.02 (Table).
4: SVM Metrics for 1720–1490 cm–1 region
The ROC curve obtained from one of the 20 rounds of the SVM illustrates the AUC value for this wavenumber range (Figure).
ROC curve of 1720–1490 cm–1 range.
In the fingerprint region (1200–900 cm^–1^), both groups exhibited a coincident band at 1077 cm^–1^, with minor differences in absorbance intensity between the groups (Figure).
Fingerprint Region. Legend: (A) Comparison of the mean spectra in the 1200–900 cm–1 region. (B) Mean spectra highlighting the band centers established from the local minima obtained from the second derivative of the mean spectra of each group.
The vibrational assignment of this band, mainly related to sugar moieties, glycosylated proteins, phosphate groups, and glycogen, is summarized in Table.
5: Vibrational Band and Its Biomolecular Assignments in the Fingerprint Region (1200–900 cm–1)
The SVM model yielded an accuracy of 0.62 ± 0.01, sensitivity of 0.99 ± 0.00, specificity of 0.12 ± 0.03, precision of 0.52 ± 0.00, F1-score of 0.69 ± 0.00, and an AUC of 0.68 ± 0.02 (Table).
6: SVM Metrics for 1200–900 cm–1Region
The ROC curve obtained from one of the 20 rounds of the SVM illustrates the AUC value of the fingerprint region (Figure).
ROC curve of 1200–900 cm–1 range.
The Principal Component Analysis (PCA) did not show a clear separation between e-cigarette users and controls in either two- or three-dimensional space (Figure).
SVM visualization on PCA space. Legend: SVM decision boundary plotted over the 2D PCA projection of FTIR spectral data. Blue circles correspond to the control (nonsmoker) group (S), red circles to the smoker group (T). The dashed black line indicates the SVM decision frontier, and the ellipses represent 95% confidence intervals for each group.
Although some spectral differences were detected, clustering overlap indicated limited discriminatory capacity, consistent with the moderate sensitivity and specificity values observed in the classification analyses. This was confirmed by the sensitivity and specificity matrix (SESM), which showed percentage values that were not sufficiently high to generate robust discrimination between groups.
To provide a visual interpretation of the classification model, Figure shows the two-dimensional projection of the FTIR spectral data onto the first two principal components (PC1 = 47.2% of explained variance, PC2 = 24.3% of explained variance) with the SVM decision boundary superimposed. Although the SVM classifier operates in a higher-dimensional kernel space, this projection enables qualitative assessment of the group distribution. The blue and red ellipses represent the 95% confidence intervals (C.I.) of the S and T groups, respectively. The dashed black line indicates the SVM decision frontier derived from the classification model. As shown, there is partial overlap between the two groups, consistent with the biological similarity of salivary biochemical composition. Nonetheless, the SVM boundary correctly separates the central tendencies of both groups, corroborating the discriminative patterns captured by the model. This visualization supports the statistical findings (accuracy, sensitivity, specificity) and provides additional qualitative evidence of the SVM model’s ability to distinguish smokers from nonsmokers based on FTIR spectral features.
Discussion
The use of electronic cigarettes, popularly known as “vapes,” has significantly increased, especially among young people, who often perceive it as a less harmful alternative to traditional cigarettes.? Marketed with a modern image and as a potential tool for reducing nicotine addiction, vaping carries the promise of less harm to health compared to conventional tobacco.?
Previous studies have shown that the use of tobacco products, including traditional and electronic cigarettes, is associated with alterations in saliva composition and overall oral health. ?,? It was demonstrated that saliva can be used as a diagnostic medium for conditions such as diabetes and periodontal diseases, corroborating the idea that saliva reflects significant biochemical changes in the body.? Furthermore, the literature suggests that electronic cigarette use may be correlated with an increase in inflammatory markers, reinforcing the relationship between systemic and oral health.?
In the context of this growing evidence, our study contributes by providing FT-IR-based biochemical characterization of saliva from electronic cigarette users, revealing subtle but measurable spectral alterations across lipid-, protein-, and carbohydrate-associated vibrational modes. These results offer objective spectroscopic support to the hypothesis that e-cigarette exposure influences salivary composition, even in young, systemically healthy individuals.
In the present study, FT-IR analysis of saliva samples from e-cigarette users and controls revealed differences in specific spectral regions. In the high-wavenumber region (3050–2800 cm^–1^), e-cigarette users showed an additional band at 3273 cm^–1^ and slight shifts at 3288 and 2851 cm^–1^ compared with controls. In the amide region (1720–1490 cm^–1^), both groups exhibited two band centers, with controls showing bands at 1640 and 1546 cm^–1^ and users presenting bands at 1649 and 1544 cm^–1^, suggesting subtle modifications in protein-related vibrational modes. In the fingerprint region (1200–900 cm^–1^), both groups presented a coincident peak at 1077 cm^–1^, with only minor intensity differences. Peaks present in both groups suggest that some fundamental salivary components remain preserved; however, variations in their intensity may indicate differences in concentration or stability, influenced by e-cigarette exposure.
The band shifts observed in the 3050–2800 cm^–1^ interval are compatible with alterations in vibrational modes associated with lipids and proteins, indicating potential changes in membrane-derived components and salivary protein conformation. Small variations in CH_2_/CH_3_ stretching intensities have been previously linked to modifications in lipid packing, increased epithelial desquamation, or oxidative processesmechanisms that have also been reported in FT-IR studies assessing vaping-related biochemical changes.?
Similarly, the slight displacement of amide I and II bands (1640 → 1649 cm^–1^ and 1546 → 1544 cm^–1^) suggests changes in the secondary structure of salivary proteins. Shifts in these regions are commonly associated with alterations in α-helix and β-sheet content, protein unfolding, or increased interaction with exogenous compounds. Prior studies have indicated that exposure to e-cigarette aerosol can affect protein integrity, oxidative balance, and microbial interactions in the oral cavity, ?,? supporting the hypothesis that protein modifications detected by FT-IR may reflect early biochemical responses to aerosolized chemicals.
In the fingerprint region, the shared peak at 1077 cm^–1^associated with sugar moieties, glycosylated proteins, and phosphate-containing compoundsindicates that major carbohydrate-rich structures such as mucins remain present in both groups. However, minor intensity differences may reflect subtle alterations in mucin concentration or glycosylation, which are essential for maintaining lubrication, buffering capacity, microbial control, and epithelial protection. Such changes align with recent evidence showing that vaping can impact mucosal defenses and modify the oral microbiome. ?,?
These results indicate a potential degradation of the natural defense capacity of saliva, which may increase the predisposition to inflammation and oral infections. The findings of this study have important implications for public health and clinical practice. As electronic cigarette use becomes increasingly common, it is crucial to understand the consequences of its use on oral health. The fact that alterations in saliva can impair the body’s natural defenses and increase the risk of oral infections highlights the urgency of educational and preventive measures directed at electronic cigarette users.? Saliva, as an accessible biofluid, can serve as a noninvasive indicator of oral health, enabling early diagnoses and interventions before more severe problems develop.
The PCA analysis did not show clear group separation, indicating that although spectral differences were present, they were not sufficient to discriminate groups with high sensitivity and specificity. This finding is consistent with the SVM classification results, which demonstrated high sensitivity but only moderate specificity across the analyzed spectral regions. This suggests that, while spectral alterations are detectable, their discriminatory power may be limited without larger data sets or complementary analytical approaches.
While the findings presented here are promising, some methodological constraints should be acknowledged. The limited sample size did not permit the inclusion of an external validation set, leading us to rely exclusively on k-fold cross-validation. Although this approach is commonly adopted in spectroscopic studies with restricted data sets, it does not fully ensure external generalizability and may increase susceptibility to overfitting. Accordingly, the reported performance metrics should be interpreted with caution. Future studies involving larger cohorts and independent test sets will be essential to further substantiate and extend the present results. Furthermore, the PCA analysis revealed that, despite the observed differences, the sensitivity and specificity of the data were not sufficiently high to be clinically relevant.
This inconclusiveness may be attributed to a variety of factors, including the natural biological variability among individuals, the possible presence of other comorbidities that were not controlled for in this study, and the complexity of biochemical interactions in saliva. Additionally, the duration of exposure and the frequency of electronic cigarette use by the participants were not rigorously controlled, which could influence the results.
A methodological consideration involves machine learning analysis. Although the SVM classifier demonstrated high sensitivity across regions, specificity remained low, indicating some degree of overlap between the spectral profiles of users and controls. This behavior is not unexpected in studies involving biofluids with naturally high interindividual variability and subtle biochemical differences. It also highlights that triplicate spectral acquisition increases the number of spectra but not the number of independent biological samples, a factor that should be considered when interpreting classification performance.
To advance the understanding of the effects of electronic cigarette use on oral health, future research should include a larger number of participants, encompassing different demographics and consumption behaviors. Furthermore, longitudinal studies that monitor changes in saliva over time in electronic cigarette users could provide valuable insights into the progression of biochemical alterations. Investigating the relationship between assorted brands and compositions of electronic cigarette liquids and their respective consequences on oral health may also be a fruitful area for research.
Finally, the exploration of educational and preventive interventions aimed at electronic cigarette users may be crucial in mitigating the negative impacts on oral and overall health. Dental professionals should be attentive to these risks and proactive in counseling patients about the potential oral and systemic consequences of e-cigarette use.
Conclusion
Fourier-Transform Infrared (FT-IR) spectroscopic analysis revealed notable alterations in the salivary composition of e-cigarette users, particularly in vibrational modes associated with proteins and lipids, compared with nonusers. These spectral differences, observed across the high-wavenumber, amide, and fingerprint regions were subtle but measurable, suggesting early biochemical changes that may reflect initial disturbances in oral homeostasis related to e-cigarette exposure. Although modest in magnitude, the shifts identified through FT-IR demonstrate the technique’s ability to detect salivary alterations of potential clinical interest. Within the limitations of the sample size and classification performance, these findings support the use of saliva as a noninvasive medium for monitoring vaping-related biochemical changes and underscore the necessity for targeted public health initiatives to raise awareness about the potential risks of e-cigarette consumption.
The reference list from the paper itself. Each links out to its DOI / PubMed record.
- 1National Center for Chronic Disease Prevention and Health Promotion (US) Office on Smoking and Health . E-Cigarette Use Among Youth and Young Adults: A Report of the Surgeon General [Internet] Centers for Disease Control and Prevention (US): Atlanta (GA); 2016 https://www.ncbi.nlm.nih.gov/books/NBK 538680/.30869850 · pubmed ↗
- 2Rouabhia M.Impact of Electronic Cigarettes on Oral Health: a Review J. Can. Dent Assoc.202086 k 732543367 · pubmed ↗
- 3Ganesan S. M.Dabdoub S. M.Nagaraja H. N.Adverse effects of electronic cigarettes on the disease-naive oral microbiome Sci. Adv.20206 eaaz 010810.1126/sciadv.aaz 010832518820 PMC 7253170 · doi ↗ · pubmed ↗
- 4Catala-Valentin A.Bernard J. N.Caldwell M.Maxson J.Moore S. D.Andl C. D.E-Cigarette Aerosol Exposure Favors the Growth and Colonization of Oral Streptococcus mutans Compared to Commensal Streptococci Microbiol. Spectrum 2022102 e 024212110.1128/spectrum.02421-21PMC 904506535377225 · doi ↗ · pubmed ↗
- 5Chaffee B. W.Halpern-Felsher B.Cheng J.E-cigarette, cannabis and combustible tobacco use: associations with xerostomia among California adolescents Commun. Dent. Oral Epidemiol.202351218018610.1111/cdoe.12721 PMC 920714934927762 · doi ↗ · pubmed ↗
- 6Shabil M.Khatib M. N.Ballal S.The impact of electronic cigarette use on periodontitis and periodontal outcomes: a systematic review and meta-analysis BMC Oral Health 2024241119710.1186/s 12903-024-05018-739385155 PMC 11463078 · doi ↗ · pubmed ↗
- 7Famele M.Ferranti C.Abenavoli C.Palleschi L.Mancinelli R.Draisci R.The Chemical Components of Electronic Cigarette Cartridges and Refill Fluids: Review of Analytical Methods Nicotine Tob. Res.201517327127910.1093/ntr/ntu 19725257980 PMC 5479507 · doi ↗ · pubmed ↗
- 8Ralho A.Coelho A.Ribeiro M.Paula A.Amaro I.Sousa J.Marto C.Ferreira M.Carrilho E.Effects of Electronic Cigarettes on Oral Cavity: A Systematic Review J. Evidence Based Dent. Pract.201919410131810.1016/j.jebdp.2019.04.00231843181 · doi ↗ · pubmed ↗