Comparative analyses of chloroplast genomes in Geum species: insights into genome characteristics, phylogenomic implications, and adaptive evolution
Wen-Tao Fu, Zhi-Ping Zhang, Jia-Jie Guo, Jun Wen, Qin-Qin Li

TL;DR
This study compares chloroplast genomes of 32 Geum species to understand their evolution, phylogeny, and adaptation.
Contribution
This is the first comparative analysis of chloroplast genomes in Geum species, identifying variable regions and genes under positive selection.
Findings
Geum chloroplast genomes have a conserved structure with 129 genes.
Eleven variable regions were identified as potential molecular markers for future studies.
Twenty-three genes showed signs of positive selection, suggesting roles in habitat adaptation.
Abstract
The genus Geum, comprises about 72 species, most frequently distributed in North America, Asia, and Europe, with a few representatives in South America, South Africa, Australia, and New Zealand. Previous phylogenetic analyses based on several molecular markers have contributed to understanding the delimitation of Geum, but the phylogenetic relationships within the genus remain unresolved. Moreover, only a few chloroplast (cp) genomes of Geum species have been reported, and no comparative cp genome analyses among Geum species have been conducted to date, limiting our understanding of cp genome evolution. This study is the first to conduct comparative genomic analyses on the cp genomes of 32 accessions representing 11 Geum taxa. The Geum cp genomes showed a typical quadripartite structure, similar to that of most other land plants, with a total of 129 genes, including 84 protein-coding…
Genes, proteins, chemicals, diseases, species, mutations and cell lines named across the full text — each resolved to its canonical identifier and authoritative record.
Click any figure to enlarge with its caption.
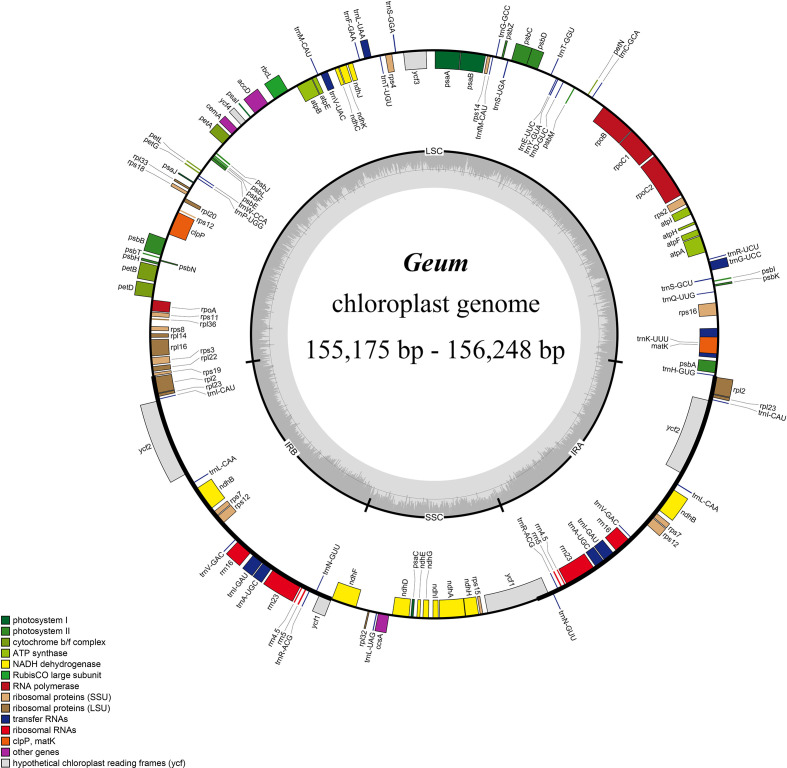 Figure 1
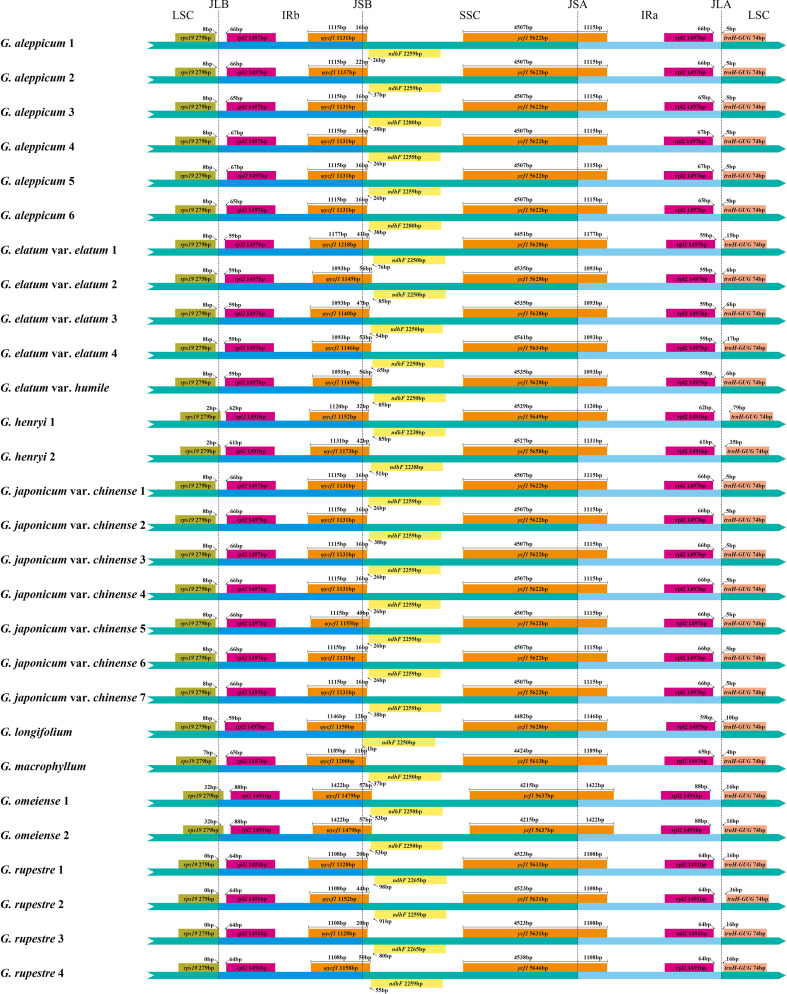 Figure 2
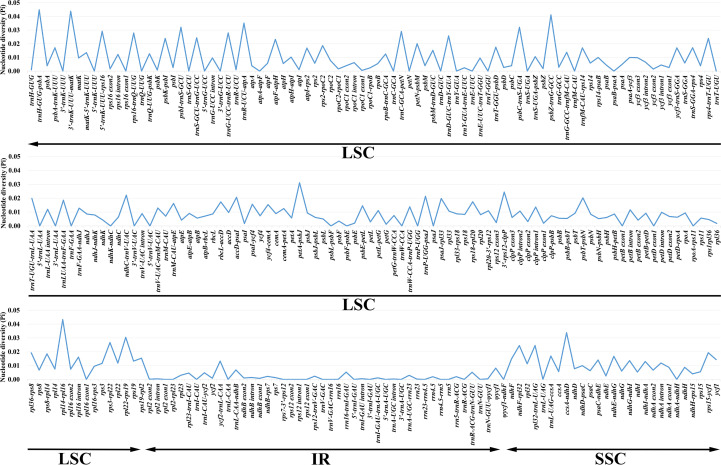 Figure 3
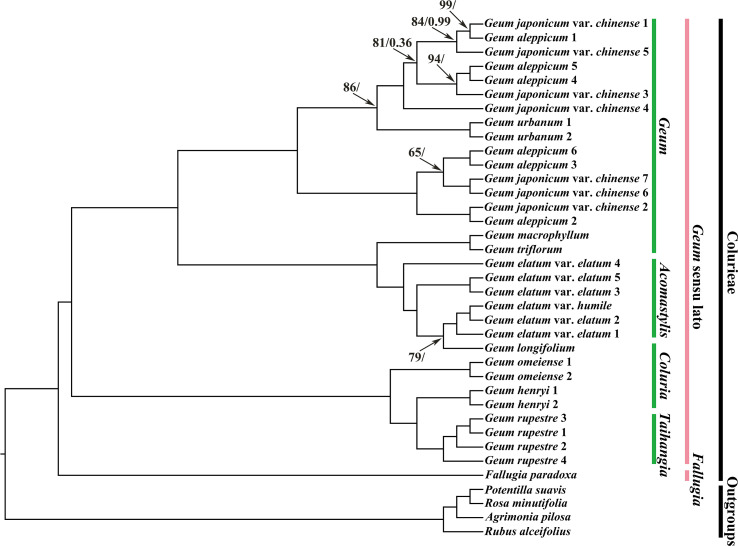 Figure 4
| Species name (synonym) | Voucher | Locality | GenBank accession | Size (bp) | Number of genes | GC content (%) | References | |||||||||
|---|---|---|---|---|---|---|---|---|---|---|---|---|---|---|---|---|
| Total | LSC | SSC | IR | Total | Protein coding | tRNA | rRNA | Total | LSC | SSC | IR | |||||
| 156,036 | 85,358 | 18,410 | 26,134 | 129 | 84 (6) | 37 (7) | 8 (4) | 36.8 | 34.4 | 30.7 | 42.6 |
| ||||
| 155,911 | 85,382 | 18,289 | 26,120 | 129 | 84 (6) | 37 (7) | 8 (4) | 36.8 | 34.4 | 30.7 | 42.7 | Unpublished | ||||
| Li QQ 20220722006 (NMTC) | China, Jilin, Antu | 155,940 | 85,370 | 18,320 | 26,125 | 129 | 84 (6) | 37 (7) | 8 (4) | 36.8 | 34.4 | 30.7 | 42.7 | This article | ||
| Li QQ 20220716002 (NMTC) | China, Sichuan, Daofu | 156,038 | 85,362 | 18,418 | 26,129 | 129 | 84 (6) | 37 (7) | 8 (4) | 36.8 | 34.5 | 30.7 | 42.6 | This article | ||
| Li QQ 20220812064 (NMTC) | China, Inner Mongolia, Hohhot | 156,038 | 85,362 | 18,418 | 26,129 | 129 | 84 (6) | 37 (7) | 8 (4) | 36.8 | 34.5 | 30.7 | 42.6 | This article | ||
| Li QQ 20160717001 (NMTC) | China, Xinjiang, Fuyun | 155,943 | 85,373 | 18,320 | 26,125 | 129 | 84 (6) | 37 (7) | 8 (4) | 36.8 | 34.4 | 30.8 | 42.7 | This article | ||
| Li QQ 20150822024 (NMTC) | China, Sichuan, Dege | 156,114 | 85,452 | 18,402 | 26,130 | 129 | 84 (6) | 37 (7) | 8 (4) | 36.7 | 34.3 | 30.8 | 42.6 | This article | ||
| 156,104 | 85,507 | 18,501 | 26,048 | 129 | 84 (6) | 37 (7) | 8 (4) | 36.7 | 34.3 | 30.8 | 42.7 | Unpublished | ||||
| Li QQ 20150729073 (NMTC) | China, Sichuan, Yajiang | 156,145 | 85,544 | 18,509 | 26,046 | 129 | 84 (6) | 37 (7) | 8 (4) | 36.7 | 34.3 | 30.8 | 42.7 | This article | ||
| Li QQ 20230720004 (NMTC) | China, Xizang, Yadong | 156,248 | 85,610 | 18,530 | 26,054 | 129 | 84 (6) | 37 (7) | 8 (4) | 36.7 | 34.3 | 30.8 | 42.7 | This article | ||
|
| ||||||||||||||||
| Li QQ LWQ0819002 (NMTC) | China, Xizang, Leiwuqi | 156,121 | 85,508 | 18,501 | 26,056 | 129 | 84 (6) | 37 (7) | 8 (4) | 36.7 | 34.3 | 30.8 | 42.7 | This article | ||
| Li QQ 20220717008 (NMTC) | China, Sichuan, Guangwu Mountain | 155,175 | 85,563 | 18,466 | 25,573 | 129 | 84 (6) | 37 (7) | 8 (4) | 36.7 | 34.3 | 30.7 | 42.8 | This article | ||
| Li QQ 20220718002 (NMTC) | China, Sichuan, Micang Mountain | 155,291 | 85,740 | 18,419 | 25,566 | 129 | 84 (6) | 37 (7) | 8 (4) | 36.7 | 34.3 | 30.8 | 42.8 | This article | ||
| 155,999 | 85,333 | 18,410 | 26,128 | 129 | 84 (6) | 37 (7) | 8 (4) | 36.8 | 34.4 | 30.7 | 42.6 | Unpublished | ||||
| 155,912 | 85,375 | 18,297 | 26,120 | 129 | 84 (6) | 37 (7) | 8 (4) | 36.8 | 34.4 | 30.7 | 42.7 | Unpublished | ||||
| Li QQ 20220711012 (NMTC) | China, Sichuan, Dayi | 156,007 | 85,340 | 18,411 | 26,128 | 129 | 84 (6) | 37 (7) | 8 (4) | 36.8 | 34.5 | 30.7 | 42.6 | This article | ||
| Li QQ 20220709002 (NMTC) | China, Sichuan, Dujiangyan | 156,009 | 85,342 | 18,411 | 26,128 | 129 | 84 (6) | 37 (7) | 8 (4) | 36.8 | 34.4 | 30.7 | 42.6 | This article | ||
| Li QQ 20220713001 (NMTC) | China, Sichuan, Mount Emei | 156,013 | 85,347 | 18,410 | 26,128 | 129 | 84 (6) | 37 (7) | 8 (4) | 36.8 | 34.4 | 30.7 | 42.6 | This article | ||
| Li QQ 20160807032 (NMTC) | China, Yunnan, Luquan | 155,856 | 85,375 | 18,271 | 26,105 | 129 | 84 (6) | 37 (7) | 8 (4) | 36.8 | 34.4 | 30.8 | 42.7 | This article | ||
| Li QQ 20150728012 (NMTC) | China, Sichuan, Luding | 155,831 | 85,350 | 18,271 | 26,105 | 129 | 84 (6) | 37 (7) | 8 (4) | 36.8 | 34.4 | 30.8 | 42.7 | This article | ||
| 155,884 | 85,338 | 18,358 | 26,094 | 129 | 84 (6) | 37 (7) | 8 (4) | 36.7 | 34.4 | 30.9 | 42.6 |
| ||||
| 155,940 | 85,307 | 18,329 | 26,152 | 129 | 84 (6) | 37 (7) | 8 (4) | 36.6 | 34.3 | 30.6 | 42.6 |
| ||||
| LCH 1146 (NMTC) | China, Sichuan, Mount Emei | 155,388 | 85,538 | 18,140 | 25,855 | 129 | 84 (6) | 37 (7) | 8 (4) | 36.6 | 34.3 | 30.8 | 42.6 | This article | ||
| LCH 1148 (NMTC) | China, Sichuan, Mount Emei | 155,388 | 85,538 | 18,140 | 25,855 | 129 | 84 (6) | 37 (7) | 8 (4) | 36.6 | 34.3 | 30.8 | 42.6 | This article | ||
| 155,558 | 85,857 | 18,543 | 25,579 | 129 | 84 (6) | 37 (7) | 8 (4) | 36.8 | 34.5 | 30.8 | 42.8 |
| ||||
| 155,479 | 85,771 | 18,550 | 25,579 | 129 | 84 (6) | 37 (7) | 8 (4) | 36.8 | 34.5 | 30.8 | 42.8 |
| ||||
| 155,514 | 85,823 | 18,533 | 25,579 | 129 | 84 (6) | 37 (7) | 8 (4) | 36.8 | 34.5 | 30.8 | 42.8 |
| ||||
| 155,512 | 85,838 | 18,496 | 25,589 | 129 | 84 (6) | 37 (7) | 8 (4) | 36.8 | 34.5 | 30.9 | 42.8 |
| ||||
|
| ||||||||||||||||
| Unpublished | ||||||||||||||||
| Unpublished | ||||||||||||||||
| Gene | Positively selected sites | Pr( | Number of sites |
|---|---|---|---|
|
| 472 V/604 K/643 K/830 P | 0.969*/0.977*/0.974*/0.988* | 4 |
|
| 1475 A/1628 A/ | 0.992**/0.969* | 2 |
|
| 1645 T | 0.985* | 1 |
|
| 3303 Q/3319 D | 0.961*/0.987* | 2 |
|
| 4304 L | 0.967* | 1 |
|
| 7395 N/7452 S | 0.975*/0.999** | 2 |
|
| 8316 S | 0.973* | 1 |
|
| 9578 H/9739 C/9941 C/9967 I | 0.989*/0.993**/0.984*/0.997** | 4 |
|
| 10001 I/10034 D/10055 G/10107 M | 0.952*/0.970*/0.980*/0.985* | 4 |
|
| 10723 R | 0.955* | 1 |
|
| 11266 A | 0.989* | 1 |
|
| 11989 Y | 0.956* | 1 |
|
| 14126 D | 0.951* | 1 |
|
| 14398 L/14468 I/14473 G | 0.954*/0.985*/0.998** | 3 |
|
| 15897 W | 0.971* | 1 |
|
| 18372 V/18416 R/18418 S/18476 F/18493 Q/18517 I/18526 I/18544 S/18557 L/18574 L/18597 L/18664 C/18667 Y/18671– | 0.980*/0.958*/0.983*/0.992**/0.967*/0.969*/0.969*/0.969*/0.966*/0.997**/0.964*/0.998**/1.000**/0.994** | 14 |
|
| 19009 F | 0.979* | 1 |
|
| 19092 L/19500 K/19536 S | 0.998**/0.987*/0.959* | 3 |
|
| 20069 F | 0.978* | 1 |
|
| 20087 S | 0.951* | 1 |
|
| 20743 K | 0.963* | 1 |
|
| 20924 L | 0.961* | 1 |
|
| 21375 T/21392 K/21397 K/21420 A/21464 R/21477 I/21507 R/21534 S/21537 -/21562 L/21610 A/21614 P/21616 E/21649 I/21705 K/21706 K/21707 S/21709 L/21725 W/21730 K/21945 L/22009 V/22058 E/22106 I/22173 D/22180 K/22206 I/22242 Q/22288 R/22293 K/22322 M/22465 I/22469 D/22488 R/22544 L/22701 L/22742 N/22771 N/22878 N | 0.995**/0.969*/0.965*/0.981*/0.968*/0.982*/0.968*/0.975*/0.986*/0.991**/0.970*/0.970*/0.983*/0.965*/0.999**/0.993**/0.993**/0.987*/0.997**/0.962*/0.999**/0.964*/0.968*/0.988*/0.981*/0.955*/0.991**/0.985*/0.984*/0.987*/0.975*/0.958*/0.984*/0.997**/0.981*/0.961*/0.967*/0.981*/0.980* | 39 |
Peer Reviews
No public reviews on file for this paper yet. If you reviewed it on a platform where reviews are public (OpenReview, ICLR, NeurIPS, ICML), you can paste yours below so the community can read it here.
Videos
No videos yet. Explain this paper in a talk, walkthrough, or lecture? Add one.
Taxonomy
TopicsGenomics and Phylogenetic Studies · Chromosomal and Genetic Variations · Genome Rearrangement Algorithms
Introduction
1
The chloroplast (cp) is a semiautonomous organelle in green plants that plays key roles in photosynthesis and other aspects of plant physiology and development (Neuhaus and Emes, 2000; Sato et al., 2003; Daniell et al., 2016). The cp genomes of land plants are circular, double-stranded molecules, mostly ranging from 115 to 165 kb in size and containing 120–130 genes (Ravi et al., 2008; Daniell et al., 2016). Land plant cp genomes usually display a typical quadripartite structure, with a large single-copy region (LSC) plus a small single-copy region (SSC) separated by two inverted repeat regions, IRa and IRb (Ravi et al., 2008; Wicke et al., 2011; Daniell et al., 2016). Owing to their small size, moderate substitution rate, conserved structure, and lack of recombination (Palmer, 1985; Drouin et al., 2008; Ravi et al., 2008; Mower and Vickrey, 2018), cp genomes have become important tools for studies on species identification, population genetics, taxonomy, biogeography, and systematic evolution in land plants, particularly with the development of high-throughput sequencing technology (e.g., Li et al., 2021; Wang et al., 2022; Zhang G. J. et al., 2022; Hu et al., 2023; Li et al., 2024a; Zhou et al., 2024; Rana et al., 2025).
As the largest genus, comprising about 72 of the 75 species in its tribe, Geum in the sense of Smedmark (2006), together with the other two woody and white-flowered genera Fallugia and Sieversia, constitutes the tribe Colurieae (Smedmark and Eriksson, 2002; Smedmark et al., 2003; Smedmark, 2006). From a geographical perspective, the monospecific Fallugia occurs in the southwestern USA and northern Mexico, Sieversia occurs in Alaska and East Asia, and species of Geum are most frequently distributed in North America, Asia, and Europe, with a few representatives in South America, South Africa, Australia, and New Zealand (Gajewski, 1959; Smedmark and Eriksson, 2002; Brouillet, 2014; Henrickson and Parfitt, 2014; Phipps, 2014; Rohrer, 2014). In addition to their ornamental value, the primary importance of Geum species lies in their medicinal properties. Some Geum species have been used in traditional medicine for the treatment of various conditions, including leucorrhea, hemorrhages, gingivitis, muscle pain, gastrointestinal disorders, cardiac disorders, infections, fever, and inflammation of the skin, mucous membranes, and urinary system (Hänsel et al., 1993; Vollmann and Scbultze, 1995; Birnesser and Stolt, 2007; Redžić, 2007; Menković et al., 2011; Granica et al., 2016; Blaschek et al., 2018). The classification of Geum, which over the last century was mainly based on morphological evidence, cytogenetic studies, and interspecific crossings, has been ambiguous and conflicting (e.g., Scheutz, 1870; Focke, 1894; Rydberg, 1913; Bolle, 1933; Juzepchuk, 1941; Gajewski, 1957, 1959, 1968; Schulze-Menz, 1964; Hutchinson, 1967; Kalkman, 1988). Later molecular phylogenetic studies based on the cp trnL-trnF region and nuclear ribosomal ITS (Smedmark and Eriksson, 2002), as well as the low-copy nuclear gene GBSSI (Smedmark et al., 2003, 2005), did not support the monophyly of any of the previously proposed circumscriptions of Geum, and provided good support for delimiting the herbaceous perennials with a rosette of basal leaves in the tribe Colurieae as Geum in a broad sense (Smedmark, 2006). Geum, with this broad recircumscription (sensu Smedmark, 2006), embraces 12 historically segregated genera, namely Waldsteinia, Stylypus, Coluria, Acomastylis, Erythrocoma, Novosieversia, Oncostylus, Parageum, Orthurus, Woronowia, Taihangia, and Oreogeum. Previous phylogenetic analyses based on several molecular markers have contributed to understanding the delimitation of Geum, but the phylogenetic relationships within the genus remain unresolved (Smedmark and Eriksson, 2002; Smedmark et al., 2003, 2005; Faghir et al., 2018). Moreover, only a few cp genomes of Geum species have been reported (e.g., Li and Wen, 2021; Feng et al., 2022; Guo et al., 2023), and, to the best of our knowledge, no comparative cp genome analyses among Geum species have been conducted to date, limiting our understanding of cp genome evolution in this genus.
This is the first study to conduct comparative genomic analyses of the cp genomes of 32 accessions representing 11 Geum taxa. The aims were to (1) analyze the cp genome characteristics of Geum species to explore its cp genome evolution, (2) identify mutational hotspot regions across the cp genomes of Geum as potential molecular markers for species identification and phylogenetic studies, (3) provide insights into the phylogenetic relationships among Geum species to enhance understanding of their classification, and (4) investigate the adaptive evolution of cp genes in Geum species to understand their molecular adaptation. This study lays a foundation for future research on molecular identification, phylogenetics, and cp genome evolution of Geum species, and also provides an important theoretical basis for the development and utilization of the medicinal plant resources of Geum.
Materials and methods
2
Taxon sampling, DNA extraction, and Illumina sequencing
2.1
A total of 32 cp genome sequences representing 11 Geum taxa (17 of which were newly sequenced) were sampled in this study. The 17 new samples of Geum were collected during field trips, and species identification of the collected samples was conducted using an optical microscope with reference to relevant literature (Yü and Kuan, 1985; Yü and Li, 1985; Li et al., 2003). Voucher specimen information and GenBank accession numbers for Geum samples are presented in Table 1. In addition, cp genome sequences of Fallugia paradoxa, Potentilla suavis, Rosa multiflora, Agrimonia pilosa, and Rubus alceifolius downloaded from GenBank were included in the phylogenetic analyses, following Zhang et al. (2017). Total genomic DNA was isolated from silica-dried leaves using the CTAB method (Doyle and Doyle, 1987). Sonication was then used to fragment the DNA, and the DNA fragments were used to construct short-insert libraries with an insert size of 300 bp. Finally, the pooled libraries were sequenced on the Illumina NovaSeq platform in Novogene (Beijing, China).
Chloroplast genome assembly and annotation
2.2
Illumina paired-end sequencing generated about 5.0 Gb of raw data for each Geum sample. Adapters were removed from the raw reads using Trimmomatic (Bolger et al., 2014). NOVOPlasty (Dierckxsens et al., 2017) was employed to assemble the newly sequenced cp genomes from the filtered reads. During assembly, the cp genome of Geum macrophyllum (GenBank Accession No. MT774132) was used as the reference sequence, with its rbcL gene as seed input, and all other parameters set to default. After successfully assembling the cp genome sequences of some species, these sequences were used as references to assemble cp genomes of other accessions or closely related species. Using the cp genome of G. macrophyllum (MT774132) as the reference, cp genome annotations of Geum species downloaded from GeneBank were checked, and the cp genome sequence of Geum elatum (MT982432) was annotated by transfer annotation in Geneious Prime (Kearse et al., 2012). For newly sequenced Geum cp genome sequences, annotated sequences of the same species or closely related species were selected for transfer annotation.
Comparative analyses of chloroplast genomes
2.3
Comparative analyses were conducted on the complete cp genomes of 28 accessions representing Geum taxa. The whole cp genome size, lengths of the LSC/SSC/IR, Guanine-Cytosine (GC) content, gene composition, and boundary region variation were analyzed in Geneious Prime, and the variation in the LSC/IR/SSC boundary regions was illustrated. The cp genomes of Geum were aligned using MAUVE v. 2.4.0 (Darling et al., 2004, 2010) to identify potential rearrangements and inversions. The level of differentiation among the Geum cp genomes was assessed using the Shuffle-LAGAN mode in mVISTA (Frazer et al., 2004) with Geum aleppicum 1 as the reference. Coding and noncoding regions of the Geum cp genomes were extracted in Geneious Prime, and homologous loci were then aligned by MAFFT v. 7.490 (Katoh and Standley, 2013). Nucleotide variability (Pi) of each region was calculated using DnaSP v. 6.12.03 (Rozas et al., 2017). Both sequence lengths and Pi values were considered to screen candidate molecular markers for Geum. A tree-based method was further employed to evaluate the resolution power of the screened candidate molecular markers compared to the core DNA barcodes (trnH-GUG-psbA, rbcL, and matK). MEGA v. 12.0.11 (Kumar et al., 2024) was used to construct neighbor-joining (NJ) trees based on each molecular marker, using the “pairwise deletion” option to treat gaps/missing data and the “d: Transitions + Transversions” option for substitutions under the Kimura 2-parameter model, with 1,000 bootstrap replicates.
Phylogenetic analyses
2.4
Maximum likelihood (ML) and Bayesian inference (BI) methods were used to infer the phylogenetic relationships of the 11 Geum taxa within the phylogenetic framework of the tribe Colurieae. Based on previous studies (Zhang et al., 2017; Xiang et al., 2017), Agrimonia pilosa, Potentilla suavis, Rosa minutifolia, and Rubus alceifolius were selected as outgroups. A total of 37 cp genome sequences, with the IRa removed, were used for phylogenetic analyses (Supplementary Table S1), and these sequences were first aligned using MAFFT v. 7.490 (Katoh and Standley, 2013). The alignment was then trimmed using trimAL v. 1.4 (Capella-Gutiérrez et al., 2009) with a 0.75 gap threshold. RAxML v. 8.2.12 (Stamatakis, 2014) was employed to conduct the ML analysis under the GTRGAMMA model with 1,000 bootstrap replicates. Prior to the BI analysis, the best-fit model was selected using PartitionFinder2 (Lanfear et al., 2017) according to the Corrected Akaike Information Criterion (AICc; Sugiura, 1978) following Posada and Buckley (2004). The BI analysis was then performed using MrBayes v. 3.2.7a (Ronquist et al., 2012) under the best-fit model GTR + I + G. Markov Chain Monte Carlo (MCMC) analyses included four parallel runs with one million generations, sampled every 100 generations, with the initial 25% of trees discarded as burn-in, and the remaining trees used to generate a consensus tree.
Adaptive evolution analyses
2.5
Selection pressure analyses were conducted using CodeML (Yang, 2007) implemented in EasyCodeML (Gao et al., 2019), involving 32 complete cp genomes representing nine Geum taxa (28 accessions) and four related species (Potentilla suavis, Rosa multiflora, Agrimonia pilosa, Rubus alceifolius). First, the 78 common protein-coding genes (PCGs) were extracted from the 32 cp genomes using Geneious Prime (Kearse et al., 2012). Each PCG was then aligned separately by codons using MAFFT, with stop codons manually removed from each alignment. The alignments of the 78 PCGs were concatenated into a supermatrix for subsequent analysis. The FASTA format of the supermatrix was used as the input file in EasyCodeML. The ML tree established based on the supermatrix by RAxML v. 8.2.12 (Stamatakis, 2014), using the same parameters in the phylogenetic analyses, was used as an input tree (Supplementary Figure S1). The likelihood ratio test (LRT) was performed to detect adaptation signatures under four comparison site models: M0 (one-ratio) vs. M3 (discrete), M1a (neutral) vs. M2a (positive selection), M7 (beta) vs. M8 (beta and ω > 1), and M8a (beta and ω = 1) vs. M8, with significance threshold of p < 0.05. Bayesian empirical Bayes (BEB) (Yang et al., 2005) or Naïve empirical Bayes (NEB) (Nielsen and Yang, 1998) analysis was performed to detect sites under positive selection with posterior probabilities ≥ 0.95.
Results and discussion
3
Chloroplast genome characteristics
3.1
The size of the 28 Geum cp genomes ranged from 155,175 bp (Geum henryi 1) to 156,248 bp (G. elatum 4) (Table 1; Figure 1). The genomes exhibited a typical quadripartite structure, as observed in most land plants (Daniell et al., 2016), comprising an LSC region of 85,307 bp (G. macrophyllum) to 85,857 bp (Geum rupestre 1), an SSC region of 18,140 bp (Geum omeiense) to 18,550 bp (G. rupestre 2), and a pair of IR regions of 25,566 bp (G. henryi 2) to 26,152 bp (G. macrophyllum). The total GC content of the 28 Geum cp genomes ranged from 36.6% to 36.8%, with the IR regions (42.6%–42.8%) showing higher GC content than the LSC (34.3%–34.5%) and SSC (30.7%–30.9%) regions (Table 1), likely due to the presence of ribosomal RNA (rRNA) genes (Ravi et al., 2008). All 28 Geum cp genomes encoded 129 genes, including 112 unique genes and 17 duplicated genes. The 112 unique genes consisted of 78 PCGs, 30 transfer RNA (tRNA) genes, and four rRNA genes (Figure 1; Table 1; Supplementary Table S2). The 17 genes duplicated in the IR regions comprised seven tRNA genes (trnA-UGC, trnI-CAU, trnI-GAU, trnL-CAA, trnN-GUU, trnR-ACG, and trnV-GAC), six PCGs (ndhB, rpl2, rpl23, rps7, rps12, and ycf2), and four rRNA genes (rrn4.5, rrn5, rrn16, and rrn23). Among the 17 genes containing introns, three genes (clpP, rps12, and ycf3) had two introns, while the remaining 14 genes (ndhA, ndhB, petB, petD, rpl2, rpl16, rpoC1, rps16, trnA-UGC, trnG-UCC, trnI-GAU, trnK-UUU, trnL-UAA, and trnV-UAC) each contained a single intron (Supplementary Table S2).
Chloroplast genome map of Geum species. Genes inside the circle are transcribed clockwise, and those outside are transcribed counterclockwise.
No gene rearrangements or inversions were detected in the 28 Geum cp genomes based on Mauve alignment analysis, indicating strong collinearity among these genomes. Although the Geum cp genomes are highly conserved in gene content, organization, and order, minor variations were visible in the IR/SC boundary regions (Figure 2). Expansion and contraction of the IR regions are the primary drivers of cp genome size variation in terrestrial plants (Ravi et al., 2008; Mower and Vickrey, 2018). All 28 Geum cp genomes contained identical genes and pseudogenes at the boundary regions, including rps19, rpl2, ѱycf1, ndhF, ycf1, and trnH-GUG. The rps19-rpl2-trnH-GUG genes were located in the LSC/IR boundary regions. In G. henryi and G. omeiense, rps19 crossed the LSC/IRb junction (JLB), extending 2 and 32 bp in the IRb region, respectively, whereas in the other taxa, rps19 was entirely located in the LSC region, 0–8 bp from the JLB. The duplicated rpl2 gene was located in both IRb and IRa regions, 59–88 bp away from the JLB and IRa/LSC junction (JLA), respectively. Gene trnH-GUG was positioned in the LSC region, 4–79 bp from the JLA. The pseudogene ψycf1 and the ndhF gene were located around the IRb/SSC junction (JSB). The ψycf1 pseudogene spanned the JSB, extending 11–56 bp into the SSC region, whereas ndhF was located in the SSC region, with 1–98 bp from the JSB region. In Geum longifolium, G. japonicum var. chinense 5, and G. omeiense, ψycf1 overlapped with the ndhF gene by 4–14 bp. The ycf1 gene crossed the SSC/IRa junction (JSA), with a length of 4,215–4,542 bp in the SSC region and 1,093–1,422 bp in the IRa region. The results indicated no significant expansion or contraction of the IR region in Geum cp genomes, supporting minor IR boundary shifts among closely related species (Shen et al., 2022; Li et al., 2024b; Jiang et al., 2025).
Comparison of the boundary regions of the large single-copy (LSC), small single-copy (SSC), and inverted repeat (IR) regions among 28 Geum chloroplast genomes.
The mVISTA analysis revealed that Geum cp genomes were generally conserved at the genome-wide level, although several highly divergent regions were identified (Supplementary Figure S2). Overall, the LSC and SSC regions exhibited greater divergence than the IR regions. Noncoding regions, particularly intergenic spacers (IGS), were more variable than coding regions, consistent with observations in other angiosperms (e.g., Wu et al., 2020; Xu et al., 2021; Hang et al., 2025).
Divergence hotspots
3.2
Nucleotide variability (Pi) values for 264 regions in the 28 Geum cp genomes were analyzed using DnaSP v.6.12.03 (Rozas et al., 2017). Pi values ranged from 0 to 0.04487, with an average of 0.00843, indicating high similarity among Geum cp genomes (Figure 3; Supplementary Table S3). Four regions had Pi > 0.04, six regions had 0.03 < Pi ≤ 0.04, 18 regions had 0.02 < Pi ≤ 0.03, 53 regions had 0.01 < Pi ≤ 0.02, 128 regions had 0 < Pi ≤ 0.01, and 55 regions had Pi = 0. The four highly variable regions with Pi > 0.04 (trnH-GUG-psbA, 3′-trnK-UUU-matK, rpl14-rpl16, and psbZ-trnG-GCC) were all located in the LSC region. Among the six regions with 0.03 < Pi ≤ 0.04 (trnR-UCU-atpA, ccsA-ndhD, psbI-trnS-GCU, psbC-trnS-UGA, petA-psbJ, and rpl22-rps19), ccsA-ndhD was in the SSC region, while the other five regions were in the LSC region. Of the 18 regions with 0.02 < Pi ≤ 0.03 (5′-trnK-UUU-rps16, trnC-GCA-petN, trnG-UCC-trnR-UCU, rps16-trnQ-UUG, rps3-rpl22, trnD-GUC-trnY-GUA, rpl32-trnL-UAG, ndhF-rpl32, 3′-rps12-clpP, trnS-GCU-trnG-UCC, rps4-trnT-UGU, psbK-psbI, atpF-atpH, ndhC-trnV-UAC, trnP-UGG-psaJ, accD-psaI, psbT-psbN, and petN-psbM), two regions (rpl32-trnL-UAG, ndhF-rpl32) were in the SSC region, and the remaining 16 regions were located in the LSC region. In general, regions located in the IR region exhibited lower Pi values compared with those in the LSC and SSC regions, indicating that the IR region is relatively more conserved. Moreover, coding regions were less variable than noncoding regions, with the most highly variable regions located in the intergenic spacers.
Comparison of the nucleotide diversity (Pi) values of 264 regions in 28 Geum chloroplast genomes.
Considering both sequence length and variability, among the 16 regions with Pi > 2% and alignment lengths > 400 bp, 11 regions (3′-trnK-UUU-matK, psbZ-trnG-GCC, trnR-UCU-atpA, petA-psbJ, 5′-trnK-UUU-rps16, rps16-trnQ-UUG, rpl32-trnL-UAG, ndhF-rpl32, trnS-GCU-trnG-UCC, ndhC-trnV-UAC, and petN-psbM) were proposed as candidate molecular markers for Geum, suitable for developing specific DNA barcodes. In our study, the core DNA barcodes trnH-GUG-psbA exhibited the highest Pi value of 0.04487, whereas matK and rbcL showed relatively low Pi values of 0.00962 and 0.00869, respectively. Although trnH-GUG-psbA exhibited the highest Pi value, its relatively short length limits the number of informative sites. The cp molecular markers trnL intron and trnL-trnF intergenic spacer, previously used in phylogenetic studies of Geum species (Smedmark and Eriksson, 2002; Faghir et al., 2018; Lv et al., 2020; Protopopova et al., 2023), had Pi values of only 0.01198 and 0.01856 in our dataset, respectively. To further assess the resolving power of the 11 candidate molecular markers compared with the core DNA barcodes, NJ trees were reconstructed individually for each sequence (Supplementary Figures S3–S16). The resolution ability of these sequences was evaluated based on both the number of successfully identified species and the support values in the NJ tree. Overall, the 11 candidate molecular markers demonstrated better resolution than the core DNA barcodes trnH-GUG-psbA and rbcL. Among the 11 candidates, nine markers—excluding psbZ-trnG-GCC and 5′-trnK-UUU-rps16—also outperformed the core DNA barcode matK. In this study, the relatively lower resolution of psbZ-trnG-GCC and 5′-trnK-UUU-rps16 compared with matK was mainly due to their inability to correctly identify G. henryi. In future research, the utility of the 11 candidate molecular markers for Geum can be further evaluated with more detailed taxon sampling and larger numbers of population samples per species. In conclusion, the development of specific molecular markers for particular taxonomic groups is necessary, and the new candidate markers identified in this study will facilitate future research on species identification and the phylogeny of Geum.
Phylogenetic analyses
3.3
Overall, compared with previous phylogenetic studies on Geum using cp molecular markers (Smedmark and Eriksson, 2002; Faghir et al., 2018; Protopopova et al., 2023), our study achieved higher phylogenetic resolution based on plastid genome data. Phylogenetic trees inferred using ML and BI analyses were consistent in topology (Figure 4; Supplementary Figures S17, S18). In all analyses, outgroups were robustly separated from the tribe Colurieae (ML BS = 100%, PP = 1.00). All sampled Geum species formed a well-supported clade (ML BS = 100%, PP = 1.00), confirming the monophyly of the current delimitation of Geum. Under the current sampling, two major clades were recovered within Geum. One comprised G. rupestre, G. henryi, and G. omeiense, with G. omeiense being sister to G. henryi and G. rupestre. The other consisted of two subclades: one including G. longifolium, G. elatum var. elatum, and G. elatum var. humile. Geum triflorum, and G. macrophyllum; the other consisting of G. aleppicum, G. japonicum var. chinense, and Geum urbanum. Multiple samples of G. rupestre, G. henryi, and G. omeiense clustered into separate branches, corroborating the monophyly of the three species and supporting their treatment as distinct species. A sample of G. longifolium was deeply nested within multiple samples of G. elatum, supporting the inclusion of G. longifolium in G. elatum as a conspecific taxon from a molecular phylogenetic perspective. Geum longifolium appears highly similar in morphology to G. elatum, especially in prominent features such as yellow flowers and basal, interrupted, pinnately compound leaves, but the most significant difference is that the former has wholly deciduous styles, whereas the latter has straight, nonplumose, persistent styles (Yü and Kuan, 1985; Yü and Li, 1985; Smedmark and Eriksson, 2002; Li et al., 2003). Future detailed morphological and phylogeographic studies based on a more comprehensive sampling strategy are necessary for any further possible taxonomic treatment of G. longifolium. Two samples of G. urbanum, which clustered together, were embedded within a large clade comprising different samples of G. aleppicum and G. japonicum var. chinense that were intermixed. The results showed that these three Geum taxa are nonmonophyletic. Morphologically, they are distinguished by differences such as petal size versus sepal size, shape of the capitulum of fruitlets, and the hair case of the receptacle (Juzepchuk, 1941; Yü and Kuan, 1985; Yü and Li, 1985; Li et al., 2003; Rohrer, 2014). Geographically, G. urbanum is native to Europe to Central Asia and Iran, NW. Africa; G. aleppicum is native to the temperate Northern Hemisphere to Mexico; and G. japonicum var. chinense is native to China, according to Plants of the World Online (http://powo.science.kew.org). The complicated evolutionary history and relationships among these three taxa still need to be clarified through expanded taxon sampling and the use of single‐copy nuclear genes in the future. Geum elatum, which was previously placed in Acomastylis, was nested within the species of Geum. Consistent with previous studies (Smedmark and Eriksson, 2002; Smedmark, 2006), our results supported the inclusion of Acomastylis species within Geum. Geum longifolium, G. henryi, and G. omeiense, which were once placed in Coluria, did not cluster together in our phylogenetic tree. Geum longifolium was closer to G. elatum than to G. henryi and G. omeiense, whereas G. henryi and G. omeiense showed a close affinity with G. rupestre, which was formerly treated as a member of the genus Taihangia.
Phylogenetic trees of Geum and its related taxa based on 37 chloroplast genome sequences with the inverted repeat region IRa removed. Agrimonia pilosa, Potentilla suavis, Rosa minutifolia, and Rubus alceifolius were used to root the trees. Values along branches represent ML bootstrap percentages (only values < 100% are shown) and Bayesian posterior probabilities (only PP < 1.00 are shown), respectively.
Consistent with the studies of Smedmark and Eriksson (2002) and Faghir et al. (2018), our analyses indicated that Coluria is not a monophyletic group. The phylogenetic results presented here support treating Coluria as part of Geum. The genus Taihangia was nested within Geum species in Smedmark and Eriksson (2002). In conclusion, the results presented here supported Smedmark’s recircumscription of Geum in a broad sense and corroborate the inclusion of Acomastylis, Coluria, and Taihangia within Geum.
Adaptive evolution
3.4
In cases where the p-values of LRTs were below the threshold of 0.05 for the four compared models—M0 vs. M3, M1a vs. M2a, M7 vs. M8, and M8a vs. M8—the NEB analysis (Nielsen and Yang, 1998) was used to identify sites under positive selection with posterior probabilities ≥ 0.95 in model M3, while the BEB analysis (Yang et al., 2005) was used to identify sites under positive selection with posterior probabilities ≥ 0.95 in models M2a and M8, according to the PAML manual (Yang, 2007) (Table 2; Supplementary Table S4). The results showed that 48 genes had positive selection sites under model M3, none under model M2a, and 23 under model M8. The PAML manual (Yang, 2007) stated that the compared model M1a vs. M2a is more stringent than M7 vs. M8, which is corroborated by the results of our study. In addition, the PAML manual (Yang, 2007) suggested that the compared model M0 vs. M3 should be utilized to test for variable ω among sites, rather than as a test of positive selection. Therefore, we relied on the results from M7 vs. M8 and M8a vs. M8 to identify positively selected sites in Geum cp genomes. The BEB analysis based on the M8 model detected 90 positive selection sites across a total of 23 genes (Table 2). The number of the positive selection sites among these genes ranged from one to 39: ycf1 with 39 sites; ndhF with 14 sites; three genes (matk, rbcL, and accD) with four sites; two genes (rpl22 and ndhD) with three sites; three genes (atpA, rpoC2, and psaA) with two sites; and 13 genes (atpF, rpoC1, rps4, cemA, psbJ, clpP, rps3, ycf2, ccsA, ndhI, ndhA, ndhH, and rps15) with one site. These 23 PCGs with positively selected sites included three small subunit ribosomal genes (rps3, rps4, rps15); one large subunit ribosomal gene (rpl22); two DNA-dependent RNA polymerase (plastid-encoded bacterial-type RNA polymerase [PEP]) subunit genes (rpoC1, rpoC2); two ATP synthase subunit genes (atpA, atpF); two photosystem I (PSI) complex genes (psaA, psaB); a photosystem II (PSII) core complex gene (psbJ); five NAD(P)H dehydrogenase genes subunit genes (ndhA, ndhD, ndhF, ndhI, ndhH); the ribulose-1,5-bisphosphate carboxylase (Rubisco) large subunit gene (rbcL); the acetyl-CoA-carboxylase subunit gene (accD); the c-type cytochrome synthesis gene (ccsA); the cp membrane protein gene (cemA); the ATP-dependent Clp protease proteolytic subunit gene (clpP); the maturase gene (matK); as well as ycf1 and ycf2.
Geum species occur in various habitats such as hillside grasslands, moist meadows, swamps, riverine scrub, rocky slopes, moist woods, rocky cliffs and ledges, alpine meadows, and arctic tundra, ranging from low to high altitudes (0–5,400 m) and often at high elevations (Juzepchuk, 1941; Smedmark and Eriksson, 2002; Li et al., 2003; Rohrer, 2014). The adaptive evolution of these 23 genes may contribute to the ability of Geum species to thrive in such diverse habitats. Genes such as rps3, rps4, rps15, and rpl22 are ribosomal protein subunit genes that encode ribosomal proteins. The cp ribosomal proteins are important components of the protein synthesis machinery in all living cells, influencing plant growth and development and facilitating responses to stress conditions (Tiller and Bock, 2014; Zhang et al., 2016; Robles and Quesada, 2022). The plastid RNA polymerase subunits β’ and β”, encoded by genes rpoC1 and rpoC2, respectively, are two of the four enzymatic subunits that constitute the catalytic core of the PEP (Zhelyazkova et al., 2012; Pfalz et al., 2015). The atpA and atpF genes encode two of the six ATP synthase subunits encoded by the plastome, and the cp ATP synthase generates the ATP needed for plant growth and photosynthesis (Wicke et al., 2011; Yamamoto et al., 2023). The psaA and psaB genes encode two major subunits of PSI, which bind to the iron–sulfur reaction center that mediates the majority of the electron transfer events (Nelson and Yocum, 2006; Wicke et al., 2011). The subunit PsbJ, encoded by the gene psbJ, is essential for the stable formation of PSII–light-harvesting complex (LHCII) supercomplexes, thereby enabling the higher-order organization of PSII complexes (Suorsa et al., 2004). The ndh genes, including ndhA, ndhD, ndhF, ndhI, and ndhH, encode subunits of the Ndh-1 complex, which plays a significant role in plant adaptation to environmental stress (Endo et al., 1999; Rumeau et al., 2007; Yamori et al., 2011). The gene rbcL encodes the large subunit of Rubisco (Wicke et al., 2011), and Rubisco mediates the fixation of inorganic carbon from CO_2_ into usable sugars during photosynthesis (Wilson and Hayer-Hartl, 2018; Whitney and Sharwood, 2021). The gene cemA encodes cp envelope membrane protein A, which is localized in the inner cp envelope membrane and mediates CO_2_ uptake (Sasaki et al., 1993; Katoh et al., 1996; Rolland et al., 1997). The gene clpP in the cp encodes one of the proteolytic subunits of the ATP-dependent Clp protease. Clp protease is involved in the degradation of polypeptides and is important for cp function, plant development, and stress acclimation (Clarke, 1999; Adam and Clarke, 2002; Kuroda and Maliga, 2003; Clarke et al., 2005). The gene accD encodes the beta-carboxyl transferase subunit of acetyl-CoA carboxylase (ACCase) (Wakasugi et al., 2001). ACCase in plastids is the regulatory enzyme of de novo fatty acid synthesis, which is crucial for leaf and seed development, storage metabolism, and cp division (Rawsthorne, 2002; Kode et al., 2005; Caroca et al., 2021). Cytochrome c biosynthesis protein, encoded by the ccsA gene, is essential for c-type cytochrome biosynthesis at the step of heme attachment (Xie and Merchant, 1996). Maturase K, encoded by the matK gene, is involved in the posttranscriptional processing of chloroplasts and is related to plant development and photosynthesis (Barthet and Hilu, 2007). The ycf1 and ycf2 genes are essential genes in the cp genomes of higher plants and encode products necessary for cell survival (Drescher et al., 2000). The origin of Geum was dated to the Miocene, 17 million years before the present (MYBP), with a 95% confidence interval from 10 to 26 MYBP (Smedmark et al., 2003; Smedmark, 2006). In conclusion, these 23 genes with sites under positive selection in the Geum cp genomes are associated with biological processes such as photosynthesis, biosynthesis, and self-replication, which may be key factors enabling the adaptation of Geum species to their habitats over evolutionary history.
Conclusion
4
In summary, comparative analyses showed that the 28 Geum cp genomes were conserved in structure, size, GC content, gene order, and gene content. Eleven regions (3′-trnK-UUU-matK, psbZ-trnG-GCC, trnR-UCU-atpA, petA-psbJ, 5′-trnK-UUU-rps16, rps16-trnQ-UUG, rpl32-trnL-UAG, ndhF-rpl32, trnS-GCU-trnG-UCC, ndhC-trnV-UAC, and petN-psbM) may serve as candidate DNA molecular markers for future studies on population genetics and systematic evolution of Geum species. Our phylogenetic analyses provided new insights into the relationships among Geum species, supported Smedmark’s broad recircumscription of Geum, and corroborated the inclusion of Acomastylis, Coluria, and Taihangia within the genus. A total of 23 genes with positively selected sites were identified, suggesting that adaptive evolution of these genes may play important roles in the adaptation of Geum species to their habitats. Overall, this study offers valuable insights into cp genome characteristics, phylogeny, and adaptive evolution in Geum. Broader taxon sampling at a global scale and incorporation of single-copy nuclear genes will further clarify the phylogenetic relationships and evolutionary history of this group.
The reference list from the paper itself. Each links out to its DOI / PubMed record.
- 1Adam Z. Clarke A. K. (2002). Cutting edge of chloroplast proteolysis. Trends Plant Sci. 7, 451–456. doi: 10.1016/s 1360-1385(02)02326-9, PMID: 12399180 · doi ↗ · pubmed ↗
- 2Barthet M. M. Hilu K. W. (2007). Expression of mat K: functional and evolutionary implications. Am. J. Bot. 94, 1402–1412. doi: 10.3732/ajb.94.8.1402, PMID: 21636508 · doi ↗ · pubmed ↗
- 3Birnesser H. Stolt P. (2007). The homeopathic antiarthitic preparation Zeel comp. N: a review of molecular and clinical data. Explore 3, 16–22. doi: 10.1016/j.explore.2006.10.002, PMID: 17234564 · doi ↗ · pubmed ↗
- 4Blaschek W. Eble S. Hilgenfeldt U. Holzgrabe U. Reichling J. Schulz V. (2018). Hagers Enzyklopädie der Arzneistoffe und Drogen (Stuttgart, Germany: Wiss. Verl.-Ges).
- 5Bolger A. M. Lohse M. Usadel B. (2014). Trimmomatic: a flexible trimmer for Illumina sequence data. Bioinformatics 30, 2114–2120. doi: 10.1093/bioinformatics/btu 170, PMID: 24695404 PMC 4103590 · doi ↗ · pubmed ↗
- 6Bolle F. (1933). Eine Übersicht über die Gattung Geum L. und die ihr nahestehenden Gattungen. Feddes Repert. 72, 1–119.
- 7Brouillet L. (2014). “ Colurieae Rydb,” in Flora of North America North of Mexico, vol. 9. ( Oxford University Press, New York and Oxford). Flora of North America Editorial Committee, 57.
- 8Capella-Gutiérrez S. Silla-Martínez J. M. Gabaldón T. (2009). trim Al: a tool for automated alignment trimming in large-scale phylogenetic analyses. Bioinformatics. 25, 1972–1973. doi: 10.1093/bioinformatics/btp 348, PMID: 19505945 PMC 2712344 · doi ↗ · pubmed ↗