Proton pump inhibitor use and risk of depression among Sudanese adults: a cross-sectional community-based study
Afnan A. Alwabili, Saeed M. Omar, Eman A. Alotaibi, Ishag Adam

TL;DR
This study found that using proton pump inhibitors may be linked to a higher risk of depression in adults from Central Sudan.
Contribution
The study is the first to explore the association between PPI use and depression in Sudanese adults.
Findings
PPI use was associated with higher depression scores after adjusting for confounders.
PPI users had a higher odds of depression compared to non-users.
The association remained significant after propensity score matching.
Abstract
Depression is a major global public health issue. There is little available data regarding the association between the use of proton pump inhibitors (PPIs) and depression. The current study aimed to investigate the association between PPIs and depression among adults in Central Sudan. A community-based cross-sectional study was conducted to examine adults in Central Sudan. Sociodemographic data and medical history were collected. Depression was assessed using the Patient Health Questionnaire-9 (PHQ-9). Multivariate binary regression analyses, modified Poisson regression analyses, and propensity score matching (PSM) were performed. We enrolled 914 adults (317 [34.7%] men and 597 [65.3%] women). Participants’ median (interquartile range) age was 38.0 (27.0–52.0) years. Of the participants, 255 (27.9%) had used PPIs. In Poisson regression, after adjusting for confounders (age, sex,…
Genes, proteins, chemicals, diseases, species, mutations and cell lines named across the full text — each resolved to its canonical identifier and authoritative record.
Click any figure to enlarge with its caption.
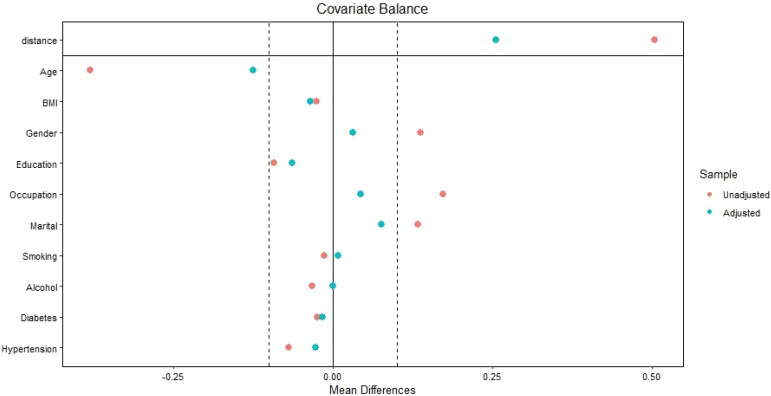 Figure 1
| Characteristics | Median | Interquartile range | ||
|---|---|---|---|---|
| Age, years | 38.0 | 27.0–52.0 | ||
| Body mass index, kg/m2 | 21.6 | 18.7–25.8 | ||
| Number | Percentage | |||
| Sex | Male | 317 | 34.7 | |
| Female | 597 | 65.3 | ||
| Education status | ≥ Secondary | 238 | 26.0 | |
| < Secondary | 676 | 74.0 | ||
| Occupation status | Employed | 288 | 31.5 | |
| Unemployed | 626 | 68.5 | ||
| Marital status | Married | 646 | 70.7 | |
| Unmarried/divorced | 68 | 29.3 | ||
| Smoking status | No | 761 | 83.3 | |
| Yes | 153 | 16.7 | ||
| Alcohol consumption | No | 842 | 92.1 | |
| Yes | 72 | 7.9 | ||
| Diabetes mellitus | No | 836 | 91.5 | |
| Yes | 78 | 8.5 | ||
| Hypertension | No | 618 | 67.6 | |
| Yes | 296 | 32.4 | ||
| Proton pump inhibitor intake | No | 659 | 72.1 | |
| Yes | 255 | 27.9 | ||
| Univariate analysis | Multivariate analysis | ||||||
|---|---|---|---|---|---|---|---|
| Characteristics | Relative risk | 95% confidence interval | P value | Adjusted relative risk | 95% confidence interval | P value | |
| Age, years | 0.99 | 0.990–0.994 | < 0.001 | 0.995 | 0.993–0.998 | < 0.001 | |
| Body mass index, kg/m2 | 0.99 | 0.90–1.01 | 0.645 | ||||
| Sex | Male | Reference | < 0.001 | < 0.001 | |||
| Female | 1.13 | 1.22–1.41 | 1.27 | 1.13–1.42 | |||
| Education status | ≥ Secondary | Reference | < 0.001 | Reference | < 0.001 | ||
| < Secondary | 0.83 | 0.77–0.89 | 0.88 | 0.82–0.95 | |||
| Occupation status | Employed | Reference | < 0.001 | Reference | 0.141 | ||
| Unemployed | 1.18 | 1.09–1.26 | 0.91 | 0.82–1.02 | |||
| Marital status | Married | Reference | < 0.001 | Reference | |||
| Unmarried/divorced | 1.18 | 1.10–1.27 | 1.12 | 1.04–1.20 | 0.002 | ||
| Smoking status | No | Reference | 0.830 | Reference | |||
| Yes | 1.01 | 0.92–1.10 | |||||
| Alcohol consumption | No | Reference | 0.931 | Reference | |||
| Yes | 1.01 | 0.89–1.12 | |||||
| Proton pump inhibitor intake | No | Reference | < 0.001 | Reference | |||
| Yes | 1.32 | 1.23–1.41 | 1.30 | 1.21–1.40 | < 0.001 | ||
| Diabetes mellitus | No | Reference | Reference | ||||
| Yes | 1.11 | 0.99–1.26 | 0.069 | 0.92 | 0.81–1.04 | 0.210 | |
| Hypertension | No | Reference | < 0.001 | Reference | 0.117 | ||
| Yes | 1.14 | 1.06–1.20 | 1.06 | 0.98–1.14 | |||
| Adults with depression (n = 155) | Adults without depression (n = 795) | Univariate analysis | |||
|---|---|---|---|---|---|
| Characteristics | Median (interquartile range) | Median (interquartile range) | Odds ratio (95% confidence interval) | P value | |
| Age, years | 33.0 (23.0–45.0) | 40.0 (28.0–55.0) | 0.97 (0.96–0.98) | < 0.001 | |
| Body mass index, kg/m2 | 21.3 (18.6–25.0) | 21.9 (18.7–25.8) | 0.99 (0.97–1.01) | 0.786 | |
| Number (%) | Number (%) | ||||
| Sex | Male | 36(23.2) | 281(37.0) | Reference | 0.001 |
| Female | 119(76.8) | 478(63.1) | 1.94 (1.30–2.90) | ||
| Education status | ≥ Secondary | 52 (33.5) | 186 (24.5) | Reference | 0.020 |
| < Secondary | 103 (66.5) | 573 (75.5) | 0.64 (0.44–0.93) | ||
| Occupation status | Employed | 37 (23.9) | 251 (33.1) | Reference | 0.026 |
| Unemployed | 118 (76.1) | 508 (66.9) | 1.57 (1.05–2.34) | ||
| Marital status | Married | 92 (59.4) | 554 (73.0) | Reference | 0.001 |
| Unmarried/divorced | 63 (40.6) | 205 (27.0) | 1.85 (1.29–2.64) | ||
| Smoking status | No | 131 (84.5) | 630 (83.0) | Reference | 0.464 |
| Yes | 24 (15.5) | 129 (17.0) | 0.89 (0.55–1.43) | ||
| Alcohol consumption | No | 147 (94.8) | 695 (91.6) | Reference | 0.173 |
| Yes | 8 (5.2) | 64 (8.4) | 0.59 (0.27–1.25) | ||
| Proton pump inhibitor intake | No | 98 (63.2) | 561 (73.9) | Reference | 0.007 |
| Yes | 57 (36.8) | 198 (26.1) | 1.64 (1.14–2.37) | ||
| Diabetes mellitus | No | 145 (93.5) | 691 (91.0) | Reference | 0.311 |
| Yes | 10 (6.5) | 35 (9.0) | 0.70 (0.35–1.39) | ||
| Hypertension | No | 114 (73.5) | 504 (66.4) | Reference | 0.084 |
| Yes | 41 (26.5) | 255 (33.6) | 0.71 (0.48–1.04) | ||
| Before matching | After matching | ||||||
|---|---|---|---|---|---|---|---|
| Variable | Adjusted odds ratio | 95% confidence interval | P value | Adjusted odds ratio | 95% confidence interval | P value | |
| Age, years | 0.98 | 0.97–0.99 | 0.014 | 0.99 | 0.98–1.01 | 0.301 | |
| Sex | Male | Reference | 0.086 | ||||
| Female | 1.78 | 0.92–3.43 | |||||
| Education status | ≥ Secondary | Reference | 0.235 | Reference | 0.232 | ||
| < Secondary | 0.78 | 0.52–1.17 | 0.78 | 0.52–1.16 | |||
| Occupation status | Employed | Reference | 0.742 | ||||
| Unemployed | 0.89 | 0.47–1.69 | |||||
| Marital status | Married | Reference | 0.015 | Reference | 0.095 | ||
| Unmarried/divorced | 1.59 | 1.09–2.32 | 1.37 | 0.94–1.98 | |||
| Alcohol consumption | No | Reference | 0.516 | ||||
| Yes | 1.33 | 0.56–3.17 | |||||
| Proton pump inhibitor intake | No | Reference | 0.010 | Reference | 0.008 | ||
| Yes | 1.64 | 1.12–2.41 | 1.66 | 1.13–2.41 | |||
| Hypertension | No | Reference | 0.658 | ||||
| Yes | 0.91 | 0.60–1.39 | |||||
| Before matching | After matching | ||||||
|---|---|---|---|---|---|---|---|
| Adults with depression (n = 155) | Adults without depression (n = 759) | P | Adults with depression (n = 155) | Adults without depression (n = 620) | P | ||
| Characteristics | Median (interquartile range) | Median (interquartile range) | |||||
| Age, years | 33.0 (23.0–45.0) | 40.0 (28.0–55.0) | <0.001 | 33.0 (23.0–45.0) | 35.0 (26.0–45.0) | 0.033 | |
| Body mass index, kg/m2 | 21.3 (18.6–25.0) | 21.9 (18.7–25.8) | 0.453 | 21.3 (18.6–25.0) | 21.7 (18.6–26.1) | 0.580 | |
| Number (%) | Number (%) | ||||||
| Sex | Male | 36(23.2) | 281(37.0) | 0.001 | 36(23.2) | 163(26.3) | 0.473 |
| Female | 119(76.8) | 478(63.1) | 119(76.8) | 457(73.7) | |||
| Education status | ≥ Secondary | 52 (33.5) | 186 (24.5) | 0.021 | 52 (33.5) | 173 (27.9) | 0.138 |
| < Secondary | 103 (66.5) | 573 (75.5) | 103 (66.5) | 447 (72.1) | |||
| Occupation status | Employed | 37 (23.9) | 251 (33.1) | 0.025 | 37 (23.9) | 159 (25.6) | 0.896 |
| Unemployed | 118 (76.1) | 508 (66.9) | 118 (76.1) | 461 (74.4) | |||
| Marital status | Married | 92 (59.4) | 554 (73.0) | 0.001 | 92 (59.4) | 419 (67.6) | 0.088 |
| Unmarried/divorced | 63 (40.6) | 205 (27.0) | 63 (40.6) | 201 (32.4) | |||
| Smoking status | No | 131 (84.5) | 630 (83.0) | 0.724 | 131 (84.5) | 529 (85.3) | 0.801 |
| Yes | 24 (15.5) | 129 (17.0) | 24 (15.5) | 91 (14.7) | |||
| Alcohol consumption | No | 147 (94.8) | 695 (91.6) | 0.193 | 147 (94.8) | 588 (94.8) | 0.594 |
| Yes | 8 (5.2) | 64 (8.4) | 8 (5.2) | 32 (5.2) | |||
| Proton pump inhibitor intake | No | 98 (63.2) | 561 (73.9) | 0.008 | 98 (63.2) | 452 (72.9) | 0.023 |
| Yes | 57 (36.8) | 198 (26.1) | 57 (36.8) | 168 (27.1) | |||
| Diabetes mellitus | No | 138 (89.0) | 698 (92.0) | 0.348 | 138 (89.0) | 542 (87.4) | 0.682 |
| Yes | 17 (11.0) | 61 (8.0) | 17 (11.0) | 78 (12.6) | |||
| Hypertension | No | 114 (73.5) | 504 (66.4) | 0.090 | 114 (73.5) | 439 (70.8) | 0.552 |
| Yes | 41 (26.5) | 255 (33.6) | 41 (26.5) | 181 (29.2) | |||
Peer Reviews
No public reviews on file for this paper yet. If you reviewed it on a platform where reviews are public (OpenReview, ICLR, NeurIPS, ICML), you can paste yours below so the community can read it here.
Videos
No videos yet. Explain this paper in a talk, walkthrough, or lecture? Add one.
Taxonomy
TopicsGastroesophageal reflux and treatments · Sleep and related disorders · Pneumonia and Respiratory Infections
Introduction
1
Depression is a major public health issue affecting millions of people globally (1). Several sociodemographic factors, including age (2, 3), marital status (2), education (2), smoking (4), body mass index (BMI) (2), and presence of comorbidity (e.g., diabetes mellitus and hypertension) (2, 4) are associated with depression among adults. Although the precise etiology of depression has not yet been established, the condition is considered to have a complex and multifactorial etiology involving a range of factors, including genetic predispositions, psychosocial stressors, neurobiological imbalances, and lifestyle (5, 6).
Proton pump inhibitors (PPIs) are the primary therapeutic drugs for treating gastric acid-related diseases, including peptic ulcers and gastroesophageal reflux disease. PPIs are widely used and can be purchased over the counter without a prescription in several countries (7, 8). Although an adequate safety profile for PPIs has been established for several years, recent studies have reported that their use may be associated with the potential risk of depression (9–12). Few studies examining the association between PPI use and depression have been conducted in developing countries (9–12). Thus, further studies are needed to investigate this issue in other populations, including in sub-Saharan African countries, in which poor mental health has been reported (13). A prevalence rate of 18% for depression was reported among adults in Ethiopia (4). A recent study reported that 62% of internally displaced persons in Sudan had depression (3). Moreover, Central Sudan, like many regions in sub-Saharan Africa, faces unique health challenges in the presence of armed conflict, including a high burden of mental health disorders (14). However, specific research assessing the association between PPIs and depression in this setting is scarce. Thus, the current study aimed to examine the association between PPIs and depression among adults in Central Sudan.
Methods
2
Study design and setting
2.1
This community-based multistage survey was conducted in Elrikieb, East Gezira, in Central Sudan from April to June 2025. Elrikieb is a large village chosen because it comprises four sub-villages, whose inhabitants resemble those of the entire Gezira State. The “Strengthening the Reporting of Observational Studies in Epidemiology (STROBE) guidelines” were strictly followed (15).
Study population and sampling
2.2
The study population comprised men and women aged 18 years or older residing in the selected communities. Exclusion criteria were as follows: an inability to provide informed consent, severe cognitive impairment precluding reliable questionnaire completion, and those who would not ensure the Patient Health Questionnaire-9 (PHQ-9) primarily reflects depressive symptoms.
A multistage stratified random sampling approach was employed to select participants. Within each selected sub-village, households were randomly chosen.
Sample size calculation
2.3
A sample size of 914 participants was calculated based on the assumption that approximately 30% of adults would have depression. This assumption was based on the findings of a previous study in Northern Sudan, which reported that 39% of adults had depression-anxiety (16). Additionally, depending on the earlier reports on drugs used in Sudan (17), we assumed that approximately 30% of depressed adults would have used PPIs. In comparison, 20% of adults without depression would have used PPIs. An analysis with this sample size would have 80% power and an alpha level of 0.05 for statistical significance.
Data collection
2.4
After the participants provided written informed consent, data were collected by trained medical officers (two men and two women) through face-to-face interviews using a questionnaire. The questionnaires included data on sociodemographic factors, such as age, sex, education level, marital status, employment status, smoking status, alcohol use, medical history, including diabetes mellitus and hypertension, as well as other medications used, including PPIs. In cases where patients reported a history of using PPIs, participants were asked to show the medical officer the tabs/cap to confirm their report. The participants’ weight and height were measured using the standard procedure, and their BMI was calculated as weight (kg) divided by the square of height (m^2^).
Adults were considered to have hypertension if they were diagnosed with hypertension and using medications or had newly diagnosed hypertension, which is defined by systolic blood pressure greater than or equal to 140 mm Hg or diastolic blood pressure greater than or equal to 90 mm Hg, or both. Adults were considered to have diabetes mellitus if they had already been diagnosed with diabetes mellitus.
Assessment of depression
2.5
The PHQ-9 was used to screen for depression. The PHQ-9 is a widely used, brief, and validated self-report tool for screening, diagnosing, and monitoring the severity of depression. Its utility in diverse cultural settings, including Arabic-speaking populations, has been established, making it a suitable tool for assessing depression in Sudan (18, 19). In this study, the Arabic validated version of the PHQ-9 consists of nine items, each scored from 0 to 3, yielding a total score ranging from 0 to 27 (20). Based on recent data, a score of ≥ 8 was used as the cut-off for clinically significant depression (21). Therefore, participants with a score of ≥ 8 were classified as having significant clinical depression necessitating further evaluation and management.
Data analysis
2.6
All statistical analyses were performed using SPSS for Windows (version 24.0). The Shapiro–Wilk test was used to assess the normality of the data distribution (age, BMI, and PHQ-9 scores), indicating that the data were non-normally distributed. The median (interquartile range) and number/frequency (percentage) were used to summarize the sociodemographic characteristics and PHQ-9 scores. The chi-square test was used to compare proportions between the two groups. Both univariate and multivariate analyses were performed using modified Poisson regression (depression score as a continuous variable) and binary data (with depression as a categorical variable, No/Yes) as the dependent variable and sociodemographic variables (age, education, occupation, and family history of mental illness) and PPI use as independent variables. Adults were considered to have depression if the PHQ-9 score was ≥ 8. Variables with p-values < 0.2 in the univariate analysis (Poisson and binary) were included in the multivariate analysis, adjusting for potential confounders. Propensity score matching (PSM) was used to minimize selection bias by balancing the depression and non-depression groups using the “MatchIt” package in R. The package executes the function Matchit, using depression status as the dependent variable; the other variables (excluding PPI use) are covariates, including age, marital status, BMI, sex, educational level, occupation, diabetes mellitus, hypertension, smoking status, and alcohol consumption. The test was performed using the nearest-neighbor match method at a 1:4 ratio, with a caliber width of 0.03. Adjusted odds ratios, adjusted relative risk (ARR), and 95% confidence intervals (CIs) were reported. A two-sided p-value of < 0.05 was considered to indicate statistical significance.
Results
3
General characteristics
3.1
We enrolled 914 adults (317 [34.7%] men and 597 [65.3%] women). Participants’ median (interquartile range) age and BMI were 38.0 (27.0–52.0) years and 21.6 (18.7–25.8) kg/m (2), respectively. Of the 914 participants, 238 (26.3%) had a secondary education level or higher, and 288 (31.5%) were employed. Additionally, 646 (78.2%) participants were married, 153 (16.7%) were smokers, 72 (7.9%) were alcoholics, 296 (32.4%) were hypertensive, and 78 (8.5%) had diabetes mellitus. Of the participants, 255 (27.9%) reported using PPIs (Table 1). Omeprazole, pantoprazole, lansoprazole, and esomeprazole were the most commonly used PPIs.
Factors associated with the depression score
3.2
In univariate Poisson regression, age, being female, education, occupation, marital status, hypertension, and use of PPIs were associated with depression score. Smoking, alcohol, diabetes mellitus, and BMI were not associated with depression score. After shifting the variables to a multivariate Poisson regression, age, being female, education, marital status, and use of PPIs were associated with depression score. Thus, after adjusting for confounders, PPI use (ARR = 1.30, 95% CI = 1.21–1.40) was associated with depression score. Age (ARR = 0.99, 95% CI = 0.993–0.998) and education (ARR = 0.88, 95% CI = 0.82–0.95) were inversely associated with depression score. Being female (ARR = 1.27, 95% CI = 1.13–1.42) and being unmarried/divorced (ARR = 1.12, 95% CI = 1.04–1.20) were positively associated with depression score (Table 2, Figure 1).
Love plot showing covariate balance between the covariates before (red points) and after (green points) propensity matching score in East Gezira, Sudan, 2025.
Factors associated with depression
3.3
The results revealed that 155 (17.0%) participants had depression. Before matching (PSM), there was a significantly higher number of adults who used PPIs among adults with depression compared with adults without depression [57/155(36.8% versus 198/759(26.1%), P = 0.008]. Age was significantly lower in adults with depression compared with adults without depression. In univariate analysis, age, being female, being married, having a lower level of education, occupation, and using PPIs were associated with depression. BMI, alcohol use, smoking, diabetes mellitus, and hypertension were not associated with depression (Table 3). When variables with P < 0.20 were included in the multivariate binary regression, using PPIs was associated with depression, with an adjusted odds ratio (AOR) of 1.64 (95% CI, 1.14–2.37). Age was inversely associated with depression (AOR = 0.98, 95% CI, 0.97–0.99). Being unmarried/divorced (AOR = 1.59, 95% CI, 1.09–2.32) was associated with depression. Females, level of education, and occupation were not associated with depression in multivariate analysis (confounders), Table 4.
The comparison between the variables before and after matching is shown in Table 5 (Figure 1). After marching, when the variables with P< 0.20 were shifted to the multivariate binary analysis, using PPIs was associated with depression, with an adjusted odds ratio (AOR) of 1.66 (95% CI, 1.13–2.41), Table 4.
Discussion
4
The findings of the current study revealed that using PPI was associated with higher depression scores (30.0%, ARR = 1.30, 95% CI = 1.21–1.40) and a greater odds ratio of depression (1.64, 95% CI = 1.14–2.37) before and after PSM. These findings are in accord with previous research conducted in other countries (10, 11, 22–24).
The United States National Health and Nutrition Examination Survey of 16,881 adults aged 20 years or older reported that PPI use was associated with depression (22). Laudisio et al. used the Geriatric Depression Scale in older patients (n = 344) aged > 57 years in Tuscania, Italy, and found that the use of PPIs was associated with a higher odds of depression (OR = 2.38; 95% CI = 1.02–5.5) (23). Huang et al. analyzed data from the Taiwan National Health Insurance Research Database (NHIRD), revealing that the use of PPIs was associated with depression (24). In a study in Sweden of 29,320 children aged 7–17 years, Wang et al. found that the use of PPIs was associated with a higher risk of depression (10). Moreover, PPIs were examined as part of studies of a recently developed tool (magnesium depletion score) to assess magnesium deficiency, indicating an association between PPI use and depression (2, 25, 26).
Notably, in addition to an association between PPI use and depression, a previous study reported causal relationships between peptic ulcer, gastroesophageal reflux disease (which are indicators for PPI use), and depression (11). These findings should be considered when assessing the association between PPI use and depression.
However, because this study is cross-sectional, the observed relationship needs to be interpreted with caution because PPIs are typically prescribed for gastrointestinal disorders such as peptic ulcer disease and gastroesophageal reflux, and these conditions themselves were reported to contribute to depressive symptoms through pain, chronic discomfort, sleep disturbance, and reduced quality of life. In our study, we did not collect data on specific gastrointestinal disorders (symptoms, severity, and complications). Therefore, we would not be able to adjust for this potential confounding factor. This means that the observed association may partly reflect the burden of gastrointestinal disease among PPI users rather than an independent effect of PPI use. Therefore, the findings of this relationship need to be considered as hypothesis-generating and may highlight a subgroup of adults with chronic gastrointestinal symptoms who also have a higher burden of depression and may benefit from additional gastrointestinal and mental health exploration. A larger longitudinal study, such as one that administers surveys before and after PPI use, may help examine these effects in more detail.
The precise mechanism of the association between PPIs and neuropathies/depression is unknown. However, a plausible explanation is that PPIs can lead to increased serum gastrin levels, which play a role in regulating and modifying aspects of behavior that can result in depression (27, 28). Moreover, increased gastrin levels can activate cholecystokinin type B receptors in the brain, leading to depression (29). PPIs cross the blood–brain barrier, thereby interfering with neuronal function or inducing vitamin B12 deficiency. PPIs can reduce B12 absorption by inhibiting gastric acid secretion, potentially leading to B12 deficiency. B12 deficiency can lead to an increased homocysteine level, facilitating tau hyperphosphorylation and amyloid-β (Aβ) deposition, which are associated with neuropathies and depression. Likewise, it has been postulated that PPIs can inhibit vacuolar ATPases, modulate microglial Aβ phagocytosis, and neurodegeneration (9).
Limitations of the study
4.1
The study is limited -e.g., collecting depression data from a single baseline, inability to track exact PPI usage, and lack of reporting of comorbid gastrointestinal diseases (e.g., stress ulcer, GERD) – there is not enough evidence to establish a conclusion. PPI users are likely to have gastrointestinal diseases, which can cause stress and depression.
Conclusion
5
The current study showed a positive association between PPIs and depression. Longitudinal studies will be necessary to examine this relationship in more depth.
The reference list from the paper itself. Each links out to its DOI / PubMed record.
- 1Mental GBD Collaborators D . Global, regional, and national burden of 12 mental disorders in 204 countries and territories, 1990–2019: a systematic analysis for the Global Burden of Disease Study 2019. Lancet Psychiatry. (2022) 9:137–50. doi: 10.1016/S 2215-0366(21)00395-3, PMID: 35026139 PMC 8776563 · doi ↗ · pubmed ↗
- 2Zhao W Jin H . Magnesium depletion score and depression: a positive correlation among US adults. Front Public Heal. (2024) 12:1486434. doi: 10.3389/fpubh.2024.1486434, PMID: 39564360 PMC 11573693 · doi ↗ · pubmed ↗
- 3Mohamed EH Kheir DA . Prevalence of post-traumatic stress disorder and depression and associated factors among internally displaced persons in al-galgala, Sudan. Neuropsychiatr Dis Treat. (2024) 20:1155–68. doi: 10.2147/NDT.S 462342, PMID: 38827636 PMC 11143987 · doi ↗ · pubmed ↗
- 4Molla GL Sebhat HM Hussen ZN Mekonen AB Mersha WF Yimer TM . Depression among Ethiopian adults: cross-sectional study. Psychiatry J. (2016) 2016:1468120. doi: 10.1155/2016/1468120, PMID: 27247932 PMC 4876238 · doi ↗ · pubmed ↗
- 5Winkins H . Understanding multifactorial etiology of major depres- sive disorder. J Neurol Disord. (2024) 12:130323. doi: 10.4172/2329-6895.12.2.594 · doi ↗
- 6Remes O Francisco J Templeton P . Biological, psychological, and social determinants of depression: A review of recent literature. Brain Sci. (2021) 11:1633. doi: 10.3390/brainsci 11121633, PMID: 34942936 PMC 8699555 · doi ↗ · pubmed ↗
- 7Abrahami D Mc Donald EG Schnitzer M Azoulay L . Trends in prescribing patterns of proton pump inhibitors surrounding new guidelines. Ann Epidemiol. (2021) 55:24–6. doi: 10.1016/j.annepidem.2020.12.002, PMID: 33338647 · doi ↗ · pubmed ↗
- 8de Araújo LML de Moura Lopes MV de Arruda RS Martins RR Oliveira AG . Proton pump inhibitor and community pharmacies: Usage profile and factors associated with long-term use. Plo S One. (2021) 16:e 0252785. doi: 10.1371/journal.pone.0252785, PMID: 34111166 PMC 8191994 · doi ↗ · pubmed ↗