Effect of Transcranial Direct Current Stimulation Combined With Rehabilitation on Arm and Hand Function in Stroke Patients: A Systematic Review and Meta-Analysis
Baraah A Odeh, Faisal Alotaibi, Bayan H Khamis, Norah F Almugren, Ali S Aljazi, Mohammed S Lasloom, Reem D Alshahrani, Ebtisam M Almutairi, Muzun A Zafarani, Khulud F Alshammari, Shaima Alsamiri, Yazeed S Jabr, Saleh M Alhirsan

TL;DR
Adding tDCS to rehabilitation improves arm and hand function in stroke patients, especially during the subacute phase.
Contribution
This study provides a comprehensive meta-analysis showing tDCS enhances rehabilitation outcomes in stroke recovery.
Findings
tDCS combined with rehabilitation significantly improved upper limb motor function (FMA-UE scores).
The greatest benefit was observed in the subacute phase of stroke recovery.
Functional activity and grip strength also improved with tDCS, with no significant differences between stimulation types.
Abstract
Stroke is a major cause of chronic disability, as motor deficits in the upper limbs remain a persistent issue for many survivors. Transcranial direct current stimulation (tDCS) is a potential non-invasive neuromodulation method to enhance neuroplasticity, but evidence regarding its effectiveness when paired with rehabilitation remains mixed. This systematic review and meta-analysis aimed to assess the impact of adding tDCS to rehabilitation on upper limb motor recovery and activity. Electronic databases were searched for randomized controlled trials (RCTs) comparing active tDCS (anodal, cathodal, or bihemispheric) plus rehabilitation against sham tDCS plus rehabilitation. The primary endpoint was motor impairment of the upper extremity, evaluated via the Fugl-Meyer Assessment for upper extremity (FMA-UE). Secondary endpoints comprised functional activity, grip strength, and safety…
Genes, proteins, chemicals, diseases, species, mutations and cell lines named across the full text — each resolved to its canonical identifier and authoritative record.
Click any figure to enlarge with its caption.
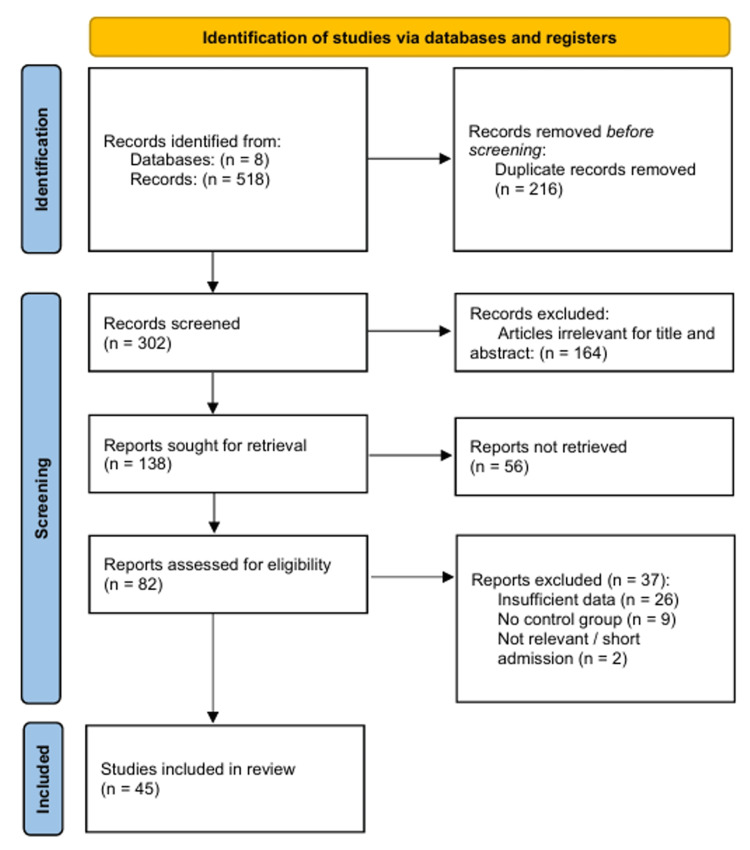 Figure 1
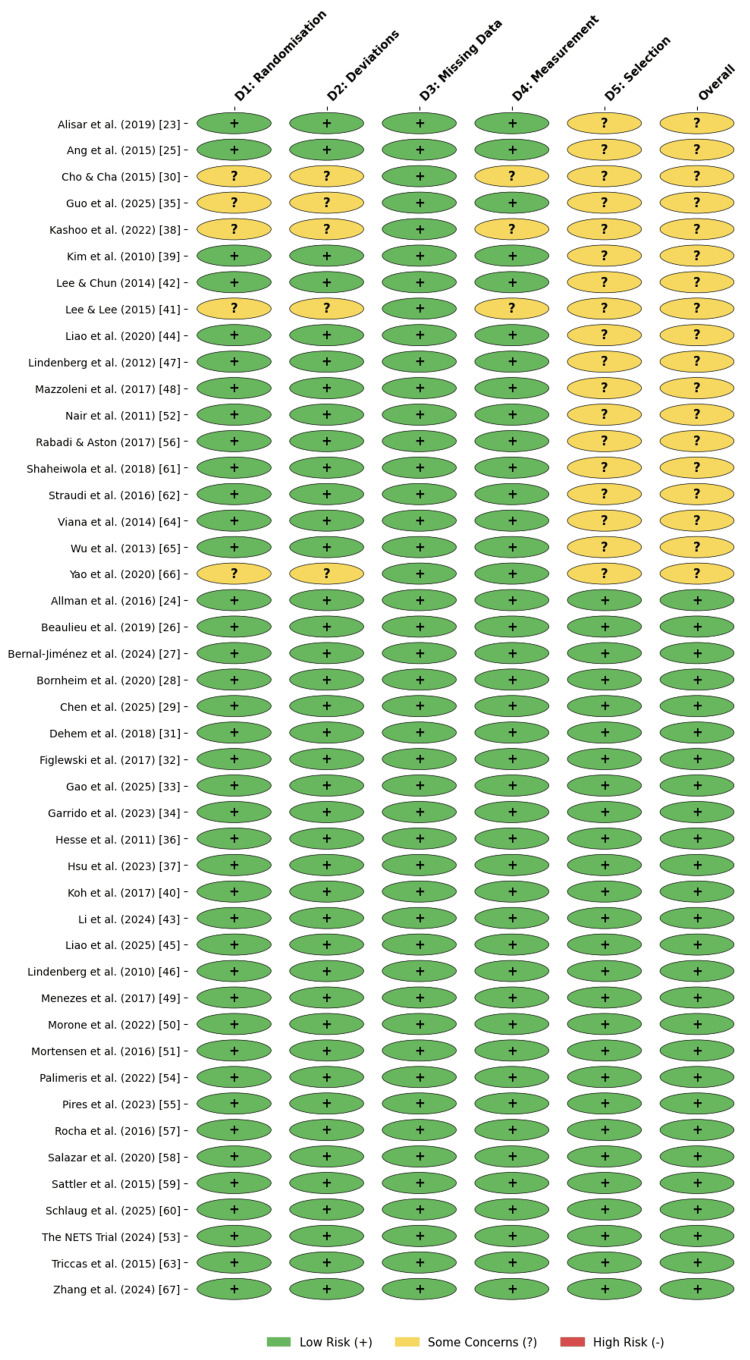 Figure 2
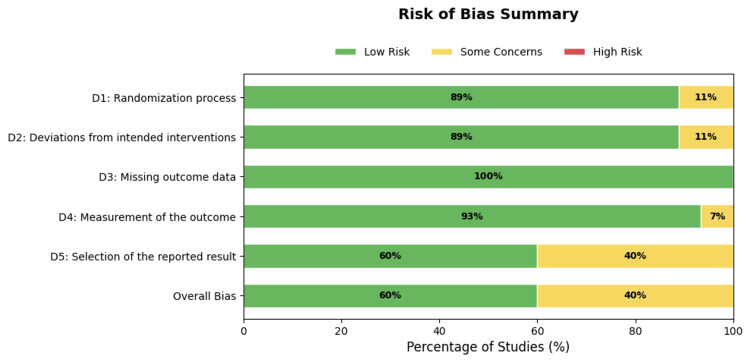 Figure 3
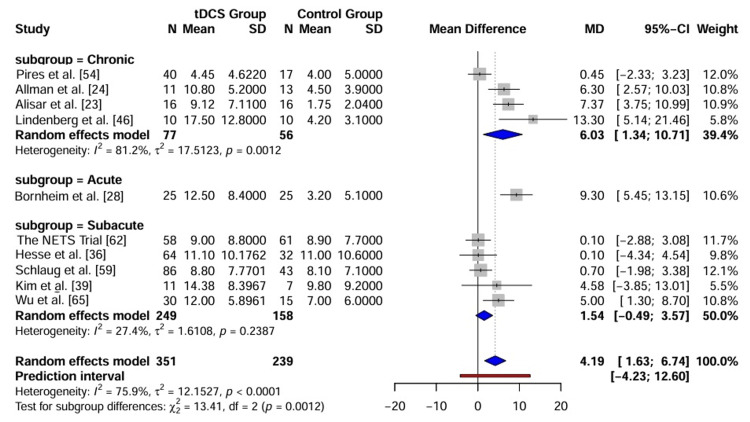 Figure 4
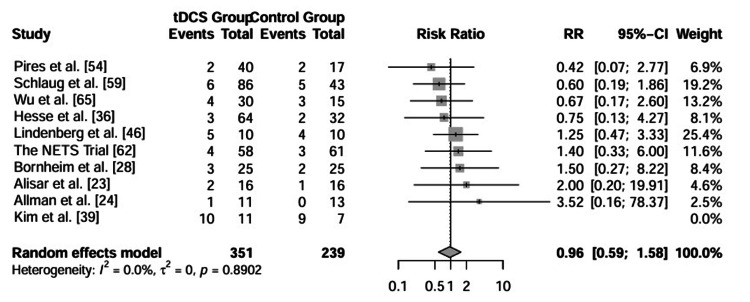 Figure 5
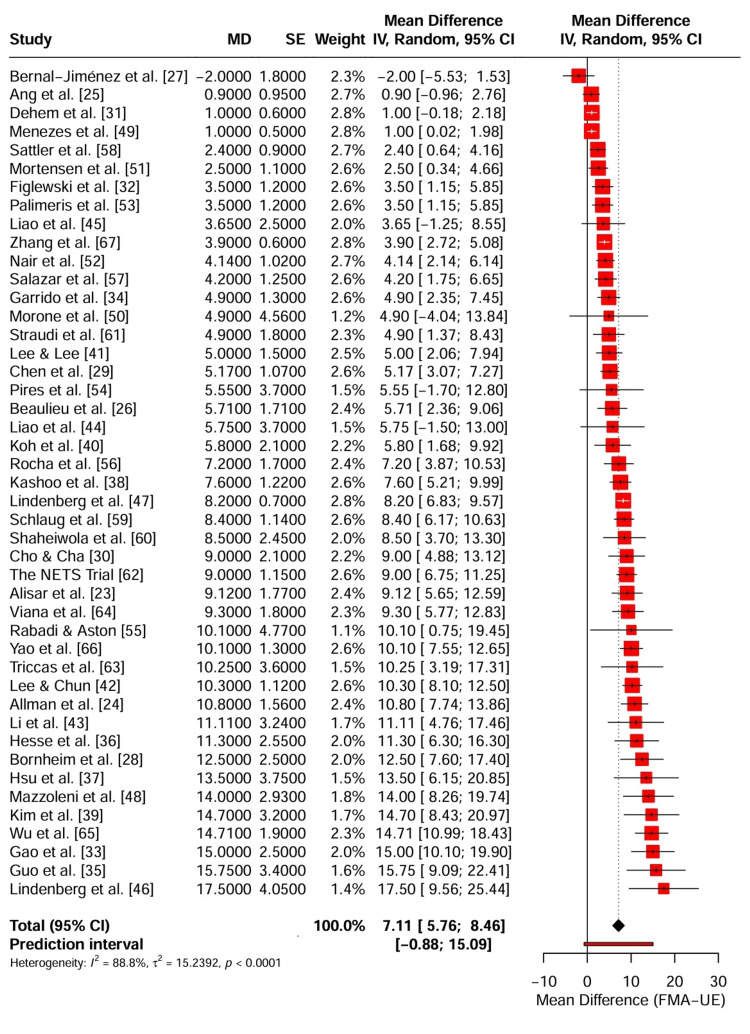 Figure 6
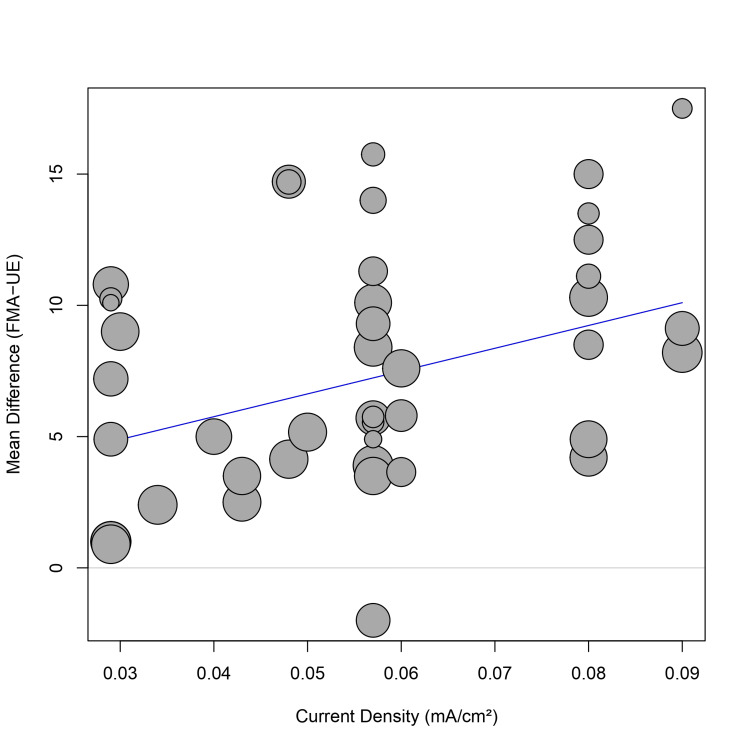 Figure 7
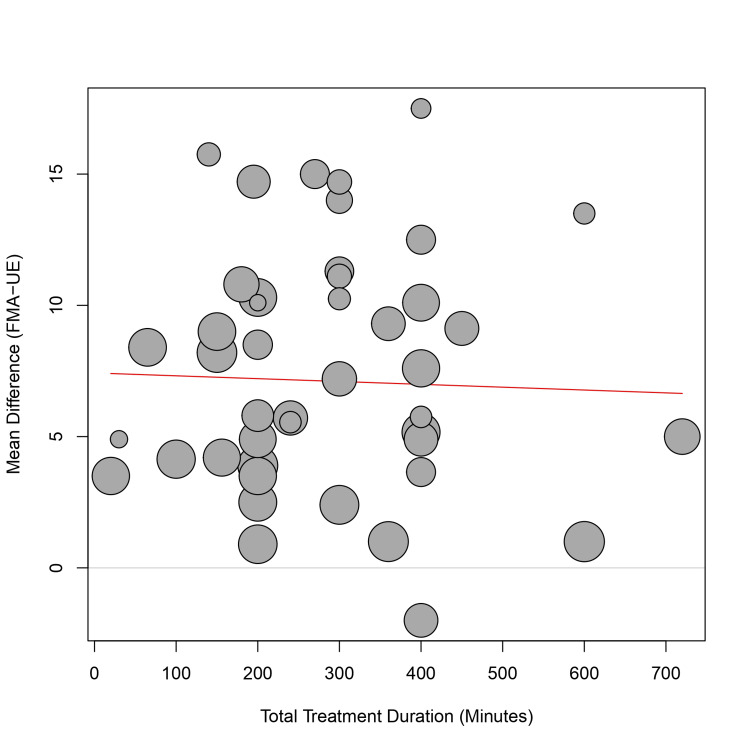 Figure 8
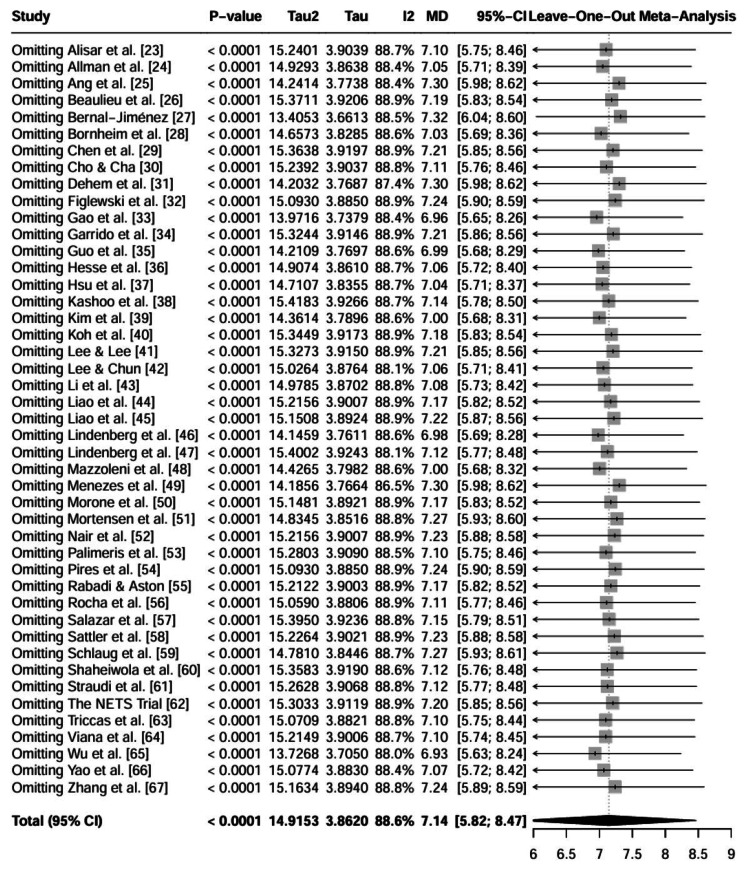 Figure 9
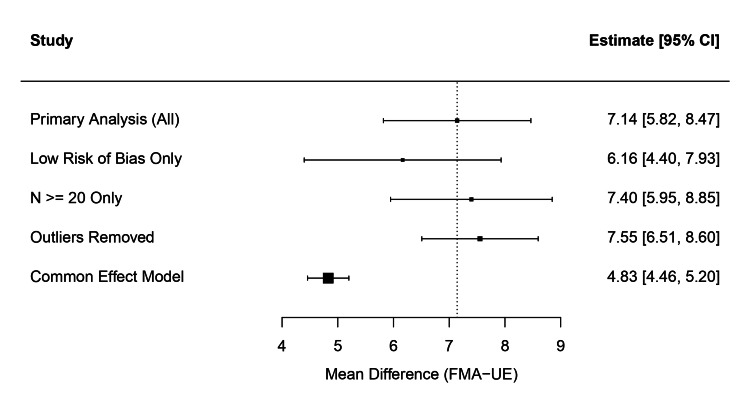 Figure 10
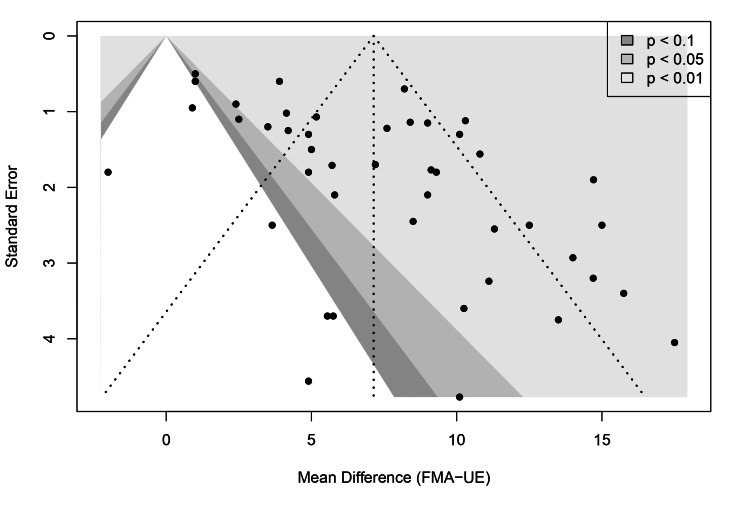 Figure 11
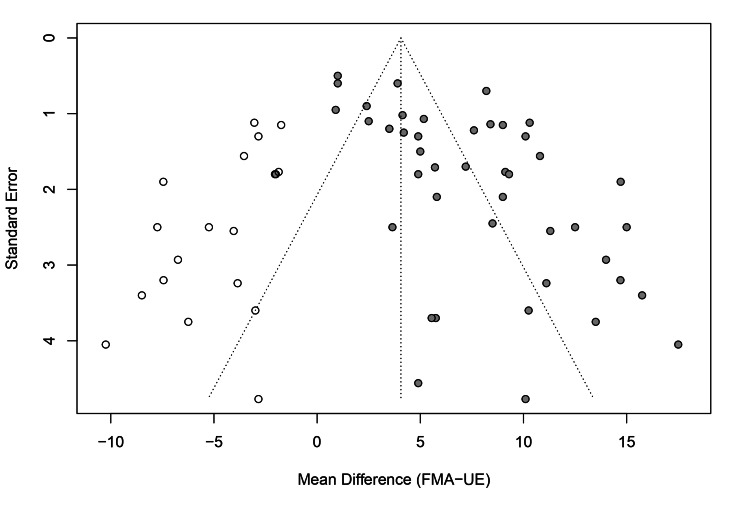 Figure 12
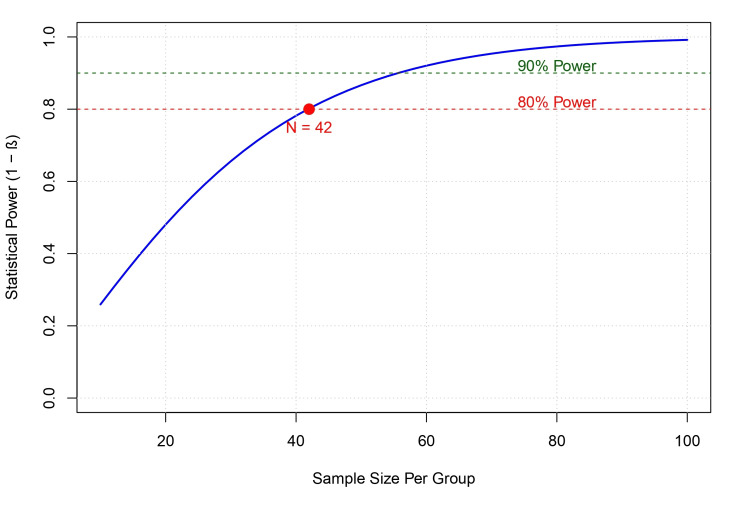 Figure 13
| Study | Design | Participants | Treatment details | Evaluation | ||||||||
| Total N | Exp | Ctl | Age | Onset | Intervention | Rehab | Comparison | Outcome | Results | PEDro | ||
| Alisar et al. [ | RCT double-blind | 32 | 16 | 16 | 63.5 | Mixed | Bihemispheric tDCS | Conventional PT and OT | Sham tDCS | FMA-UE, FIM | Exp > Ctl | 8 |
| Allman et al. [ | RCT double-blind | 24 | 11 | 13 | 63.1 | Chronic | Anodal tDCS | GRASP (Motor Training) | Sham tDCS | UEFM, ARAT, WMFT | Exp > Ctl (ARAT/WMFT) | 9 |
| Ang et al. [ | RCT double-blind | 19 | 10 | 9 | 54.2 | Chronic | Anodal tDCS | MI-BCI + Robot | Sham tDCS | FMA-UE | No sig diff | 8 |
| Beaulieu et al. [ | Pilot RCT double-blind | 14 | 7 | 7 | 68.9 | Chronic | Bihemispheric tDCS | Resistance Training | Sham tDCS | FMA, BBT | No sig diff | 8 |
| Bernal-Jiménez [ | RCT double-blind | 20 | 10 | 9 | 60.0 | Chronic | Bihemispheric tDCS | Hand Robot (AMADEO) | Sham tDCS | FMA-UE, ARAT | No sig diff (FMA) | 9 |
| Bornheim et al. [ | RCT triple-blind | 50 | 25 | 25 | 63.0 | Acute | Anodal tDCS | Standard PT/OT | Sham tDCS | WMFT, FMA-UE | Exp > Ctl | 10 |
| Chen et al. [ | RCT single-blind | 31 | 16 | 15 | 58.8 | Chronic | Cathodal tDCS | Robot (ReoGo) | Sham tDCS | UEFM | Exp > Ctl | 7 |
| Cho & Cha [ | RCT single-blind | 27 | 14 | 13 | 58.0 | Chronic | Anodal tDCS | Mirror Therapy | tDCS + No Mirror | FMA, BBT | Exp > Ctl | 6 |
| Dehem et al. [ | Crossover RCT double-blind | 21 | 21 | 21 | 60.5 | Chronic | Bihemispheric tDCS | Robot (REAplan) | Sham tDCS | Kinematics, BBT | No sig diff | 8 |
| Figlewski et al. [ | RCT double-blind | 44 | 22 | 22 | 60.5 | Chronic | Anodal tDCS | CIMT | Sham tDCS | WMFT | Exp > Ctl | 9 |
| Gao et al. [ | RCT double-blind | 45 | 22 | 23 | 59.0 | Subacute | Bihemispheric tDCS | Occupational Therapy | Sham tDCS | FMA-UE, ARAT | Exp > Ctl | 8 |
| Garrido et al. [ | RCT double-blind | 70 | 35 | 35 | 65.0 | Acute | Bihemispheric tDCS | Modified CIMT | Sham tDCS | FMA-UE, WMFT | Exp > Ctl | 9 |
| Guo et al. [ | RCT single-blind | 40 | 20 | 20 | 61.7 | Subacute | Anodal tDCS | VR + Robot | Sham tDCS | FMA-UL, ARAT | Exp > Ctl | 7 |
| Hesse et al. [ | RCT double-blind | 96 | 64 | 32 | 64.0 | Subacute | Anodal or Cathodal | Robot (Bi-Manu-Track) | Sham tDCS | FMA-UE | No sig diff | 8 |
| Hsu et al. [ | RCT double-blind | 27 | 13 | 14 | 59.1 | Subacute | Bihemispheric tDCS | Task-Oriented Training | Sham tDCS | FMA-UE, ARAT | Exp > Ctl | 9 |
| Kashoo et al. [ | RCT single-blind | 64 | 32 | 32 | 59.3 | Chronic | Anodal tDCS | MI + Functional Training | Sham tDCS | FMA, ARAT | Exp > Ctl | 7 |
| Kim et al. [ | RCT double-blind | 18 | 11 | 7 | 54.4 | Subacute | Anodal or Cathodal | Occupational Therapy | Sham tDCS | FMA, MBI | Exp > Ctl (Cathodal) | 8 |
| Koh et al. [ | RCT double-blind | 25 | 14 | 11 | 56.1 | Chronic | Bihemispheric tDCS | Sensory Modulation | Sham tDCS | FMA-UE | No sig diff | 8 |
| Lee & Lee [ | RCT double-blind | 24 | 12 | 12 | 60.0 | Chronic | Anodal tDCS | Physical Therapy | PT Alone | FMA | Exp > Ctl | 6 |
| Lee & Chun [ | RCT double-blind | 59 | 20 | 20 | 61.5 | Subacute | Cathodal tDCS | Virtual Reality | VR Alone | FMA, MFT | Exp > Ctl | 8 |
| Li et al. [ | RCT double-blind | 52 | 26 | 26 | 57.5 | Subacute | Bihemispheric tDCS | Sensorimotor Training | Sham tDCS | FMA-UE, ARAT | Exp > Ctl | 9 |
| Liao et al. [ | Pilot RCT double-blind | 28 | 20 | 8 | 58.0 | Chronic | Anodal tDCS | Mirror Therapy | Sham tDCS | FMA, Kinematics | Exp > Ctl (Sequential) | 7 |
| Liao et al. [ | RCT double-blind | 36 | 24 | 12 | 59.0 | Chronic | Anodal tDCS | Mirror Therapy | Sham tDCS | FMA-UE | Exp > Ctl | 8 |
| Lindenberg et al. [ | RCT double-blind | 20 | 10 | 10 | 58.7 | Chronic | Bihemispheric tDCS | PT / OT | Sham tDCS | FMA-UE, WMFT | Exp > Ctl | 9 |
| Lindenberg et al. [ | RCT double-blind | 10 | 10 | - | 50.3 | Chronic | Bihemispheric tDCS | PT / OT | First vs Second week | FMA-UE | Cumulative effect | 7 |
| Mazzoleni et al. [ | RCT double-blind | 24 | 12 | 12 | 72.6 | Subacute | Anodal tDCS | Wrist Robot | Sham tDCS | FMA, MAS | No sig diff | 7 |
| Menezes et al. [ | Crossover RCT double-blind | 20 | 20 | 20 | 56.6 | Chronic | Anodal tDCS | FES Training | Sham tDCS | ROM, Grip | No sig diff | 8 |
| Morone et al. [ | RCT double-blind | 66 | 33 | 33 | 60.0 | Chronic | Bihemispheric tDCS | Robot (Exoskeleton) | Sham tDCS | FMA-UE | No sig diff | 9 |
| Mortensen et al. [ | RCT double-blind | 15 | 8 | 7 | 63.0 | Chronic | Anodal tDCS | Home-based OT | Sham tDCS | JTT, Grip | Exp > Ctl (Grip) | 8 |
| Nair et al. [ | RCT double-blind | 14 | 7 | 7 | 58.5 | Chronic | Cathodal tDCS | Occupational Therapy | Sham tDCS | FMA-UE | Exp > Ctl | 8 |
| Palimeris et al. [ | RCT double-blind | 90 | 48 | 42 | 65.0 | Chronic | Anodal tDCS | Strength Training | Sham tDCS | FMA, BBT | No sig diff | 9 |
| Pires et al. [ | RCT double-blind | 57 | 40 | 17 | 58.0 | Chronic | Anodal or Cathodal | Physiotherapy | Sham tDCS | FMA-UE | Exp > Ctl | 9 |
| Rabadi & Aston [ | Pilot RCT double-blind | 16 | 8 | 8 | 62.5 | Acute | Cathodal tDCS | Conventional OT | Sham tDCS | ARAT | Exp > Ctl (Effect Size) | 8 |
| Rocha et al. [ | RCT double-blind | 21 | 14 | 7 | 58.0 | Chronic | Anodal or Cathodal | mCIMT | Sham tDCS | FMA, MAL | Exp > Ctl (Anodal) | 9 |
| Salazar et al. [ | RCT double-blind | 30 | 15 | 15 | 58.0 | Chronic | Bihemispheric tDCS | FES + Task Training | Sham tDCS | FMA, Kinematics | Exp > Ctl (Kinematics) | 9 |
| Sattler et al. [ | RCT double-blind | 20 | 10 | 10 | 65.1 | Acute | Anodal tDCS | Radial Nerve Stim. | Sham tDCS | JHFT | Exp > Ctl | 9 |
| Schlaug et al. [ | RCT triple-blind | 129 | 86 | 43 | 68.0 | Subacute | Bihemispheric tDCS | mCIMT | Sham tDCS | UEFM | No sig diff | 10 |
| Shaheiwola et al. [ | RCT double-blind | 30 | 15 | 15 | 50.6 | Chronic | Bihemispheric tDCS | FES Therapy | Sham tDCS | cFMA, WMFT | Exp > Ctl | 8 |
| Straudi et al. [ | RCT double-blind | 23 | 12 | 11 | 58.5 | Mixed | Bihemispheric tDCS | Robot (ReoGo) | Sham tDCS | FMA-UE | No sig diff | 7 |
| The NETS Trial [ | Phase 2 RCT double-blind | 123 | 58 | 61 | 67.5 | Subacute | Anodal tDCS | Standard Rehab | Sham tDCS | UEFM | No sig diff | 10 |
| Triccas et al. [ | Pilot RCT double-blind | 22 | 12 | 10 | 63.0 | Mixed | Anodal tDCS | Robot (Armeo) | Sham tDCS | FMA | No sig diff | 8 |
| Viana et al. [ | Pilot RCT double-blind | 20 | 10 | 10 | 55.5 | Chronic | Anodal tDCS | Virtual Reality (Wii) | Sham tDCS | FMA, WMFT | No sig diff | 8 |
| Wu et al. [ | RCT double-blind | 45 | 30 | 15 | 46.0 | Subacute | Anodal or Cathodal | Conventional PT | Sham tDCS | FMA, MAS | Exp > Ctl (Cathodal) | 8 |
| Yao et al. [ | RCT single-blind | 40 | 20 | 20 | 64.6 | Mixed | Cathodal tDCS | Virtual Reality | Sham tDCS | FMA-UE, ARAT | Exp > Ctl | 7 |
| Zhang et al. [ | Crossover RCT double-blind | 20 | 20 | 20 | 61.0 | Chronic | Bihemispheric tDCS | Muscle-Computer Interface | Sham tDCS | FMA-UE | Exp > Ctl | 9 |
| Study | Montage | Target site (active electrode) | Current intensity | Duration | Electrode size (area) | Current density | Reference electrode |
| Alisar et al. [ | Bihemispheric | Anode: Ipsilesional C3/C4 Cathode: Contralesional C3/C4 | 2 mA | 30 min | 22 cm² | 0.09 mA/cm² | Dual-channel stimulator used |
| Allman et al. [ | Anodal | Ipsilesional M1 (C3/C4) | 1 mA | 20 min | 35 cm² | 0.029 mA/cm² | Contralateral supraorbital region |
| Ang et al. [ | Anodal | Ipsilesional M1 (C3/C4) | 1 mA | 20 min | NR | NR | Contralesional M1 (Cathode placed here in study text, implying Bihemispheric montage despite title saying Anodal) |
| Beaulieu et al. [ | Bihemispheric | Anode: Ipsilesional M1 Cathode: Contralesional M1 | 2 mA | 20 min | 35 cm² | 0.057 mA/cm² | Symmetric over M1s |
| Bernal-Jiménez [ | Bihemispheric | Anode: Ipsilesional M1 Cathode: Contralesional M1 | 2 mA | 20 min | 35 cm² | 0.057 mA/cm² | Symmetric over M1s |
| Bornheim et al. [ | Anodal | Ipsilesional M1 (C3/C4) | 2 mA | 20 min | 25 cm² | 0.08 mA/cm² | Contralesional supraorbital region |
| Chen et al. [ | Cathodal | Contralesional M1 (C3/C4) | 1.75 mA | 20 min | 35 cm² | 0.05 mA/cm² | Ipsilesional supraorbital region |
| Cho & Cha [ | Anodal | Ipsilesional M1 (C3/C4) | 1-2 mA* | 20 min | NR | NR | Contralesional supraorbital region |
| Dehem et al. [ | Bihemispheric | Anode: Ipsilesional M1 Cathode: Contralesional M1 | 1 mA | 20 min | 35 cm² | 0.029 mA/cm² | Symmetric over M1s |
| Figlewski et al. [ | Anodal | Ipsilesional M1 | 1.5 mA | 30 min | 35 cm² | 0.043 mA/cm² | Contralateral supraorbital region |
| Gao et al. [ | Bihemispheric | Anode: Ipsilesional M1 Cathode: Contralesional M1 | 2 mA | 20 min | 25 cm² | 0.08 mA/cm² | Symmetric over M1s |
| Garrido et al. [ | Bihemispheric | Anode: Ipsilesional M1 (C3/C4) Cathode: Contralesional M1 | 2 mA | 20 min | 25 cm² | 0.08 mA/cm² | Symmetric over M1s |
| Guo et al. [ | Anodal | Ipsilesional M1 (C3/C4) | 2 mA | 20 min | 35 cm² | 0.057 mA/cm² | Contralesional supraorbital margin |
| Hesse et al. [ | Anodal OR Cathodal | Grp A (Anodal): Ipsilesional Hand Area Grp B (Cathodal): Contralesional Hand Area | 2 mA | 20 min | 35 cm² | 0.057 mA/cm² | Contralateral orbit |
| Hsu et al. [ | Bihemispheric | Anode: Ipsilesional M1 (C3/C4) Cathode: Contralesional M1 | 2 mA | 20 min | 25 cm² | 0.08 mA/cm² | Symmetric over M1s |
| Kashoo et al. [ | Anodal | Ipsilesional M1 (Hotspot) | 1.5 mA | 30 min | 25 cm² | 0.06 mA/cm² | Contralesional supraorbital region |
| Kim et al. [ | Anodal OR Cathodal | Anodal: Ipsilesional M1 Cathodal: Contralesional M1 | 1.2 mA | 20 min | 24.75 cm² (4.5x5.5) | ~0.048 mA/cm² | Contralateral supraorbital region |
| Koh et al. [ | Bihemispheric | Anode: Ipsilesional M1 (C3/C4) Cathode: Contralesional M1 | 1.5 mA | 30 min | 25 cm² | 0.06 mA/cm² | Symmetric over M1s |
| Lee & Lee [ | Anodal | Ipsilesional M1 | 1 mA | 20 min | 25 cm² | 0.04 mA/cm² | Contralateral supraorbital region |
| Lee & Chun [ | Cathodal | Contralesional M1 (Hand Area) | 2 mA | 20 min | 25 cm² | 0.08 mA/cm² | Contralateral orbit |
| Li et al. [ | Bihemispheric | Anode: Ipsilesional PSC Cathode: Contralesional PSC | 2 mA | 20 min | 25 cm² | 0.08 mA/cm² | Symmetric over Primary Somatosensory Cortex |
| Liao et al. [ | Anodal | Ipsilesional M1 | 2 mA | 20 min | 35 cm² | 0.057 mA/cm² | Contralesional supraorbital cortex |
| Liao et al. [ | Anodal | Grp 1: Ipsilesional PMC (F3/F4) Grp 2: Ipsilesional M1 (C3/C4) | 2 mA | 20 min | 3.14 cm² (Focal) | 0.06 A/m²** | Contralesional supraorbital cortex |
| Lindenberg et al. [ | Bihemispheric | Anode: Ipsilesional M1 Cathode: Contralesional M1 | 1.5 mA | 30 min | 16.3 cm² (Active Area) | ~0.09 mA/cm² | Symmetric over M1s |
| Lindenberg et al. [ | Bihemispheric | Anode: Ipsilesional M1 Cathode: Contralesional M1 | 1.5 mA | 30 min | 16.3 cm² | ~0.09 mA/cm² | Symmetric over M1s |
| Mazzoleni et al. [ | Anodal | Ipsilesional Hand Area | 2 mA | 20 min | 35 cm² | 0.057 mA/cm² | Contralateral orbit |
| Menezes et al. [ | Anodal | Ipsilesional M1 (C3) | 1 mA | 30 min | 35 cm² | 0.029 mA/cm² | Contralateral supraorbital area |
| Morone et al. [ | Bihemispheric | Anode: Ipsilesional M1 (C3/C4) Cathode: Contralesional M1 | 2 mA | 20 min | 35 cm² | 0.057 mA/cm² | Symmetric over M1s |
| Mortensen et al. [ | Anodal | Ipsilesional M1 (C3/C4) | 1.5 mA | 20 min | 35 cm² | 0.043 mA/cm² | Contralesional supraorbital region |
| Nair et al. [ | Cathodal | Contralesional M1 (C3/C4) | 1 mA | 30 min | NR | NR | Contralateral supraorbital region |
| Palimeris et al. [ | Anodal | Ipsilesional M1 (Hand Area, C3/C4) | 1 mA | 20 min | 35 cm² | 0.03 mA/cm² | Contralateral supraorbital region |
| Pires et al. [ | Anodal | Ipsilesional M1 (Hotspot) | 2 mA | 20 min | 35 cm² | 0.057 mA/cm² | Contralateral supraorbital region |
| Rabadi & Aston [ | Anodal OR Cathodal | Anodal: Ipsilesional M1 Cathodal: Contralesional M1 | 2 mA | 20 min | 35 cm² | 0.057 mA/cm² | Contralateral supraorbital area (for Anodal); Ipsilateral supraorbital (for Cathodal) |
| Rocha et al. [ | Cathodal | Contralesional M1 (C3/C4) | 1 mA | 30 min | 35 cm² | 0.029 mA/cm² | Contralateral supraorbital area |
| Salazar et al. [ | Anodal OR Cathodal | Anodal: Ipsilesional M1 Cathodal: Contralesional M1 | 1 mA | 13 min (Anodal) 9 min (Cathodal) | 35 cm² | 0.029 mA/cm² | Contralateral supraorbital region |
| Sattler et al. [ | Bihemispheric | Anode: Ipsilesional M1 (C3/C4) Cathode: Contralesional M1 | 2 mA | 30 min | 25 cm² | 0.08 mA/cm² | Symmetric over M1s |
| Schlaug et al. [ | Anodal | Ipsilesional M1 (ECR Hotspot) | 1.2 mA | 13 min | 35 cm² | 0.034 mA/cm² | Contralesional supraorbital region |
| Shaheiwola et al. [ | Bihemispheric | Anode: Ipsilesional M1 Cathode: Contralesional M1 | Grp A: 2 mA Grp B: 4 mA | 20 min | NR | NR | Symmetric over M1s |
| Straudi et al. [ | Bihemispheric | Anode: Ipsilesional M1 Cathode: Contralesional M1 | 2 mA | 20 min | 25 cm² | 0.08 mA/cm² | Symmetric over M1s |
| The NETS Trial [ | Bihemispheric | Anode: Ipsilesional M1 (C3/C4) Cathode: Contralesional M1 | 1 mA | 30 min | 35 cm² | 0.029 mA/cm² | Symmetric over M1s |
| Triccas et al. [ | Anodal | Ipsilesional M1 (C3/C4) | 1 mA | 20 min | 35 cm² | 0.029 mA/cm² | Contralateral supraorbital region |
| Viana et al. [ | Anodal | Ipsilesional M1 (C3/C4) | 2 mA | 13 min | 35 cm² | 0.057 mA/cm² | Contralateral orbit |
| Wu et al. [ | Anodal OR Cathodal | Anodal: Ipsilesional S1M1 Cathodal: Contralesional S1M1 | 1.2 mA | 20 min | 24.75 cm² (4.5x5.5) | ~0.048 mA/cm² | Unaffected shoulder (for Anodal); Ipsilateral shoulder (implied/standard for Cathodal) |
| Yao et al. [ | Cathodal | Contralesional M1 | 2 mA | 20 min | 35 cm² | 0.057 mA/cm² | Contralateral supraorbital region |
| Zhang et al. [ | Bihemispheric | Anode: Ipsilesional M1 Cathode: Contralesional M1 | 2 mA | 30 min | 35 cm² | 0.057 mA/cm² | Symmetric over M1s |
| Subgroup | No. of studies (k) | Pooled mean difference (95% CI) | I2 (%) | p-value (Interaction) |
| Stroke chronicity | < 0.001 | |||
| Acute (<1 month) | 3 | 7.75 (-6.20 to 21.70) | 87.7% | |
| Subacute (1–6 months) | 11 | 11.72 (9.88 to 13.56) | 48.6% | |
| Chronic (>6 months) | 25 | 4.89 (3.45 to 6.32) | 86.4% | |
| Mixed | 4 | 8.45 (4.42 to 12.48) | 48.7% | |
| Stimulation type | 0.20 | |||
| Anodal | 17 | 6.38 (4.07 to 8.70) | 88.9% | |
| Cathodal | 5 | 7.57 (3.70 to 11.44) | 84.3% | |
| Bihemispheric (dual) | 17 | 6.75 (4.35 to 9.14) | 88.1% | |
| Mixed protocols | 5 | 10.83 (5.75 to 15.91) | 67.3% | |
| Outcome | No. of participants (studies) | Absolute effect (95% CI) | Relative effect (95% CI) | Certainty of evidence (GRADE) | Comments |
| Upper extremity motor impairment (FMA-UE) | 1,568 (44 RCTs) | MD 7.11 (5.76 to 8.46) | — | ⨁⨁⨁◯ MODERATE | Downgraded once for risk of bias (single blinding in some trials). Effect exceeds MCID. |
| Functional activity (ARAT, WMFT, BBT) | 771 (17 RCTs) | SMD 0.62 (0.48 to 0.76) | — | ⨁⨁⨁◯ MODERATE | Downgraded once for risk of bias. Represents a medium-to-large clinical effect. |
| Adverse events / safety | 590 (10 RCTs) | — | RR 0.96 (0.59 to 1.58) | ⨁⨁⨁◯ MODERATE | Downgraded once for imprecision (wide CI crossing unity). No significant difference between active and sham. |
Peer Reviews
No public reviews on file for this paper yet. If you reviewed it on a platform where reviews are public (OpenReview, ICLR, NeurIPS, ICML), you can paste yours below so the community can read it here.
Videos
No videos yet. Explain this paper in a talk, walkthrough, or lecture? Add one.
Taxonomy
TopicsTranscranial Magnetic Stimulation Studies · Stroke Rehabilitation and Recovery · Pain Management and Treatment
Introduction and background
Stroke is a leading cause of enduring adult disability, with upper extremity dysfunction emerging as one of its most persistent and challenging consequences [1,2]. Many survivors contend with lasting hemiparesis, reduced manual dexterity, and compromised motor control, all of which limit functional independence and lower quality of life. Although standard neurorehabilitation approaches, such as task-specific training and constraint-induced movement therapy (CIMT), form the foundation of recovery, therapeutic results are frequently partial, leaving many individuals with significant residual deficits [1]. There is a critical demand for adjunctive therapies capable of enhancing neuroplasticity to improve the effectiveness of conventional physical rehabilitation.
Post-stroke motor deficits are often explained by the interhemispheric competition model. After a unilateral cerebrovascular event, the primary motor cortex (M1) on the affected side demonstrates lower excitability, whereas the unaffected M1 exerts excessive transcallosal inhibitory signals on the damaged hemisphere, stifling motor output [1,2]. Transcranial direct current stimulation (tDCS) is a valuable noninvasive brain stimulation (NIBS) tool for rebalancing cortical excitability. By applying weak electrical currents via the scalp, tDCS creates polarity-specific changes in neuronal resting membrane potentials; specifically, anodal stimulation enhances depolarisation and excitability, whereas cathodal stimulation promotes hyperpolarisation and inhibition [3,4].
In addition to temporary membrane polarization, tDCS supports synaptic plasticity via pathways analogous to long-term potentiation (LTP) and long-term depression (LTD), driven by glutamatergic transmission and the modulation of brain-derived neurotrophic factor (BDNF) [2,3]. Current biophysical theories propose that tDCS efficacy is state-dependent; rather than generating action potentials, the technique modulates the firing rates of neurons that are already active. This principle of functional targeting suggests that tDCS benefits are optimized when paired with neuronal activation from behavioral tasks [3,5]. Combining tDCS with active physical therapy may generate a synergistic effect, priming the motor cortex to respond effectively to motor learning [2].
Despite this strong physiological rationale, clinical evidence regarding the efficacy of tDCS in stroke recovery remains inconsistent. While some meta-analyses suggest moderate improvements in motor function, individual randomized controlled trials (RCTs) often report conflicting results regarding the optimal montage (e.g., bihemispheric vs. unilateral), timing (online vs. offline), and specific impact on functional activities versus impairment scales [1,5]. Furthermore, the translation of neurophysiological gains into meaningful improvements in Activities of Daily Living (ADLs), often assessed with patient-reported outcome measures such as the Motor Activity Log [6], remains a subject of ongoing investigation.
This systematic review and meta-analysis aimed to synthesize high-quality RCTs to determine the efficacy and safety of tDCS as an adjunct to upper limb rehabilitation in stroke patients. Specifically, this review evaluated the cumulative effect of combined tDCS and rehabilitation on reducing motor impairment, restoring functional limb capacity, and improving patient-perceived performance in ADLs. By analysing data across different stroke stages and stimulation protocols, this study seeks to clarify the clinical utility of tDCS and inform evidence-based guidelines for neurorehabilitation.
Review
Methods
Protocol and Registration
This study adheres to the guidelines established by the Preferred Reporting Items for Systematic Reviews and Meta-Analyses (PRISMA) statement [7]. The review protocol was defined a priori and registered with the International Prospective Register of Systematic Reviews (PROSPERO) under the identification number CRD420251181685 [8].
Search Strategy
An exhaustive search of the literature was performed from inception up to the current date, restricting results to English-language publications. PubMed, MEDLINE, Embase (via Ovid), PsycInfo, Scopus, Web of Science, CINAHL, and the Cochrane Central Register of Controlled Trials (CENTRAL) were queried. The search strategy incorporated Medical Subject Headings (MeSH) and free-text terms relevant to “stroke”, “upper extremity”, and “transcranial direct current stimulation”. Boolean operators were used to combine search terms: "OR" was used to combine synonyms within a concept (e.g., Stroke OR Cerebrovascular Accident), and "AND" was used to link the three primary concepts (Population AND Intervention AND Region). The reference lists of included trials and prior systematic reviews were manually screened("snowballing") and checked clinical trial registries for unpublished data to maximize retrieval.
Eligibility Criteria
Selection was based on the PICOS framework [9]. RCTs were included, involving adult stroke survivors (aged ≥18 years) in any recovery phase (acute, subacute, or chronic). Eligible interventions used active tDCS (anodal, cathodal, or bihemispheric) administered concurrently or sequentially with upper limb rehabilitation (e.g., physical therapy, occupational therapy, robotics, or CIMT). Control groups must have received sham (placebo) stimulation alongside identical rehabilitation. The primary endpoint was upper extremity motor impairment, quantified by the Fugl-Meyer Assessment for upper extremity (FMA-UE) [10]. Secondary endpoints included functional scales such as the Action Research Arm Test (ARAT) [11], Wolf Motor Function Test (WMFT) [12], and Box and Block Test (BBT) [13], as well as safety metrics including dropout rates and adverse events.
Data Extraction and Management
Two independent reviewers extracted data using a standardised form. The extracted data fields included study characteristics such as author, year, sample size (N), and stroke chronicity (acute/subacute vs. chronic). The tDCS parameters were also recorded, including the electrode montage (target site), current intensity (mA), duration per session (minutes), electrode size (cm²), current density (mA/cm²), and total treatment duration (min).
The extracted outcome data included sample sizes, means, and standard deviations (SD) for post-intervention and follow-up time points. The number of adverse events and dropouts was recorded for safety. To avoid unit-of-analysis errors in studies with multiple active intervention groups sharing a single control group, data from active arms (for example, Anodal and Cathodal) were pooled into a single "Active tDCS" group before comparison with the Sham group, following the recommendations from the Cochrane Handbook for Systematic Reviews of Interventions [9].
Risk-of-Bias Assessment
The methodological quality was assessed using the Cochrane Risk of Bias 2 (RoB 2) tool [14]. Five domains were evaluated: bias arising from the randomization process, bias due to deviations from the intended interventions, bias due to missing outcome data, bias in the measurement of the outcome, and bias in the selection of reported results. Regarding the handling of missing participant data, values were extracted based on Intention-to-Treat (ITT) principles, as reported by the original authors; otherwise, available case analysis was performed based on the reported means and standard deviations of completers. Studies were classified as "low risk”, "some concerns”, or "high risk”. Specific attention was paid to blinding efficacy in the tDCS trials and the protocol preregistration.
Data Synthesis and Statistical Analysis
All statistical analyses were performed using R statistical software (version 4.5.1, R Foundation for Statistical Computing, Vienna, Austria, https://www.R-project.org/) with the meta and dmetar packages [15]. For continuous outcomes, the mean difference (MD) was calculated for the primary outcome (FMA-UE) as the scale was uniform across studies. For secondary outcomes, combining different scales (e.g., pooling ARAT and WMFT for "Activity"), standardized mean differences (SMDs), specifically Hedges’ g, were used to correct for small sample sizes [16]. For dichotomous outcomes, such as safety data (adverse events/dropouts), the risk ratio (RR) was calculated.
Due to the anticipated clinical heterogeneity in stroke populations (chronicity, lesion location) and tDCS protocols (montage, dosage), a random-effects model was employed [16]. The between-study variance (τ2) was estimated using the restricted maximum likelihood (REML) method, and the Knapp-Hartung adjustment was applied to calculate the confidence intervals. Statistical heterogeneity was quantified using the I2 statistic, interpreted as 0-40% might not be important, 30-60% moderate, 50-90% substantial, and 75-100% considerable, and the chi-squared test (Q) [9,17]. Prediction intervals (95% PI) were calculated to estimate the range in which the true effect of a future study is expected to fall [16].
Moderator Analyses and Meta-Regression
Subgroup analyses and meta-regression were conducted to investigate the sources of heterogeneity. Studies were stratified by stroke chronicity (acute/subacute vs. chronic) and stimulation type (anodal vs. cathodal vs. bihemispheric). Univariable meta-regression was performed to assess the relationship between the effect size and continuous covariates, specifically current density (mA/cm²) and total treatment duration (minutes) [16].
Assessment of Bias and Robustness
Reporting biases were visually assessed using contour-enhanced funnel plots [18]. Statistical asymmetry was tested using Egger’s linear regression test [19,20] and Begg’s rank correlation test for outcomes with k ≥ 10 studies. The trim and fill method was applied as a sensitivity analysis to impute potentially missing small negative studies and adjust the pooled effect estimate [21]. The robustness of the primary findings was further tested through several analyses. A leave-one-out analysis was conducted by iteratively removing single studies to detect influential outliers. An exclusion by quality analysis was performed by removing studies classified as "high risk" or "some concerns" in the RoB 2 assessment. An exclusion by sample size analysis removed small pilot studies (N < 20) to assess the small-study effects. Statistical outliers were removed by excluding studies with confidence intervals that did not overlap with the pooled effect’s confidence interval. Finally, a model comparison was conducted between the random-effects and common-effects (fixed) models.
Certainty of Evidence
The overall certainty of the evidence was evaluated using the Grading of Recommendations Assessment, Development, and Evaluation (GRADE) framework. Evidence was graded as high, moderate, low, or very low based on the RoB, inconsistency, indirectness, imprecision, and publication bias [9].
Power Analysis and Sample Size Estimation
A post-hoc power analysis was conducted to determine the statistical power of the meta-analysis. Furthermore, an optimal sample size for a future definitive RCT was calculated based on the pooled effect size derived from the primary analysis, assuming α = 0.05 and power (1 - β) = 0.80 [22].
Results
Study Selection
The initial literature search yielded 518 records from the electronic databases. After removing 216 duplicates, 302 unique citations remained for the title and abstract screenings. Of these, 164 were excluded because they did not meet the inclusion criteria (e.g., non-randomized designs, review articles, or irrelevant interventions). A total of 138 articles were sought for full-text retrieval, of which 56 were not retrieved due to unavailability. The remaining 82 full-text articles were assessed for their eligibility. Thirty-seven studies were excluded for the following reasons: insufficient data for meta-analysis (n = 26), lack of a control group or inappropriate comparator (n = 9), and irrelevant outcomes or short admission periods (n = 2). Forty-five RCTs met the inclusion criteria and were included in the quantitative synthesis (meta-analysis) [23-67]. The study selection process is illustrated in Figure 1.
Preferred Reporting Items for Systematic Reviews and Meta-Analyses (PRISMA) flow diagram of the study selection process
Study Characteristics
The 45 included RCTs comprised a total of 1,568 participants. The mean age ranged from 46 to 75 years across studies. Stroke chronicity varied, with studies including participants in the acute (<1 month), subacute (1-6 months), and chronic (>6 months) phases of recovery. Interventions involved various montages of tDCS, including anodal stimulation of the ipsilesional hemisphere [24,25,28,30,32,35,38,39,41,43-45,47,48,50,51,53,56,57,59,62-64], cathodal stimulation of the contralesional hemisphere [29,41,42,46,52,54,55,65,66], and bihemispheric (dual) stimulation [23,26,27,31,33,34,36,37,40,46,47,49,56,57,59-61,67]. Concurrent rehabilitation therapies included physical therapy, occupational therapy, CIMT, robot-assisted therapy, and virtual reality training. The detailed characteristics of the included studies are summarized in Table 1.
RoB Assessment
The methodological quality of the 45 included RCTs was evaluated using the RoB 2 tool [14]. The assessment revealed that most studies (60%, n = 27) were classified as having a "low" overall RoB, demonstrating adherence to rigorous randomization, allocation concealment, and blinding. Notable examples of high-quality trials include the TRANSPORT2 [59] and NETS [62] studies, both of which employed triple blinding and robust intention-to-treat analyses.
However, 40% (n = 18) of the studies were rated as raising "some concerns." These concerns stemmed from the randomization process (Domain 1) and deviations from the intended interventions (Domain 2), often due to single-blind designs in which the therapist administering the rehabilitation was aware of the stimulation condition, as in Yao et al. [66]. Additionally, issues with the selection of reported results (Domain 5) were identified in several studies due to retrospective trial registration or lack of a pre-published analysis plan, such as Kim et al. [39] and Straudi et al. [61]. No studies were classified as "high risk" overall, as all were RCTs with appropriate control groups, although some pilot studies, such as Lee and Lee [41] and Lee and Chun [42], lacked detailed reporting on allocation concealment. A detailed summary of the RoB assessment for each study is provided in Figures 2-3.
Risk-of-bias assessment
Risk-of-bias summary
Primary Outcome: Upper Extremity Motor Impairment
The primary outcome of interest was improvement in upper extremity motor impairment, which was assessed using the FMA-UE. A random-effects meta-analysis was conducted on 44 studies (k = 44) involving 1,568 participants to estimate the pooled MD between active tDCS (anodal, cathodal, or bihemispheric) combined with rehabilitation and sham tDCS combined with rehabilitation.
The analysis revealed a statistically significant improvement in the FMA-UE scores in the active tDCS group compared with the control group. The pooled MD was 7.11 points (95% confidence interval (CI): 5.76-8.46; p < 0.0001). This effect size exceeds the minimal clinically important difference (MCID) for the FMA-UE, which ranges from five to 10 points in chronic stroke populations, suggesting a clinically meaningful benefit for patients with stroke.
Significant heterogeneity was observed across the included studies (I2 = 88.8%, τ2 = 15.24, P < 0.0001). The prediction interval ranged from -0.88 to 15.09, indicating that while the average effect was positive, the efficacy of tDCS may vary in future studies depending on specific clinical and methodological factors. The forest plot depicting the individual study effect sizes and pooled estimates is shown in Figure 4.
Forest plot of the primary outcome (FMA-UE) comparing active tDCS combined with rehabilitation versus sham tDCSThe diamond represents the pooled mean difference (MD) with 95% CI. The red bar indicates the 95% prediction interval.Abbreviations: FMA-UE: Fugl-Meyer Assessment for upper extremity, tDCS: transcranial direct current stimulation
Secondary Outcomes
In addition to motor impairment, the effects of tDCS on functional activity and its safety were evaluated.
Functional activity: Measures of functional activity, including the ARAT, WMFT, and BBT, were synthesized using SMD to account for the variety of scales used. The meta-analysis demonstrated a significant improvement in functional activity in the active tDCS group compared to the sham group, with a pooled SMD of 0.62 (95% CI: 0.48 to 0.76; p < 0.0001). This magnitude of effect corresponds to a medium-to-large effect size according to Cohen's conventions, indicating a substantial therapeutic benefit for daily arm function.
Safety and tolerability: Safety was assessed by comparing the incidence of adverse events (e.g., skin irritation, headache, fatigue) and dropout rates between the active and sham tDCS groups. Data from 10 studies reporting adverse events were included in the analysis. The pooled RR was 0.96 (95% CI: 0.59 to 1.58; p = 0.89), indicating no significant difference in the risk of adverse events between active and sham stimulation. Heterogeneity for this outcome was negligible (I2 = 0%). These results suggest that tDCS is a safe and well-tolerated intervention when applied as an adjunct to rehabilitation. The forest plot for adverse events is shown in Figure 5.
Forest plot comparing the risk of adverse events between active tDCS and sham tDCS groups.The diamond represents the pooled RR with 95% CI.Abbreviations: tDCS: transcranial direct current stimulation, CI: confidence interval
Heterogeneity and Moderator Analyses
Given the substantial heterogeneity observed in the primary outcome (I_2_ = 88.8%), pre-specified subgroup analyses and meta-regression were conducted to identify the potential sources of variation (Figure 6).
Forest plot of heterogeneity.
Subgroup analysis (stroke chronicity): The studies were stratified into three subgroups based on the time post-stroke: acute (<1 month), subacute (one to six months), and chronic (>6 months). The test for subgroup differences revealed a significant interaction (p < 0.001). The largest effect size was observed in the subacute group (MD = 11.72, 95% CI: 9.88 to 13.56), followed by the acute (MD = 7.75, 95% CI: -6.20 to 21.70) and chronic groups (MD = 4.89, 95% CI: 3.45 to 6.32). Although the acute group showed a positive trend, the results should be interpreted as exploratory because of the small number of studies (k = 3) and the wide confidence interval crossing zero (-6.20 to 21.70). All subgroups favoured active tDCS, but the magnitude of the benefit was most pronounced in the subacute phase, suggesting a potential critical window for neuromodulation efficacy.
Subgroup analysis (stimulation type): The efficacy of different electrode montages, i.e., anodal (ipsilesional excitation), cathodal (contralesional inhibition), bihemispheric (dual), and mixed protocols, was compared. No significant difference was observed between the stimulation types (p = 0.20). Anodal stimulation yielded a pooled MD of 6.38 (95% CI: 4.07 to 8.70), bihemispheric stimulation showed an MD of 6.75 (95% CI: 4.35 to 9.14), and cathodal stimulation showed an MD of 7.57 (95% CI: 3.70 to 11.44).
Meta-regression: A univariate meta-regression was performed to assess the impact of continuous moderators. Current density (mA/cm²) was positively associated with the treatment effect (coefficient = 86.86, p = 0.011), indicating that higher current densities may lead to greater functional gains (Figure 7). Total treatment duration (minutes) did not show a significant relationship with the effect size (coefficient = -0.001, p = 0.82), suggesting that simply increasing the duration of stimulation does not necessarily translate to better outcomes (Figure 8).
Bubble plot of meta-regression showing the relationship between current density (mA/cm²) and mean difference in FMA-UE scores. The blue line represents the regression slope.Abbreviation: FMA-UE: Fugl-Meyer Assessment for upper extremity
Bubble plot of meta-regression showing the relationship between total treatment duration (minutes) and mean difference in FMA-UE scores.The red line represents the regression slope.Abbreviation: FMA-UE: Fugl-Meyer Assessment for upper extremity
Sensitivity and Robustness Analyses
To verify the stability of the findings, a series of sensitivity analyses was performed to test the influence of study quality, sample size, and statistical modelling choices.
Influence analysis: A Leave-One-Out analysis was conducted to determine whether any single study disproportionately influenced the pooled effect size. The results showed that the pooled mean difference remained stable, ranging between 6.93 and 7.32 across all iterations, with no single study altering the statistical significance of the primary outcome. This suggests that the overall finding was not driven by a single outlier. The forest plot for the leave-one-out analysis is presented in Figure 9.
Leave-One-Out sensitivity analysis forest plot for FMA-UE.This analysis iteratively excludes one study at a time (indicated by "Omitting [Study]") to assess if any single study disproportionately influenced the overall pooled effect size.Each row represents the pooled effect size calculated when that specific study is omitted from the analysis.Abbreviation: FMA-UE: Fugl-Meyer Assessment for upper extremity
Exclusion by quality and sample size: The meta-analysis was repeated after excluding studies classified as having "some concerns" or "high risk" of bias. The pooled effect size in the "low risk of bias only" subgroup (k = 27) was 6.16 (95% CI: 4.40 to 7.93), which remained statistically significant and consistent with the primary analysis. Similarly, restricting the analysis to studies with a total sample size of N ≥ 20 (k = 38) yielded a pooled MD of 7.40 (95% CI: 5.95 to 8.85), confirming that the results were not an artefact of small-study effects (Figure 10).
Forest plot summarizing the results of sensitivity analyses (low risk of bias, N ≥ 20, outliers removed, common effect model) compared to the primary analysis.
Outlier removal: Eleven studies were identified as statistical outliers based on the CI overlap. After removing these studies, the heterogeneity decreased significantly (I_2_ dropped from 88.8% to 66.6%), whereas the pooled effect size remained robust at 7.55 (95% CI: 6.51 to 8.60).
Model comparison: Comparing the random-effects model (REML) with a common-effect (fixed) model revealed that while the point estimate decreased in the common-effect model (MD = 4.83, 95% CI: 4.46 to 5.20), it remained statistically significant. Given the high heterogeneity, the random-effects model is considered the more appropriate estimate, but the significance holds across both approaches.
Publication Bias and Certainty of Evidence
Publication bias: Publication bias was visually assessed using a contour-enhanced funnel plot (Figure 11). The plot displayed some asymmetry, with a gap in the lower left quadrant, suggesting the potential absence of small, non-significant studies. However, Egger’s linear regression test did not detect significant asymmetry (t = 1.86, p = 0.10), indicating that small study effects were not statistically evident. To further probe the robustness of the results, a trim-and-fill analysis was performed. This method imputed 18 potentially missing studies to symmetrize the funnel plot. The adjusted pooled effect size decreased to 4.06 (95% CI: 2.35 to 5.78) but remained statistically significant (p < 0.0001), suggesting that even if publication bias exists, it does not negate the overall finding of a beneficial effect (Figure 12).
Contour-enhanced funnel plot for the primary outcome (FMA-UE).The shaded regions represent levels of statistical significance.Abbreviation: FMA-UE: Fugl-Meyer Assessment for upper extremity
Funnel plot with trim-and-fill adjustment.Open circles represent observed studies; filled circles represent imputed missing studies.
Certainty of evidence (GRADE): The overall certainty of the evidence was evaluated using the GRADE approach. The evidence for the primary outcome (FMA-UE) was graded as moderate. The certainty was downgraded by one level for RoB due to the presence of some studies with single-blinding and retrospective registration. However, it was not downgraded for Inconsistency, as heterogeneity was explained by stroke chronicity subgroups, nor for imprecision, given the large total sample size (N = 1,568) and narrow confidence intervals (Table 4). Indirectness was not a concern, as all studies directly compared tDCS to sham in the target population. Publication Bias was not serious based on the robustness of the trim-and-fill analysis.
Sample size estimation: Based on the pooled effect size observed for functional activity (SMD = 0.62), a post-hoc power analysis was conducted to guide future research. The analysis indicates that a sample size of 42 participants per group is required to achieve 80% statistical power at an alpha level of 0.05 (Figure 13).
Power analysis for future tDCS trials.The curve illustrates the relationship between sample size per group and statistical power, based on the pooled effect size (d = 0.62) observed for functional activity. The red point indicates that 42 participants per group are necessary to achieve 80% power (1–β = 0.80).Abbreviation: tDCS: transcranial direct current stimulation
Discussion
This systematic review and meta-analysis synthesised data from 45 RCTs involving 1,568 participants to evaluate the efficacy and safety of tDCS combined with rehabilitation for upper extremity motor recovery after a stroke. The results provide robust evidence that active tDCS, whether anodal, cathodal, or bihemispheric, significantly enhances motor impairment recovery compared to sham stimulation, as measured by the FMA-UE. The pooled mean difference of 7.11 points exceeded the MCID of five to 10 points established for this population [10], indicating a tangible clinical benefit. Furthermore, significant improvements were observed in functional activity measures (SMD = 0.62), suggesting that motor gains translate to better performance in daily tasks. Importantly, safety analyses confirmed that tDCS was well tolerated, with no significant increase in adverse events compared to the sham group.
Efficacy and Critical Windows for Recovery
Subgroup analysis revealed that the timing of the intervention played a crucial role in its efficacy. The most pronounced effects were observed in the subacute phase (one to six months post-stroke), with a mean difference of 11.72 points, compared with smaller gains in the chronic phase (4.89 points). This finding aligns with the concept of a "critical window" for neuroplasticity, in which the brain is most responsive to remodelling and synaptic strengthening [68,69]. While chronic patients still benefited, the magnitude of recovery was lower, supporting the recommendation to prioritise neuromodulation interventions earlier in the rehabilitation trajectory [70].
Stimulation Parameters and Dosage
Meta-regression analysis identified current density as a significant moderator of efficacy, with higher current densities associated with greater motor improvement. This supports recent trends in non-invasive brain stimulation research advocating for optimized dosing to overcome inter-individual variability in skull thickness and brain anatomy [71]. Conversely, the total treatment duration (minutes) did not significantly predict outcomes, suggesting that simply extending the duration of stimulation may not yield additional benefits without optimizing other parameters, such as intensity or montage. This finding challenges the "more is better" assumption and highlights the need for dose-finding studies to determine the optimal stimulation duration [72].
Comparison of Montages
The analysis found no significant difference in efficacy between the anodal, cathodal, and bihemispheric montages. This contrasts with some theoretical models suggesting that bihemispheric stimulation might be superior by addressing interhemispheric imbalance (rebalancing transcallosal inhibition) [73]. The lack of superiority for any single montage suggests that the mechanism of action, whether facilitating the ipsilesional cortex or inhibiting the contralesional cortex, may be less critical than the overall modulation of the motor network, or that patient-specific factors (e.g., lesion location, structural reserve) may dictate which montage is most effective for an individual [74,75].
Strengths
This review has several strengths, including a comprehensive search strategy, rigorous RoB assessment using RoB 2, and the use of robust statistical methods (e.g., Hartung-Knapp adjustment, prediction intervals). The inclusion of recent large-scale trials, such as TRANSPORT2 [59] and the NETS trial [62], significantly enhanced the statistical power and precision of the current estimates compared with previous meta-analyses [76,77].
Limitations
This study has some limitations. First, substantial statistical heterogeneity was observed (I_2_ = 88.8%), reflecting the diverse clinical populations and protocols used across the studies. Although subgroup analyses explained some of this variance, considerable unexplained heterogeneity remained. Second, approximately 40% of studies raised "Some Concerns" regarding RoB, due to single-blinding designs or lack of pre-registered protocols. Although sensitivity analyses excluding these studies confirmed the robustness of the primary findings, future trials should adhere to the CONSORT guidelines to minimize bias. Also, while meta-regression indicated an association with current density, this finding needs caution due to the heterogeneous electrode configurations (e.g., varying sponge sizes, shapes, and positions) across included trials, which may differentially influence the effective electric field reaching the cortex. Finally, long-term follow-up data were limited, preventing firm conclusions regarding the durability of the observed effects beyond the immediate post-intervention period.
Implications for Clinical Practice and Future Research
These findings suggest that tDCS can be a beneficial adjunct to upper limb rehabilitation, particularly in the subacute phase of stroke. Clinicians may consider incorporating tDCS into rehabilitation protocols to enhance motor recovery while adhering to safety guidelines [71].
Future research should focus on investigating whether individualizing montages based on lesion location or connectivity (e.g., using DTI or fMRI) improves outcomes (Stinear et al., 2007), conducting dose-response studies to define the optimal current density and duration, and designing trials with extended follow-up periods (six months to one year) to assess the retention of motor gains. Additionally, to ensure robust statistical validity and avoid Type II errors, future definitive trials should aim for a minimum sample size of 42 participants per group, as indicated by our power analysis based on the observed functional effect size of 0.62. Research should utilize neurophysiological measures (e.g., TMS-MEP) to better understand the neural correlates of recovery and identify responders versus non-responders.
Conclusions
This systematic review and meta-analysis provides robust evidence that tDCS is an effective adjunct to rehabilitation for improving upper extremity motor function in stroke survivors. The analysis demonstrated a statistically significant improvement in FMA-UE scores, exceeding the minimal clinically important difference, particularly when the intervention is applied in the subacute phase of recovery. However, because of the substantial statistical heterogeneity observed across the included trials, these results should be interpreted with caution regarding their application to individual cases. The wide prediction intervals indicate that while the average therapeutic effect is positive, clinical outcomes may vary significantly based on patient-specific factors and the precise stimulation parameters employed. Moreover, functional activity showed moderate improvement, but the benefits were most pronounced in motor impairment reduction. The intervention was found to be safe, with no significant increase in adverse events compared to sham stimulation. These findings support the integration of tDCS into stroke rehabilitation protocols, specifically emphasizing early intervention and optimized current densities, while highlighting the need for future research to standardize stimulation parameters.
The reference list from the paper itself. Each links out to its DOI / PubMed record.
- 1Transcranial Direct Current Stimulation in Stroke Rehabilitation: Present and Future Practical guide to transcranial direct current stimulation Awosika OO Cohen LG 509539 Cham Springer International Publishing 2019
- 2t DCS in the Context of Rehabilitation Transcranial direct current stimulation in neuropsychiatric disorders Simis M Morales L Marduy A Fregni F 653663 Cham Springer 2021
- 3Principles of Transcranial Direct Current Stimulation (t DCS): Introduction to the Biophysics of t DCS Practical guide to transcranial direct current stimulation Reato D Salvador R Bikson M Opitz A Dmochowski J Miranda PC 4580 Cham Springer International Publishing 2019
- 4Non-invasive electrical and magnetic stimulation of the brain, spinal cord, roots and peripheral nerves: Basic principles and procedures for routine clinical and research application. An updated report from an I.F.C.N. Committee Clin Neurophysiol Rossini PM Burke D Chen R 1071110712620152579765010.1016/j.clinph.2015.02.001PMC 6350257 · doi ↗ · pubmed ↗
- 5Clinical Research and Methodological Aspects for t DCS Research Transcranial direct current stimulation in neuropsychiatric disorders Woods AJ Martin DM 265279 Cham Springer 2021
- 6The Motor Activity Log-28: assessing daily use of the hemiparetic arm after stroke Neurology Uswatte G Taub E Morris D Light K Thompson PA 118911946720061703075110.1212/01.wnl.0000238164.90657.c 2 · doi ↗ · pubmed ↗
- 7The PRISMA 2020 statement: an updated guideline for reporting systematic reviews BMJ Page MJ Mc Kenzie JE Bossuyt PM 0372202110.1186/s 13643-021-01626-4PMC 800853933781348 · doi ↗ · pubmed ↗
- 8Effect of transcranial direct current stimulation combined with rehabilitation on arm and hand function in stroke patients: a systematic review and meta-analysis PROSPERO Baraah AO Faisal A Bayan HMK 2025 https://www.crd.york.ac.uk/PROSPERO/view/CRD 42025118168510.3390/healthcare 9121705 PMC 870181534946431 · doi ↗ · pubmed ↗