Visualization for Departures from Symmetry with the Power-Divergence-Type Measure in Square Contingency Tables
Wataru Urasaki, Tomoyuki Nakagawa, Jun Tsuchida, Kouji Tahata

TL;DR
This paper introduces a new method for visualizing symmetry departures in square contingency tables using a modified divergence statistic.
Contribution
A novel correspondence analysis approach is proposed that allows for consistent visualization of symmetry departures across different datasets.
Findings
The modified divergence statistic enables visualization of symmetry departures independent of sample size.
The CA plot includes two principal axes with equal contribution rates for consistent comparison.
Confidence regions are added to improve the accuracy of the visualization.
Abstract
When the row and column variables consist of the same category in a two-way contingency table, it is called a square contingency table. Since square contingency tables have an association structure due to the concentration of observed values near the main diagonal, a primary objective is to examine symmetric relationships and transitions between variables. Various models and measures have been proposed to analyze these structures to understand the changes between two variables’ behavior at two-time points or cohorts. This is necessary for a detailed investigation of individual categories and their interrelationships, such as shifts in brand preferences. We propose a novel approach to correspondence analysis (CA) for evaluating departures from symmetry in square contingency tables with nominal categories, using a modified divergence statistic. This approach ensures that well-known…
Genes, proteins, chemicals, diseases, species, mutations and cell lines named across the full text — each resolved to its canonical identifier and authoritative record.
Click any figure to enlarge with its caption.
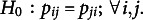 Figure 1
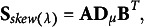 Figure 2
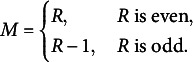 Figure 3
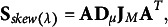 Figure 4
 Figure 5
 Figure 6
 Figure 7
 Figure 8
 Figure 9
 Figure 10
 Figure 11
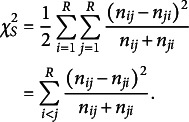 Figure 12
 Figure 13
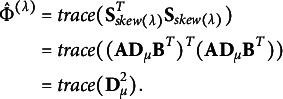 Figure 14
 Figure 15
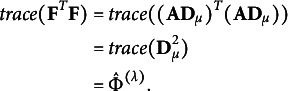 Figure 16
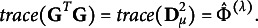 Figure 17
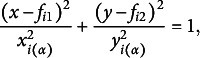 Figure 18
 Figure 19
 Figure 20
 Figure 21
 Figure 22
 Figure 23
 Figure 24
 Figure 25
 Figure 26
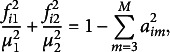 Figure 27
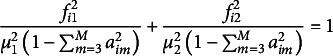 Figure 28
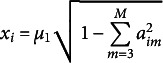 Figure 29
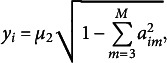 Figure 30
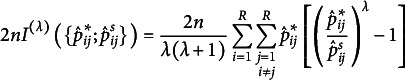 Figure 31
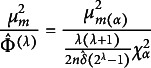 Figure 32
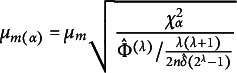 Figure 33
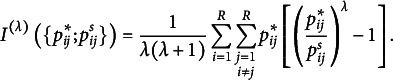 Figure 34
 Figure 35
 Figure 36
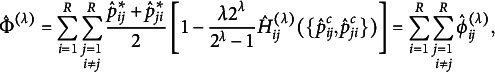 Figure 37
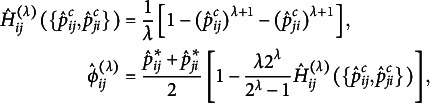 Figure 38
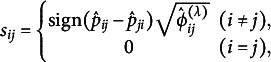 Figure 39
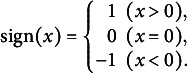 Figure 40
 Figure 41
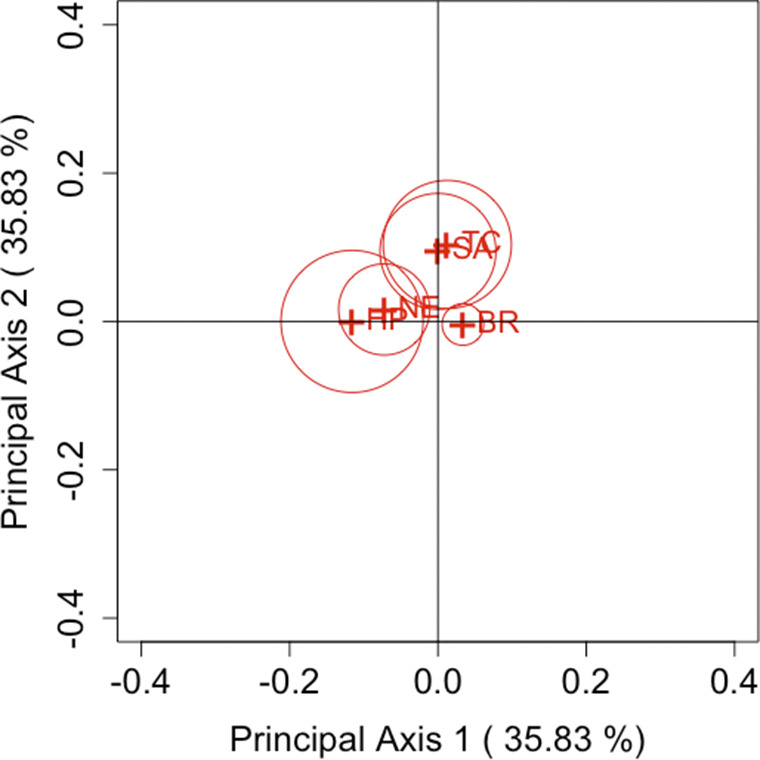 Figure 1
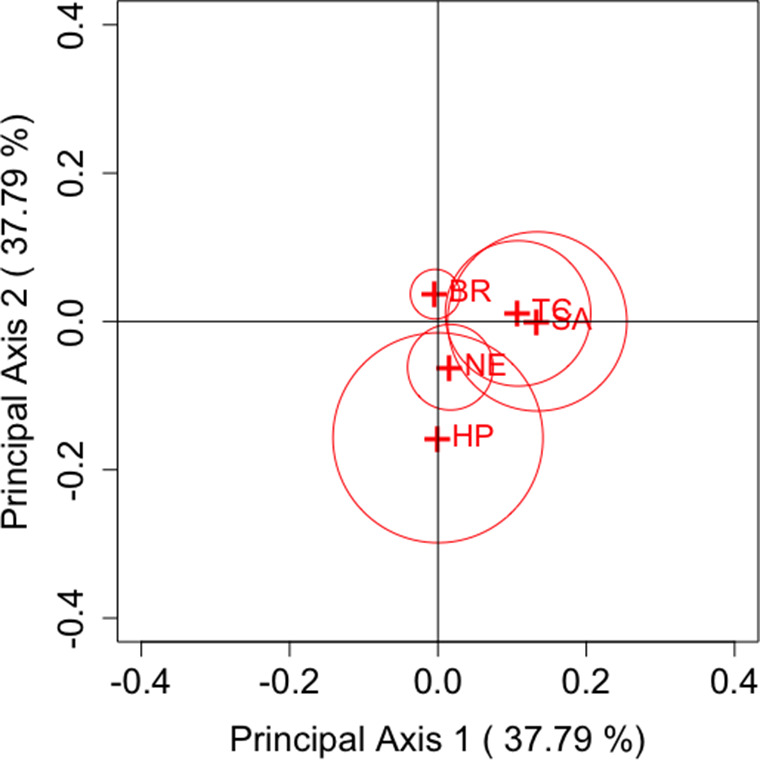 Figure 2
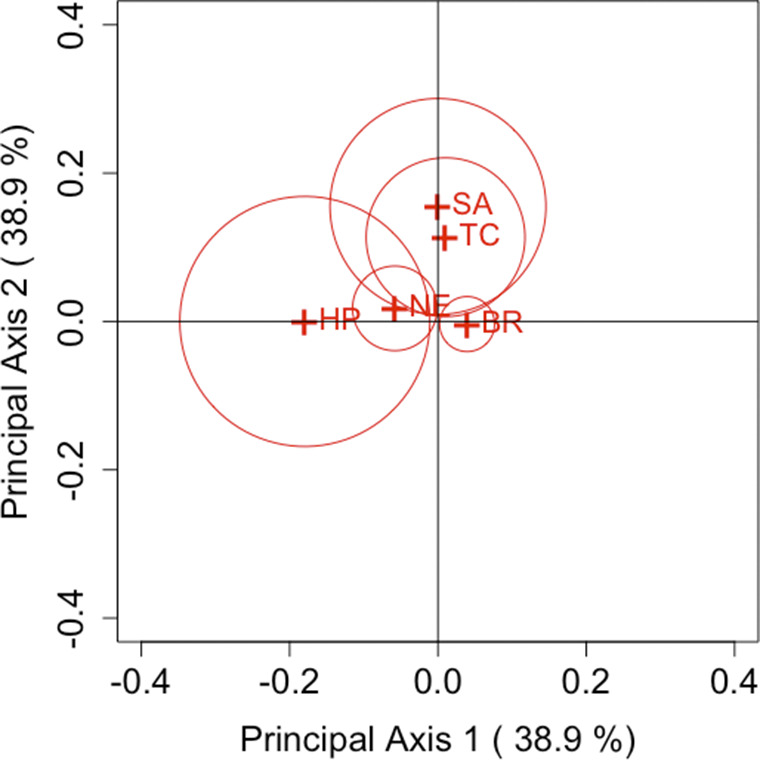 Figure 3
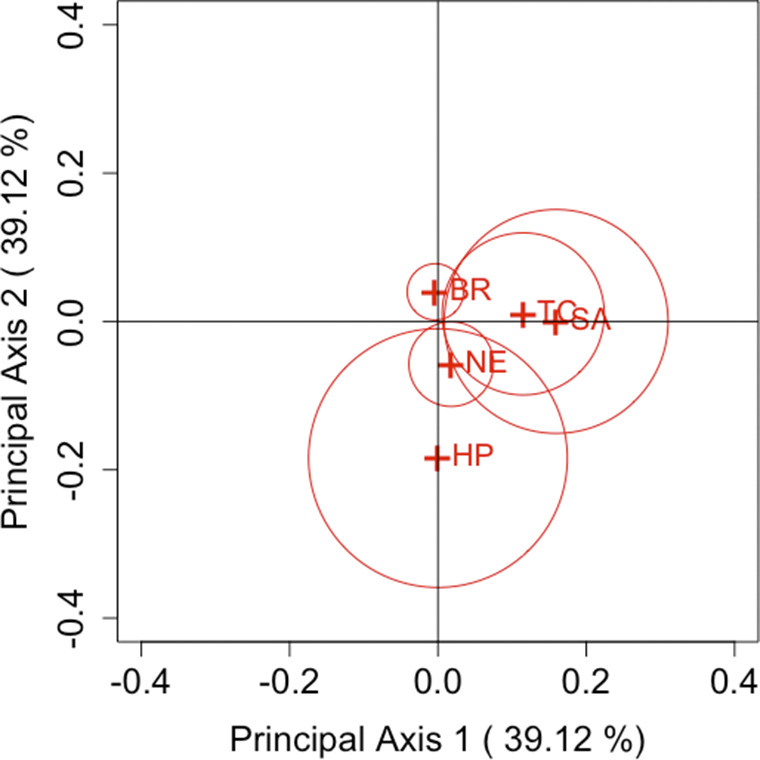 Figure 4
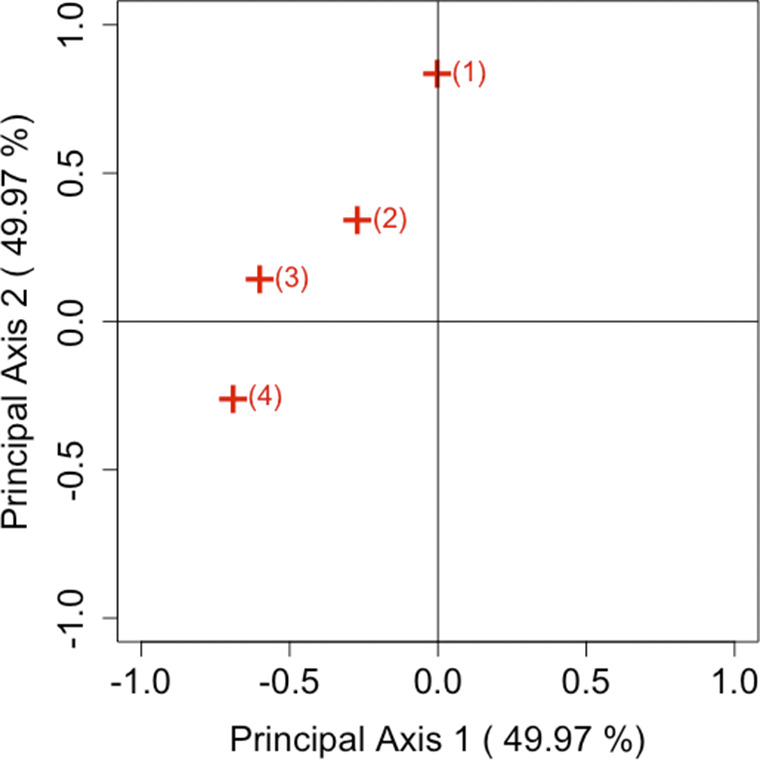 Figure 5
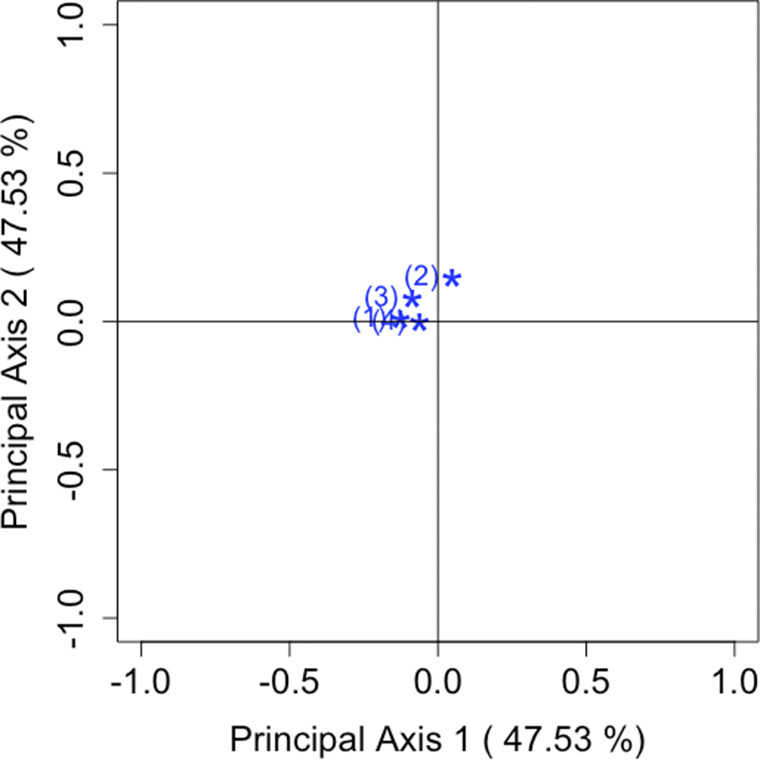 Figure 6
 Figure 48
 Figure 49
 Figure 50
Peer Reviews
No public reviews on file for this paper yet. If you reviewed it on a platform where reviews are public (OpenReview, ICLR, NeurIPS, ICML), you can paste yours below so the community can read it here.
Videos
No videos yet. Explain this paper in a talk, walkthrough, or lecture? Add one.
Taxonomy
TopicsSensory Analysis and Statistical Methods · Psychometric Methodologies and Testing · Cognitive and psychological constructs research