Left ventricular deformation and tissue characteristics in hypertrophic cardiomyopathy patients with HFpEF: a CMR study
Jian Liu, Zhengkai Zhao, Qiuyi Cai, Jiangyu Tian, Jin Gao, Hui Liu, Yao Song, Yuheng Huang, Zhuoan Li, Huaibi Huo, Xin Peng

TL;DR
This study uses CMR to show that HCM patients with HFpEF have worse heart function and more fibrosis, with specific CMR markers predicting HFpEF.
Contribution
The study identifies CMR-derived strain and tissue parameters as independent predictors of HFpEF in HCM patients.
Findings
HCM-HFpEF patients show reduced LV systolic and early-diastolic strain rates compared to non-HF patients.
HCM-HFpEF patients have higher LGE prevalence, elevated native T1, and ECV values, indicating increased fibrosis.
Lower LV-eGLSr and higher segmental ECV are independent predictors of HFpEF in HCM patients.
Abstract
This study aimed to evaluate left ventricular (LV) deformation and tissue characteristics using cardiac magnetic resonance (CMR) in patients with hypertrophic cardiomyopathy (HCM) and heart failure with preserved ejection fraction (HFpEF), to examine their associations with heart failure status, and to explore the correlations between CMR parameters and the H2FPEF score. This retrospective study included 105 patients with HCM who underwent 3.0-T CMR. Participants were classified into HFpEF (n = 46) and non-HF (n = 59) groups according to the 2019 ESC HFA-PEFF algorithm. Global radial strain (GRS), global circumferential strain (GCS), global longitudinal strain (GLS), and corresponding systolic and early-diastolic strain rates were derived using CMR feature tracking. Myocardial tissue characterization included native T1 and T2 mapping, extracellular volume fraction (ECV), and late…
Genes, proteins, chemicals, diseases, species, mutations and cell lines named across the full text — each resolved to its canonical identifier and authoritative record.
Click any figure to enlarge with its caption.
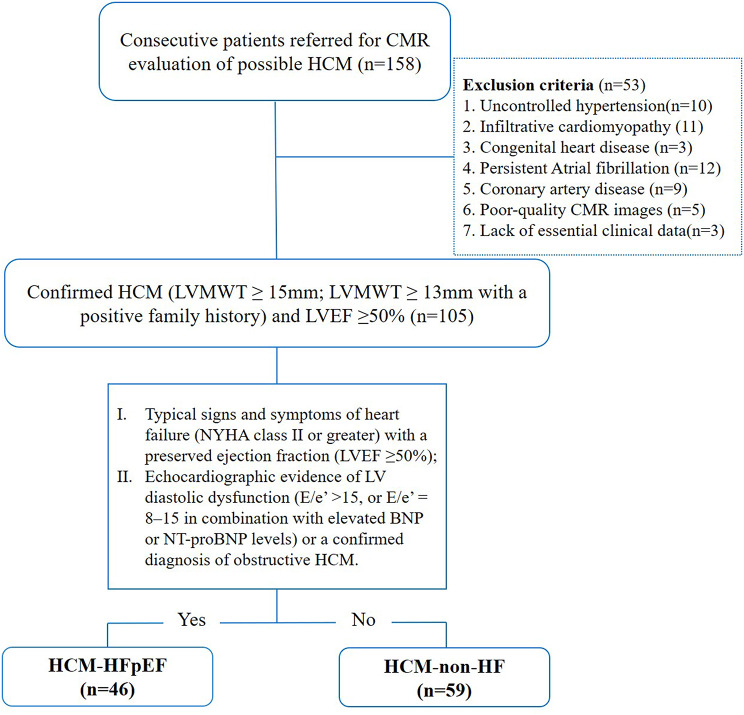 Figure 1
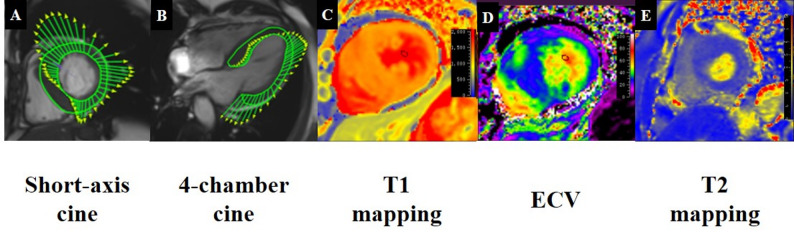 Figure 2
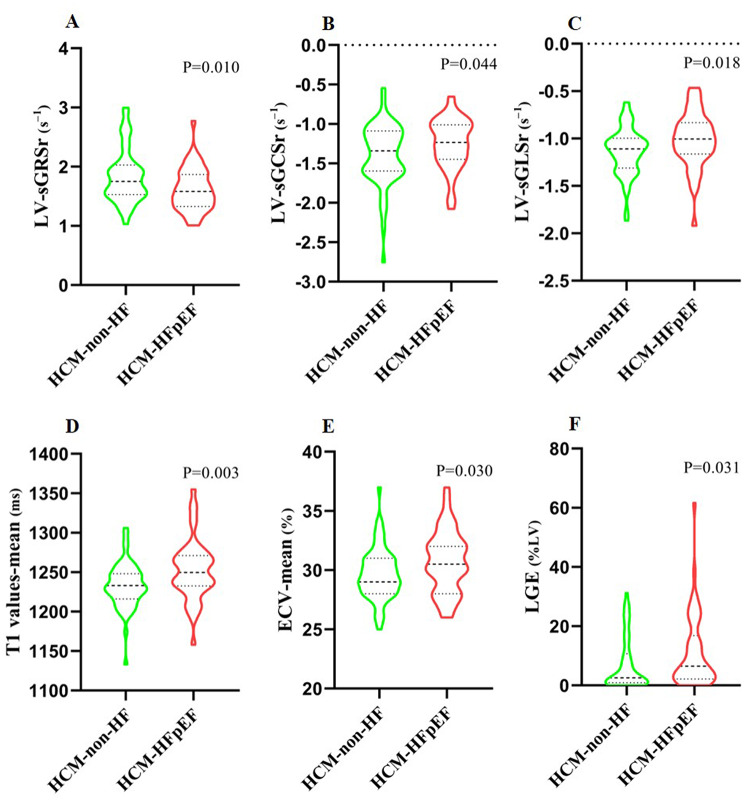 Figure 3
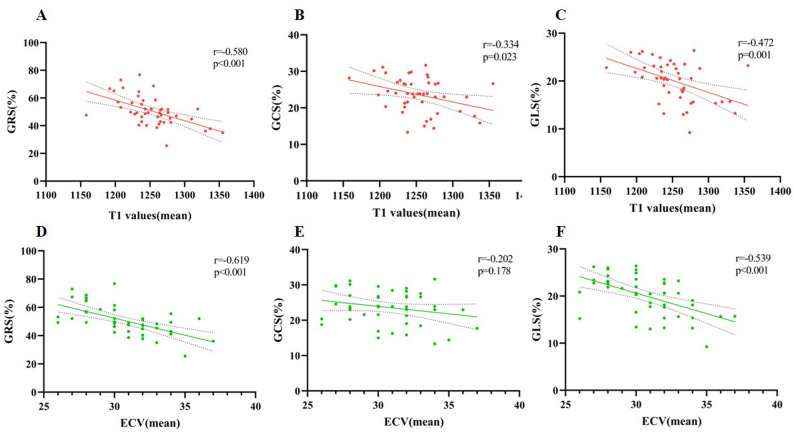 Figure 4
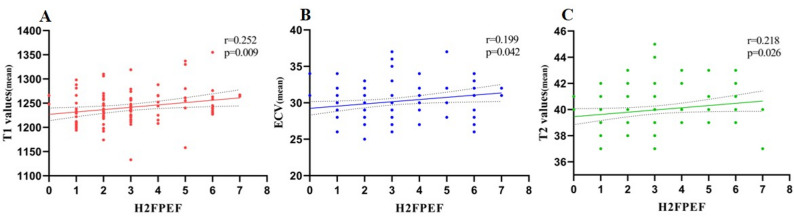 Figure 5
Peer Reviews
No public reviews on file for this paper yet. If you reviewed it on a platform where reviews are public (OpenReview, ICLR, NeurIPS, ICML), you can paste yours below so the community can read it here.
Videos
No videos yet. Explain this paper in a talk, walkthrough, or lecture? Add one.
Taxonomy
TopicsCardiovascular Function and Risk Factors · Cardiomyopathy and Myosin Studies · Cardiac Fibrosis and Remodeling
Introduction
Hypertrophic cardiomyopathy (HCM) is defined by unexplained left ventricular (LV) hypertrophy and is commonly associated with impaired diastolic function and elevated filling pressures, despite preserved systolic performance [1]. While the widespread adoption of implantable cardioverter-defibrillators, the incidence of sudden cardiac death in HCM has markedly declined, however, heart failure has emerged as a major clinical concern in this population [2]. Nearly half of patients present with heart failure at initial diagnosis, most often in the form of heart failure with preserved ejection fraction (HFpEF), which is associated with more advanced disease and a higher risk of adverse outcomes compared with those without heart failure [3, 4].
HFpEF in HCM patients represents a heterogeneous and multifactorial pathophysiological entity [5]. Emerging evidence suggests that HCM patients with HFpEF exhibit significantly impaired left atrial phasic function compared with those without heart failure [6]. However, LV deformation and myocardial tissue characteristics in this population remain insufficiently defined. Cardiac magnetic resonance (CMR) provides a comprehensive, noninvasive modality to evaluate myocardial structure, function, and tissue composition with high spatial resolution and reproducibility [7]. CMR feature-tracking (CMR-FT) enables quantification of strain and strain rates, which serve as sensitive markers of subclinical systolic and diastolic dysfunction [8]. Reduced LV global early diastolic longitudinal strain rate (eGLSr), global longitudinal strain (GLS), and global circumferential strain (GCS) reflect combined diastolic and systolic impairment in HFpEF [9, 10], yet their utility for identifying HFpEF specifically in HCM remains unclear.
Multiparametric CMR, including native T1 and T2 mapping, extracellular volume fraction (ECV), and late gadolinium enhancement (LGE), allows comprehensive characterization of diffuse interstitial expansion, myocardial edema, and focal fibrosis, thereby providing complementary insights into adverse remodeling processes underlying HFpEF in HCM [11, 12]. Beyond binary classification of HFpEF using ESC diagnostic criteria [13], the H_2_FPEF score offers a semiquantitative, multidimensional measure of HFpEF likelihood. Incorporating this score may offer a more nuanced understanding of the relationship between cardiac remodeling and HF burden in HCM, serveing as a tool for risk stratification rather than diagnosis [1].
Accordingly, this study aimed to comprehensively assess LV deformation and myocardial tissue characteristics using CMR in HCM patients with and without HFpEF, to identify independent CMR predictors of HFpEF, and to examine correlations between imaging metrics and the H₂FPEF score.
Materials and methods
Study population
This retrospective study was approved by the institutional review board of Chengdu Third People’s Hospital (approval number: 2025-S-124) and complied with the Declaration of Helsinki. The requirement for informed consent was waived owing to the retrospective design.
A total of 158 patients with a clinical diagnosis of HCM who underwent CMR between June 2020 and July 2024 were consecutively screened. The diagnostic criteria for HCM included non-dilated LV hypertrophy defined by a LV maximum wall thickness (LVMWT) ≥ 15 mm, or LVMWT ≥ 13 mm in the presence of a positive family history, and a preserved ejection fraction (LVEF ≥ 50%), as assessed by CMR [14]. Exclusion criteria included uncontrolled hypertension, infiltrative cardiomyopathies (e.g., amyloidosis), congenital heart disease, significant coronary artery disease (≥ 50% stenosis) or prior myocardial infarction, persistent atrial fibrillation (AF), poor image quality, and missing essential clinical data. Patients with paroxysmal AF were not excluded, provided that they were in sinus rhythm at the time of echocardiography and CMR, as irregular RR intervals during persistent AF may compromise the reliability of diastolic indices (E/e’) and CMR feature-tracking strain analysis. After applying these criteria, 105 patients were eligible for final analysis (Fig. 1).
Fig. 1. Subject flowchart. CMR, cardiac magnetic resonance; HCM, hypertrophic cardiomyopathy; LVMWT, left ventricular maximal wall thickness; LVEF, left ventricular ejection fraction; HFpEF, heart failure with preserved ejection fraction
HFpEF was diagnosed according to the 2019 European Society of Cardiology Heart Failure Association (HFA-PEFF) diagnostic algorithm [6, 15]. Patients were classified into HCM-HFpEF (n = 46) and HCM-non-HF (n = 59) groups. Inclusion criteria for the HCM-HFpEF group included: (I) typical signs and symptoms of heart failure (NYHA class II or greater) with a preserved ejection fraction (LVEF ≥ 50%); and (II) echocardiographic evidence of LV diastolic dysfunction (E/e’ >15, or E/e’ = 8–15 in combination with elevated BNP or NT-proBNP levels) or a confirmed diagnosis of obstructive HCM. Patients who did not meet these criteria were classified as non-HF. The H_2_FPEF score was calculated as a continuous variable to assess HFpEF likelihood, but was not used for diagnostic categorization. Baseline demographic and clinical data were extracted from electronic medical records. Echocardiography (for E/e’ and sPAP measurement) and biomarker assessments (including BNP, hs-cTnT, hematocrit, etc.) were performed within 24 h of the clinical evaluation, and CMR was completed within 48 h of these assessments.
CMR imaging protocol
CMR examinations were performed on a 3.0T scanner (MAGNETOM Skyra, Siemens Healthcare, Erlangen, Germany). Cine imaging, native T1 mapping, T2 mapping, and LGE sequences were acquired according to standardized protocols. Cine images were acquired using a balanced steady-state free precession (bSSFP) sequence in standard long-axis views (two-, three-, and four-chamber) and contiguous short-axis slices covering the entire left ventricle. Acquisition parameters were as follows: repetition time (TR) = 3.3 ms, echo time (TE) = 1.4 ms, flip angle = 52°, slice thickness = 6 mm. Native T1 mapping was performed using a modified Look-Locker inversion recovery (MOLLI) 5(3)3 acquisition scheme at three short-axis slices (basal, midventricular, and apical levels) with the following parameters: TR = 2.5 ms, TE = 1.1 ms, and flip angle = 35°. T2 mapping was acquired using a T2-prepared single-shot SSFP sequence with three T2 preparation times (0, 25, and 55 ms) at matching short-axis levels. Site-specific reference values for native T1 and T2 at 3.0 T (MOLLI 5(3)3 and T2-prepared SSFP sequence) were derived from our center’s previously published healthy control cohort, which provided validated normal ranges under identical acquisition conditions [16]. LGE imaging was performed 10 min after intravenous administration of gadolinium-based contrast agent (Gadovist; Bayer Healthcare Pharmaceuticals, 0.2 mmol/kg body weight) using a phase-sensitive inversion recovery (PSIR) sequence. Short-axis slices matching those used for cine and mapping sequences, as well as standard long-axis views, were acquired. The inversion time was individually adjusted to null normal myocardium.
CMR data analysis
Quantitative CMR analysis was independently performed by two experienced radiologists (X.P., 5 years; H.H., 10 years of CMR experience) using Medis Suite software (QMass and QStrain, Medis Medical Imaging Systems, Leiden, the Netherlands). All patients were anonymized and analyzed in a blinded manner.
LV volumes, mass, and LVEF were measured from short-axis cine images. LVMWT was defined as the maximum thickness across all myocardial segments. Myocardial strain analysis was performed using the standard Medis QStrain feature-tracking protocol. GLS was derived from 2-, 3-, and 4-chamber cine images, while GCS and global radial strain (GRS) were obtained from short-axis images. Peak systolic strain rates (sGLSr, sGCSr, sGRSr) and eGLSr were calculated. The software automatically tracked the motion of the endocardium and epicardium to quantify myocardial deformation, with manual adjustments made when necessary to ensure optimal tracking. Papillary muscles and trabeculae were consistently excluded from endocardial border delineation.
Myocardial tissue characterization included T1 mapping, T2 mapping, ECV, and LGE. Global values were obtained from basal, mid, and apical short-axis slices, while regional measurements were performed in hypertrophied segments (segments containing maximal wall thickness, MWT). ECV was calculated using pre- and post-contrast T1 values and hematocrit (Fig. 2). LGE extent was quantified semi-automatically as a percentage of LV myocardial mass using the full-width at half-maximum method, followed by manual correction in QMass.
Fig. 2. Representative examples of CMR parameter measurements in patients with hypertrophic cardiomyopathy. (A, B) Strain analysis derived from feature-tracking in one patient. (C–E) Tissue characterization measurements, including (C) T1 mapping, (D) ECV, and (E) T2 mapping, in another patient. ECV, extracellular volume
Statistical analysis
Continuous variables were expressed as mean ± standard deviation (SD) or median (interquartile range, IQR), and categorical variables as counts (percentages). Normality was assessed using the Shapiro–Wilk test and homogeneity of variance with Levene’s test. Between-group comparisons were performed using the Student’s t-test or Mann–Whitney U test for continuous variables, and the χ² test or Fisher’s exact test for categorical variables, as appropriate. Pearson or Spearman correlation analyses were conducted to evaluate (1) associations between CMR-derived strain parameters and tissue characterization indices, and (2) relationships between the H_2_FPEF score (treated as a continuous variable) and CMR metrics. Correlation strength was interpreted as negligible (< 0.2), weak (0.2–0.39), moderate (0.4–0.59), strong (0.6–0.79), or very strong (≥ 0.8). Univariable logistic regression was first applied to identify potential imaging predictors of HFpEF in HCM. Variables with P < 0.10, together with demographic factors (age, sex, body mass index [BMI]) and conventional cardiovascular risk factors (smoking, drinking, hypertension, diabetes, and dyslipidemia), were entered into a multivariable model. To avoid multicollinearity, only one representative was retained from highly correlated variables (e.g., LV-eGLSr over other strain rates; ECV-MWT over global T1 or ECV). The final multivariable model included LV-eGLSr, LGE (%LV mass), ECV-MWT, and the above demographic and risk factors. Odds ratios (ORs) with 95% confidence intervals (CI) were reported. Intra- and inter-observer variability of FT-derived strain and strain-rate measurements were assessed in 20 randomly selected patients. Inter-observer variability was evaluated by two radiologists (X.P. and H.H.) independently analyzing the same datasets, while intra-observer variability was assessed by one radiologist (X.P.) repeating the analysis after a 2-week interval. Agreement was quantified using intraclass correlation coefficients (ICC) and Bland–Altman analysis. All statistical analyses were conducted using SPSS (version 25.0, IBM, Armonk, NY, USA) and GraphPad Prism (version 8.0, GraphPad Software, USA). A two-sided P < 0.05 was considered statistically significant.
Results
Baseline clinical characteristics
Baseline demographic and clinical characteristics are summarized in Table 1. No significant differences were observed between the HCM-HFpEF and HCM-non-HF groups in age, sex, BMI, heart rate, or the prevalence of conventional cardiovascular risk factors. In contrast, atrial fibrillation and age > 60 years were more frequent in the HFpEF group. Biomarker levels were also significantly higher in HCM-HFpEF patients, with elevated BNP and hs-cTnT compared with non-HF patients. Regarding medical therapy, diuretic use was more common in the HFpEF group, while other treatments were similar between groups.
Table 1. Baseline clinical characteristicsVariablesHCM-HFpEF(N = 46)HCM-non-HF(N = 59)P valueAge (years)68 ± 959 ± 12 < 0.001 Male, n (%)23(50.0)31(52.5)0.796BMI (kg/m^2^)25.0 ± 3.925.2 ± 3.20.833Heart rate (bpm)71 ± 1370 ± 120.769Smoking, n (%)15(32.6)25(42.4)0.307Drinking, n (%)15(32.6)17(28.8)0.675Hypertension, n (%)30(65.2)32(54.2)0.256Diabetes, n (%)16(34.8)18(30.5)0.642Hyperlipidemia, n (%)11(23.9)14(23.7)0.983TC (mmol/liter)4.6 ± 1.94.3 ± 1.20.285TG (mmol/liter)1.9 ± 1.72.0 ± 1.50.801LDL-C (mmol/liter)2.5 ± 0.92.5 ± 0.90.620HDL-C (mmol/liter)1.4 ± 0.31.2 ± 0.30.103Hs-cTnT (ng/L)21.7(12.6–32.1)13.1(10.0-18.6) 0.005 BNP (pg/mL)244.5(147.4-542.2)72.3(42.2–108.0) < 0.001 NYHA class, n (%) I049(83.1) II44(95.7)10(16.9) III–IV2(4.3)0H_2_FPEF score variables, n (%)H_2_BMI > 30 (kg/m^2^)5(10.9)4(6.8)0.458Arterial hypertension30(65.2)32(54.2)0.256FAtrial fibrillation17(37.0)5(8.5) < 0.001 PsPAP > 35 mmHg9(19.6)5(8.5)0.088EAge > 60 years35(76.1)27(45.8) 0.002 FE/e’ >942(91.3)50(84.7)0.120Medical therapy Beta-blockers, n (%)30(65.2)47(79.7)0.097 Calcium-channel blockers, n (%)13(28.2)13(22.0)0.463 ACEI/ARB, n (%)27(58.7)25(42.4)0.097 Antithrombotic, n (%)11(24.0)11(18.6)0.510 Diuretic, n (%)20(43.5)10(17.0) 0.003 Statin, n (%)30(65.2)44(74.6)0.297Data are reported as mean ± SD, median (IQR), n (%) as appropriateBMI, Body mass index; TC, Total Cholesterol; TG, Triglycerides; LDL-C, Low-Density Lipoprotein Cholesterol; HDL-C, High-Density Lipoprotein Cholesterol; Hs-cTnT, high-sensitivity cardiac troponin T; BNP, brain natriuretic peptide; NYHA, New York Heart Association; sPAP, systolic pulmonary artery pressure; ACEI/ARB, angiotensin-converting enzyme inhibitor or angiotensin receptor blocker
CMR-based parameters
Conventional structural and volumetric CMR parameters did not differ significantly between groups (Table 2). Specifically, left ventricular mass (117.1 ± 46.4 vs. 115.4 ± 40.3 g, P = 0.835), maximal wall thickness (17.8 ± 4.1 vs. 17.1 ± 3.2 mm, P = 0.322), left ventricular mass index (70.7 ± 25.4 vs. 66.6 ± 21.7 g/m², P = 0.377), and left ventricular ejection fraction (LVEF, 64.0 ± 7.0% vs. 64.8 ± 5.6%, P = 0.504) were comparable between groups. LV volumes (LVEDVi, LVESVi, LVSVi) and cardiac output index (LVCOi) also showed no significant intergroup differences.
Table 2. Left ventricular dynamics parameters among subject groups with CMRVariablesHCM-HFpEF(N = 46)HCM-non-HF(N = 59)P valueLVMWT (mm)17.8 ± 4.117.1 ± 3.20.322LVOT obstruction, n (%)14(30.4)15(25.4)0.569LV mass (g)117.1 ± 46.4115.4 ± 40.30.835LV mass index (g/m^2^)70.7 ± 25.466.6 ± 21.70.377LVEDVi (ml/m^2^)63.5 ± 15.464.3 ± 15.30.810LVESVi (ml/m^2^)23.2 ± 7.922.9 ± 7.90.860LVSVi (ml/m^2^)40.3 ± 10.041.5 ± 9.10.535LVEF (%)64.0 ± 7.064.8 ± 5.60.504LVCOi l/(min*m^2^)2.8 ± 0.92.8 ± 0.60.483LV-GRS (%)50.6 ± 10.454.0 ± 9.80.089LV-sGRSr (s^–1^)1.62 ± 0.361.83 ± 0.44 0.010 Basal GRS (%)38.3 ± 13.838.6 ± 16.30.906Middle GRS (%)48.7 ± 17.251.8 ± 17.40.365Apical GRS (%)51.7 ± 24.159.3 ± 25.10.122LV-GCS (%)-23.6 ± 4.7-23.6 ± 4.40.950LV-sGCSr (s^–1^)-1.25 ± 0.32-1.39 ± 0.37 0.044 Basal GCS (%)-23.1 ± 5.6-23.9 ± 5.60.436Middle GCS (%)-23.7 ± 5.2-23.7 ± 5.00.970Apical GCS (%)-26.5 ± 10.1-27.5 ± 6.50.542LV-GLS (%)-20.0 ± 4.2-21.3 ± 3.70.098LV-sGLSr (s^–1^)-1.0 ± 0.3-1.1 ± 0.2 0.018 LV-eGLSr (s^–1^)0.75 ± 0.280.90 ± 0.28 0.006 Presence of LGE, n (%)44(95.7)47(80.0) 0.017 LGE (%LV)6.5(2.2–16.9)2.9(1.1–11.6) 0.031 LV blood T1 (msec)1789 ± 1271743 ± 1390.081T1 values-mean (ms)1253 ± 381233 ± 28 0.003 T1 values-MWT (ms)1294 ± 531264 ± 33 0.001 Hematocrit (%)41.6 ± 5.142.9 ± 5.10.211ECV-mean (%)30.7 ± 2.629.7 ± 2.2 0.030 ECV-MWT (%)34.5 ± 4.632.4 ± 2.9 0.005 T2 values-mean (ms)40.3 ± 1.739.7 ± 1.50.068T2 values-MWT (ms)40.5 ± 1.740.0 ± 1.50.093Data are reported as mean ± SD, median (IQR), n (%) as appropriateCMR, cardiac magnetic resonance; LV, left ventricular, LVMWT; LV maximal wall thickness; LVOT, LV outflow tract; LVEDVi, LV end-diastolic volume index; LVESVi, LV end-systolic volume index; LVSVi, LV stroke volume index; LVEF, LV ejection fraction; LVCOi, LV cardiac output index; GLS, GCS, and GRS, global peak longitudinal, circumferential, radial strain; sGLSr, sGCSr and sGRSr, global peak systolic LS, CS, RS rate. eGLSr, global early peak diastolic LS rate; LGE, late gadolinium enhancement; MWT, maximal wall thickness; ECV, extracellular matrix volume fraction
Myocardial deformation and tissue characteristics
CMR-derived LV strain parameters and myocardial tissue characterization are summarized in Table 2; Fig. 3. Compared with HCM-non-HF patients, those with HFpEF demonstrated significantly reduced global systolic and early-diastolic strain rates, including sGRSr (P = 0.010), sGCSr (P = 0.044), sGLSr (P = 0.018), and eGLSr (P = 0.006). GLS and GRS showed a trend toward lower values in the HFpEF group, but these differences did not reach statistical significance (GLS: P = 0.098; GRS: P = 0.089), and no significant difference was observed in GCS. Regarding tissue characteristics, HFpEF patients exhibited a markedly higher prevalence of LGE (96% vs. 80%, P = 0.017) with greater LGE burden (6.5% vs. 2.9%, P = 0.031). Native T1 and ECV values were significantly elevated in the HFpEF group, particularly in segments with maximal wall thickness (T1-MWT: 1294 vs. 1264 ms, P = 0.001; ECV-MWT: 34.5% vs. 32.4%, P = 0.005). T2 values showed a nonsignificant trend toward higher levels in HFpEF patients. Spearman correlation analysis demonstrated significant associations between CMR-derived strain indices and T1 and ECV (all P < 0.05), with the exception of GCS% and ECV, which showed no significant relationship (P = 0.178) (Fig. 4).
Fig. 3. Box-and-whisker plots of CMR parameters in HCM-HFpEF and HCM-non-HF groups. Horizontal lines represent the 5th and 95th percentiles; shaded boxes indicate the interquartile range (25th–75th percentiles); and central lines mark the median values. The plots illustrate group differences in (A) LV-sGRSr, (B) LV-sGCSr, (C) LV-sGLSr, (D) mean native T1 values, (E) mean ECV, and (F) percentage of LGE. sGLSr, sGCSr and sGRSr, global peak systolic LS, CS, RS rate. LGE, late gadolinium enhancement; HFpEF, heart failure with preserved ejection fraction
Fig. 4. Relationship between CMR-derived myocardial strain and tissue characterization metrics. All parameters showed significant correlations (all p < 0.05), except for GCS and ECV (p = 0.178)
Risk factors of HFpEF
Univariable logistic regression identified atrial fibrillation, LV strain rate parameters (sGLSr, sGRSr, sGCSr, eGLSr), and ECV-MWT as potential predictors of HFpEF (all P < 0.10). To reduce multicollinearity, LV strain rate indices were first compared, among which eGLSr showed the strongest association with HFpEF, exhibiting the highest odds ratio (Supplementary Table 1, Model 4), and was therefore retained in the final multivariable regression model. After adjustment for demographic and conventional risk factors, four parameters remained independently associated with HFpEF: drinking (OR = 5.79, 95% CI: 1.07–31.33, P = 0.041), atrial fibrillation (OR = 7.25, 95% CI: 1.76–29.83, P = 0.006), lower eGLSr (OR = 14.97, 95% CI: 2.03–110.60, P = 0.008), and higher ECV-MWT (OR = 1.27, 95% CI: 1.05–1.54, P = 0.016) (Table 3).
Table 3. The association between LV strain and myocardial tissue characterization and HFpEF in HCM patientsVariablesUnivariable AnalysisMultivariable AnalysisOR (95% CI)P ValuesOR (95% CI)P ValuesAge per year1.04(0.99–1.09)0.0781.04(0.97–1.11)0.254Male sex0.90(0.42–1.95)0.7961.67(0.51–5.40)0.395BMI (kg/m2)0.99(0.88–1.10)0.8311.01(0.87–1.17)0.932Smoking1.52(0.68–3.40)0.3080.45(0.08–2.35)0.340Drinking0.84(0.36–1.93)0.6755.79(1.07–31.33)0.041Hypertension0.63(0.29–1.40)0.2581.19(0.42–3.38)0.740Diabetes0.82(0.36–1.87)0.6430.31(0.08–1.20)0.090Hyperlipidemia1.01(0.41–2.50)0.9820.86(0.24–3.09)0.816Atrial fibrillation6.56(2.19–19.63) 0.001 7.25(1.76–29.83) 0.006 ECV-MWT (%)1.18 (1.05–1.33) 0.006 1.27(1.05–1.54) 0.016 LGE (%LV)1.04(0.99–1.08)0.0751.03(0.98–1.09)0.242eGLSr (s^–1^)9.12(1.75–47.57) 0.009 14.97(2.03–110.60) 0.008 OR, Odds ratio; CI, confidence interval; BMI, Body mass index; ECV, extracellular matrix volume fraction; MWT, maximal wall thickness; LGE, late gadolinium enhancement; eGLSr, global early peak diastolic longitudinal strain rate
Association between H2FPEF score and CMR parameters
Spearman correlation analysis revealed weak to moderate correlations between the H_2_FPEF score and myocardial tissue characterization parameters. Significant correlations were observed with T1-mean (r = 0.252, P = 0.009), T1-MWT (r = 0.249, P = 0.010), ECV-mean (r = 0.199, P = 0.042), ECV-MWT (r = 0.240, P = 0.014), T2-mean (r = 0.218, P = 0.026), and T2-MWT (r = 0.199, P = 0.042), with selected results illustrated in Fig. 5. No significant correlations were observed between H_2_FPEF score and global strain or strain rate parameters.
Fig. 5. Correlation of T1 values (mean), ECV (mean), T2 values (mean) with H_2_FPEF. Spearman’s correlations were A T1 values (mean) and H_2_FPEF: r = 0.252, p = 0.009; B ECV (mean) and H_2_FPEF: r = 0.199, p = 0.042; C T2 values (mean) and H_2_FPEF: r = 0.218, p = 0.026
Intra and interobserver variability
FT strain and strain-rate measurements demonstrated good intra- and inter-observer reproducibility, with ICCs ranging from 0.81 to 0.99 (Supplementary Table 2). Bland–Altman plots are shown in Supplementary Fig. 1.
Discussion
This study demonstrates that HCM patients with HFpEF present distinct patterns of myocardial dysfunction and tissue remodeling on CMR. Specifically, compared with HCM patients without HF, those with HFpEF exhibited not only diastolic dysfunction but also impaired systolic function, as evidenced by reduced early-diastolic strain rates (eGLSr) and systolic strain rates (e.g., sGLSr), along with a greater burden of myocardial fibrosis, whereas T2 mapping did not provide additional discriminatory value. Furthermore, drinking, atrial fibrillation, lower LV-eGLSr, and higher ECV in the segment of maximal wall thickness as independent risk factors for HFpEF. In addition, the observed correlations between H_2_FPEF scores and myocardial tissue characterization parameters suggest a potential role for CMR in multiparametric risk stratification of HFpEF among patients with HCM.
Among the deformation indices, GLS(r) reflects longitudinal shortening resulting from endocardial fiber contraction, GCS(r) reflects circumferential shortening resulting from epicardial fiber contraction, and GRS(r) reflects rapid myocardial radial thickening during systole [17]. Strain rate parameters are recognized to be more sensitive than conventional strain indices for detecting early systolic dysfunction and abnormalities in diastolic recoil. Specifically, early-diastolic strain rate serves as a sensitive early marker of diastolic dysfunction [18], whereas peak systolic strain rate reflects regional contractile performance [19]. In HCM patients, subendocardial dysfunction leads to reductions in GLS and GRS, whereas epicardial hypertrophy preserves GCS [20, 21]. In HFpEF, both diastolic impairment, reflected by significantly reduced eGLSr [9, 22], and systolic kinetic abnormalities, indicated by reduced GLS and GCS [10], have been described. Consistent with these prior observations, our findings show that HFpEF in HCM is not purely a diastolic disorder but encompasses measurable systolic kinetic derangements, which are sensitively captured by feature-tracking sGLSr, sGRSr, and sGCS. And HCM-HFpEF patients showed trends toward impaired LV strain (GRS and GLS), although these differences did not reach statistical significance. Notably, LV strain parameters derived from CMR have been shown to correlate with ECV quantified by T1 mapping [23]. In agreement with this framework, our findings highlight pronounced alterations in myocardial tissue composition in HCM-HFpEF. Compared with HCM-non-HF, patients with HFpEF exhibited significantly higher native T1 and ECV values, particularly within hypertrophied segments, along with greater prevalence and burden of LGE, collectively indicating a profibrotic phenotype. This integrated profile of diffuse interstitial expansion (ECV) and focal replacement scarring (LGE) likely contributes to pathological stiffening, impaired relaxation, and functional deterioration characteristic of HFpEF [7, 24–26]. Although the mechanisms of interstitial fibrosis in HCM are incompletely understood, transforming growth factor-β1–mediated extracellular matrix synthesis has been implicated [27]. These findings are consistent with recent evidence indicating that interstitial fibrosis in HCM is closely associated with left atrial remodeling and adverse clinical outcomes, even in patients considered at low risk [28]. Collectively, these observations suggest that diffuse myocardial fibrosis may represent a common substrate linking ventricular diastolic dysfunction, atrial remodeling, and the progression toward heart failure in HCM.
In prior studies, reduced eGLSr has been independently associated with adverse outcomes in HFpEF [9]. In our HCM cohort, impaired longitudinal diastolic deformation—as captured by a lower eGLSr—showed a robust and independent association with HFpEF after adjustment for demographics and conventional risk factors. The independent role of LV-eGLSr underscores the importance of subclinical cardiac dysfunction in HFpEF pathogenesis. Beyond functional markers, ECV-MWT also remained independently associated with HFpEF, with each 1% increment conferring an approximately 30% higher odds of HFpEF. These results are consistent with evidence that alterations in the extracellular compartment are important predictors of adverse outcomes in HCM, including sudden cardiac death, ventricular arrhythmias, and heart failure [27, 29], and that ECV provides prognostic value for MACEs in this population [30, 31]. The coexistence of impaired diastolic strain rate and elevated ECV-MWT supports a mechanistic link between diffuse interstitial expansion and abnormal deformation kinetics. In addition, recent studies have demonstrated that right ventricular (RV) dysfunction carries independent prognostic significance in HCM, beyond left ventricular involvement [32].
The H_2_FPEF score has been shown to be independently associated with HF outcomes in HCM [1]. In our study, no significant correlations were observed with LV strain or strain rate; however, weak but significant associations were identified between native T1, ECV, and T2 values—particularly within hypertrophied segments and in relation to the H_2_FPEF score. This pattern aligns with the understanding that tissue-level alterations precede or occur independently of mechanical changes [33, 34]. Correlation analysis between CMR parameters and the H_2_FPEF score further supports the integrative potential of imaging biomarkers in functional HFpEF assessment. The H_2_FPEF score, while primarily clinical, appears to partially capture myocardial remodeling severity in HCM [35], suggesting that the combination of scoring systems with imaging-derived fibrosis markers could enhance diagnostic and prognostic accuracy. Importantly, the modest correlation coefficients underscore that clinical scores and CMR capture complementary rather than overlapping dimensions of HFpEF pathophysiology.
Limitations
This study has several limitations. First, it was a retrospective, single-center analysis with a relatively modest sample size, which may have limited the power to detect subtle yet clinically meaningful differences. Second, the retrospective design is inherently prone to selection bias (e.g., overrepresentation of more advanced cases at a tertiary referral center), residual confounding (such as temporal variations in management strategies), and incomplete data on medication adherence, thereby limiting causal inference. Third, CMR was performed at a single time point, precluding assessment of longitudinal changes in myocardial structure and function. Fourth, RV parameters such as RVEF, RV volumes, and RV strain were not available, preventing evaluation of RV remodeling and its potential interaction with the HFpEF phenotype. Finally, several technical limitations inherent to CMR feature tracking should be acknowledged, including inter-vendor variability, limited temporal resolution, dependence on loading conditions [36, 37]. Future studies incorporating comprehensive biventricular assessment, along with larger, prospective multicenter cohorts and serial CMR examinations, are warranted to validate these findings and further delineate the temporal trajectory of myocardial remodeling in HCM-HFpEF.
Conclusions
In HCM patients, HFpEF is characterized by impaired LV deformation and a profibrotic myocardial substrate. Reduced eGLSr and increased ECV in the segment of maximal wall thickness were independently associated with HFpEF, underscoring the complementary role of functional and tissue-based markers. Weak but significant correlations between the H_2_FPEF score and CMR-derived tissue parameters suggest that integrating clinical scoring with imaging biomarkers may enhance phenotyping and risk stratification. These findings support the utility of multiparametric CMR for earlier detection and individualized management of high-risk HCM patients.
Supplementary Information
Below is the link to the electronic supplementary material.
Supplementary Material 1
The reference list from the paper itself. Each links out to its DOI / PubMed record.