Seroprevalence and risk factors of Helicobacter pylori infection among public sector employees in Kuwait
Hassan A. Bennakhi, Ahmad Al-Muhanna, Manaf A. Shehab, Jaber Al-Ali

TL;DR
This study found a 16.6% prevalence of Helicobacter pylori infection among public sector employees in Kuwait, with older age and male sex being key risk factors.
Contribution
The study provides the first reported seroprevalence data for H. pylori among Kuwaiti public sector employees.
Findings
The overall H. pylori IgG antibody prevalence was 16.6% among 513 participants.
Male sex was significantly associated with H. pylori IgG positivity (adjusted odds ratio = 2.127).
The highest prevalence was observed in participants over 50 years old.
Abstract
Approximately half of the global population is infected with Helicobacter pylori, which is associated with several diseases, including gastric adenocarcinoma. The prevalence of H. pylori infection among the general Kuwaiti population remains unknown. This cross-sectional study assessed the prevalence and associated risk factors of H. pylori infection among public sector employees in two governmental ministries in Kuwait. Each participant underwent a diagnostic test for H. pylori IgG antibodies. A questionnaire was administered to collect data on demographic characteristics, lifestyle habits, and medical history for descriptive and inferential statistics, including logistic regression analysis. The cohort comprised 513 participants aged 20–72 years. Among them, 508 specified their sex, with 63.6% (323/508) being male. The prevalence of H. pylori-specific IgG antibodies, which indicates…
Genes, proteins, chemicals, diseases, species, mutations and cell lines named across the full text — each resolved to its canonical identifier and authoritative record.
Click any figure to enlarge with its caption.
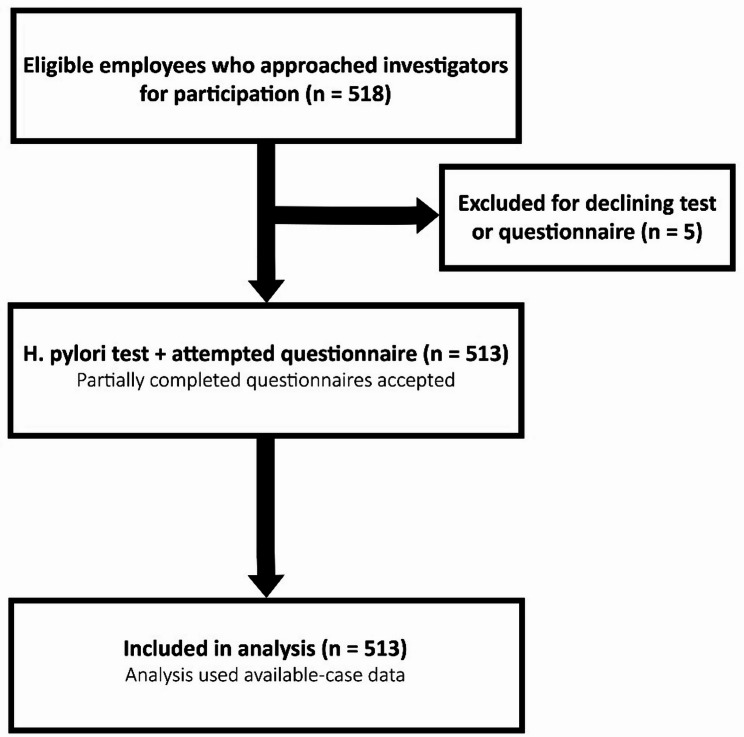 Figure 1
Peer Reviews
No public reviews on file for this paper yet. If you reviewed it on a platform where reviews are public (OpenReview, ICLR, NeurIPS, ICML), you can paste yours below so the community can read it here.
Videos
No videos yet. Explain this paper in a talk, walkthrough, or lecture? Add one.
Taxonomy
TopicsHelicobacter pylori-related gastroenterology studies · Microscopic Colitis · Eosinophilic Esophagitis
Introduction
Helicobacter pylori is a short, helical, S-shaped, Gram-negative bacterium that mainly infects the pyloric region of the stomach [1]. It is associated with gastric adenocarcinoma, mucosa-associated lymphoid tissue lymphoma, chronic gastritis, and peptic ulcer disease [2]. Transmission occurs primarily via the fecal–oral routes and commonly spreads within households [3, 4]. H. pylori is the most common human bacterial pathogen, and it infects approximately half of the world’s population [4]. The key determinants of prevalence are childhood socioeconomic conditions, particularly hygiene, sanitation, and household crowding [4]. H. pylori is the highest known risk factor for gastric cancer [5], substantially impacting global health, and gastric cancer was ranked fifth in the World Health Organization’s GLOBOCAN 2022 report in terms of incidence and mortality [6]. Given its clinical and economic impacts, H. pylori remains a major global health burden.
Prevalence of H. pylori in Kuwait
Current studies in Kuwait mainly focus on symptomatic patients. The prevalence of H. pylori infection among uninvestigated dyspeptic patients in Kuwait is 49.7% [7]. Further, only 7.3% of patients undergoing laparoscopic sleeve gastrectomy were infected [8]. Nevertheless, data on the prevalence of H. pylori infection in Kuwait are limited. To our knowledge, studies have not investigated the prevalence of H. pylori infection among the general population of Kuwait, nor have they looked at asymptomatic public sector employees.
Rationale and significance
Determining the prevalence of H. pylori infection among Kuwaiti nationals provides baseline epidemiologic data and allows monitoring of trends over time, while identifying its associated risk factors can inform future prevention efforts. Although prevalence may change, the underlying risk factors are likely to remain relevant. During this study, 2.9% of Kuwaitis were unemployed, and 62.3% of employed Kuwaitis worked in the public sector in 2013 [9]. Therefore, a sample population of public sector employees would be ideal for assessing the prevalence of H. pylori infection among Kuwaiti nationals. Even though they represent a minority of the total population [10], Kuwaiti nationals remain the primary focus of government policies and lawmakers.
Although our data were collected over a decade ago, they remain highly relevant considering the relative socioeconomic stability of this population and the lack of major structural changes in public employment demographics over the last decade. Further, the scarcity of comparable epidemiological data from Kuwait increases the importance of these findings, particularly in the context of designing more representative and comprehensive national studies. Thus, we examined the results of a novel cross-sectional study conducted between 2013 and 2014. This research evaluated the prevalence of H. pylori infection among public sector employees in Kuwait and investigated its association with sociodemographic characteristics, behavioral aspects, and gastrointestinal symptoms.
Materials and methods
Study design and settings
This cross-sectional study was conducted among public sector employees in Kuwait. The minimum required sample size was estimated using the formula \documentclass[12pt]{minimal} \usepackage{amsmath} \usepackage{wasysym} \usepackage{amsfonts} \usepackage{amssymb} \usepackage{amsbsy} \usepackage{mathrsfs} \usepackage{upgreek} \setlength{\oddsidemargin}{-69pt} \begin{document}$$\:S={Z}^{2}\times\:p\times\:(1-p)/{e}^{2}$$\end{document} . Assuming a population proportion ( \documentclass[12pt]{minimal} \usepackage{amsmath} \usepackage{wasysym} \usepackage{amsfonts} \usepackage{amssymb} \usepackage{amsbsy} \usepackage{mathrsfs} \usepackage{upgreek} \setlength{\oddsidemargin}{-69pt} \begin{document}$$\:p$$\end{document} ) of 0.5, a 95% confidence level ( \documentclass[12pt]{minimal} \usepackage{amsmath} \usepackage{wasysym} \usepackage{amsfonts} \usepackage{amssymb} \usepackage{amsbsy} \usepackage{mathrsfs} \usepackage{upgreek} \setlength{\oddsidemargin}{-69pt} \begin{document}$$\:Z=1.96$$\end{document} ), and a 5% margin of error ( \documentclass[12pt]{minimal} \usepackage{amsmath} \usepackage{wasysym} \usepackage{amsfonts} \usepackage{amssymb} \usepackage{amsbsy} \usepackage{mathrsfs} \usepackage{upgreek} \setlength{\oddsidemargin}{-69pt} \begin{document}$$\:e=0.05$$\end{document} ), the calculated minimum sample size was 385. Data were collected from December 1, 2013, to October 10, 2014, at two governmental ministries: the Ministry of Justice and the Ministry of Finance, where employees participated voluntarily.
Participants
The inclusion criteria were age ≥ 18 years, completion of the questionnaire, and H. pylori testing. Individuals who declined either the questionnaire or the test were excluded. Of 518 employees who participated, five were excluded, leaving 513 in the final sample. The STROBE flow diagram illustrates participant recruitment and inclusion (Fig. 1).
Data collection procedures
Participants completed a structured paper-based questionnaire on sociodemographic characteristics, lifestyle factors, health history, and gastrointestinal symptoms. The questionnaire was developed specifically for this study, reviewed by a subject-matter expert, and provided in Arabic and English versions. Partially completed questionnaires were accepted. Considering the study’s descriptive design, no formal pilot testing or validation was performed. Supplementary File 1 shows the English language version of the questionnaire.
H. pylori IgG was assessed using a rapid chromatographic lateral-flow immunoassay kit (CLIA-05-9476, CLIA-waived Inc., San Diego, CA, USA). Capillary whole blood was collected via finger prick, and the kit’s reported sensitivity and specificity were 95.1% and 94.1%, respectively.
Outcome measurements and variables
The primary outcome was H. pylori seropositivity, classified dichotomously (positive versus negative) based on the presence of both test and control lines on the rapid assay. Variables assesed included age, sex, nationality, marital status, education level, household crowding (persons per toilet), smoking status, hygiene practices, body mass index (BMI), and gastrointestinal symptoms.
Ethical considerations
The current study was approved by Kuwait University’s Health Sciences Center (reference #304; 21/05/2013). Written informed consent was obtained from all participants before enrollment. Both ministries approved the study before recruitment. All study procedures followed the approved protocol by the Ethics Committee and the guidelines and regulations of Kuwait University and the relevant ministries. Data were anonymized.
Statistical analysis
Results were analyzed using the Statistical Package for the Social Sciences (SPSS) software version 29.0.2.0 (IBM Corp., Armonk, NY, USA) for descriptive analyses and to measure associations (ORs and binary logistic regression), confidence interval (CIs), and significance. Pearson’s chi-squared test compared categorical groups, with two-sided p-values ≤ 0.05 considered statistically significant. Logistic regression analysis was performed to adjust for confounders, with the H. pylori test result as the dependent variable. The independent variables were those found to be statistically significant: sex, age, and nationality. The reference age group was the 20–30-year-old group, the reference sex was female, and the reference nationality was Kuwaiti. Missing data were not imputed. The Statistical Package for the SPSS was used to perform listwise deletion for multivariate analysis and pairwise deletion for descriptive and univariate analyses. Thus, only participants with available data for the variables of interest were included in each analysis.
Results
Demographic characteristics of the study cohort
Of the 518 ministerial employees who approached the study investigators, 5 who did not answer the questionnaire or undergo the H. pylori test were excluded (Fig. 1). Thus, the final cohort comprised 513 participants aged 20–72 (mean: 35.95 ± 9.84) years. Among them, 508 specified their sex, with 323 (63.6%) being male and 185 (36.4%) being female. There were 314 (62.2%) Kuwaiti nationals and 191 (37.8%) non-Kuwaiti nationals. The participants, including 124 (24.7%) from Al-Asimah (the capital governorate), 145 (28.8%) from Hawalli, 154 (30.6%) from Farwaniya, and 80 from distant governorates (Ahmadi, n = 30 [6.0%]; Jahra, n = 13 [2.6%]; and Mubarak Al-Kabeer, n = 37 [7.4%]), resided across all six Kuwaiti governorates.
Fig. 1A participation flow diagram illustrating recruitment, exclusions, and the final analytical sample
Prevalence of H. pylori infection and its associated factors
There were 85 (16.6%) study participants who tested positive for H. pylori (95% CI 13%–20%). The association between various factors—including demographic and socioeconomic characteristics (Table 1), behavioral patterns and hygiene practices (Table 2), and gastrointestinal symptoms—and a positive H. pylori test result was analyzed (Table 3). Several demographic factors, including male sex (odds ratio [OR]: 2.381, 95% CI 1.366–4.149, p-value = 0.002), age > 50 years (OR: 2.683, 95% CI 1.237–5.819, p-value = 0.013), and a non-Kuwaiti nationality (OR: 1.716, 95% CI 1.065–2.763, p-value = 0.026), were significantly associated with seropositivity (Table 1). None of the behavioral or hygiene-related factors, including smoking status, hand washing before handling food, bathing frequency, exercise frequency, BMI, and number of people sharing a toilet, were significantly associated with a positive H. pylori test result. The normal-weight participants had lower odds of infection than the other BMI groups. This association approached statistical significance in the overweight group (OR: 1.758, 95% CI 0.916–3.375, p-value = 0.090) (Table 2).
Table 1. Comparison between demographic and socioeconomic characteristics and their association with positive H. pylori test resultsCharacteristics of the participantsAll participantsParticipants with a positive H. pylori testOR95% CIp-value^a^N (%)N (%)LowerUpperSex Female (R)185 (36.4)18 (9.7) Male323 (63.6)66 (20.4)2.3811.3664.1490.002Age (years) 20–30 (R)190 (37.5)21 (11.1) 31–40167 (33.0)30 (18.0)1.7620.9663.2160.065 41–5097 (19.2)18 (18.6)1.8340.9253.6330.082 > 5052 (10.3)13 (25.0)2.6831.2375.8190.013Marital status Single (R)116 (22.8)17 (14.7) Married370 (72.8)64 (17.3)1.2180.6812.1770.506 Divorced22 (4.3)3 (13.6)0.9200.2453.4490.901Nationality Kuwaiti (R)314 (62.2)42 (13.4) Non-Kuwaiti191 (37.8)40 (20.9)1.7161.0652.7630.026Governorate Capital (R)124 (24.7)18 (14.5) Hawalli145 (28.8)19 (13.1)0.8880.4431.7780.737 Farwaniya154 (30.6)36 (23.4)1.7970.9633.3520.066 Ahmadi (rural)30 (6.0)2 (6.7)0.4210.0921.9210.264 Jahra (rural)13 (2.6)2 (15.4)1.0710.2195.2360.933 Mubarak Al-Kabeer37 (7.4)5 (13.5)0.9200.3172.6740.878Educational level Highschool or less (R)89 (17.9)18 (20.2) Intermediate diploma175 (35.2)29 (16.6)0.7830.4081.5050.464 University or above233 (46.9)35 (15)0.6970.3711.3090.262Schooling Public (R)451 (92.0)71 (15.7) Private39 (8.0)8 (20.5)1.3810.6103.1280.439Monthly family income (KD) < 500 (R)119 (24.8)25 (21.0) 500 to < 1,000111 (23.2)20 (18.0)0.8260.4291.5910.568 1,000 to < 1,500147 (30.7)21 (14.3)0.6270.3311.1870.152 1,500 to < 2,00039 (8.1)3 (7.7)0.3130.0891.1020.071 > 200063 (13.2)9 (14.3)0.6270.2731.4400.271OR, odds ratio; CI, confidence interval; (R), reference; KD, Kuwaiti Dinars^a^Pearson’s chi-squared test
Table 2. Comparison between behavioral and hygiene practices and their association with positive H. pylori test resultsCharacteristics of the participantsAll participantsParticipants with a positive H. pylori testOR95% CIp-value^a^N (%)N (%)LowerUpperCigarette smoking status Non-smoker (R)372 (74.3)56 (15.1) Smoker129 (25.7)27 (20.9)1.4940.8962.4890.123Hand washing before food handling Not always (R)187 (37.9)30 (16.0) Always307 (62.1)50 (16.3)1.0180.6211.6690.943Bathing frequency Once weekly (R)5 (1.0)2 (40.0) Twice weekly25 (5.0)7 (28.0)0.5830.0804.2710.596 3–4 times weekly147 (29.5)19 (12.9)0.2230.0351.4200.112 Daily322 (64.5)54 (16.8)0.3020.0491.8520.196Exercise frequency Never (R)179 (35.7)30 (16.8) Monthly or less103 (20.5)16 (15.5)0.9130.4711.7710.789 Weekly138 (27.5)19 (13.8)0.7930.4251.4790.466 Daily82 (16.3)17 (20.7)1.2990.6702.5200.439People per toilet 1 (R)80 (16.4)11 (13.8) 2196 (40.1)30 (15.3)1.1340.5382.3900.742 394 (19.2)18 (19.1)1.4860.6563.3660.343 ≥ 4119 (24.3)21 (17.6)1.3440.6092.9670.464Body mass index (kg/m^2^) Normal weight (18.5–24.9) (R)136 (29.3)15 (11.0) Underweight (< 18.5)6 (1.3%)1 (16.7)1.6130.17614.7520.672 Overweight (25.0–29.9)190 (40.9)34 (17.9)1.7580.9163.3750.090 Obese (≥ 30)132 (28.4)23 (17.4)1.7020.8453.4280.136OR, odds ratio; CI, confidence interval; (R), reference^a^Pearson’s chi-squared test
Table 3. Association of Gastrointestinal symptoms with positive H. pylori test resultsGastrointestinal symptomsAll patientsPatients with a positive H. pylori testOR95% CIp-value^a^N (%)N (%)LowerUpperAbdominal pain240 (55.2)39 (16.3)0.8870.5371.4640.639 Never (R)195 (44.8)35 (17.9) Rarely152 (34.9)24 (15.8)0.8570.4851.5140.595 Weekly55 (12.6)6 (10.9)0.5600.2221.4090.218 Daily33 (7.6)9 (27.3)1.7140.7344.0060.213Heart burn240 (55.8)47 (19.6)1.4700.8772.4660.144 Never (R)190 (44.2)27 (14.2) Rarely144 (33.5)29 (20.1)1.5220.8562.7080.153 Weekly60 (14.0)10 (16.7)1.2070.5472.6650.641 Daily36 (8.4)8 (22.2)1.7250.7124.1790.227Nausea161 (38.7)16 (9.9)0.4640.2540.8480.013 Never (R)255 (61.3)49 (19.2) Rarely116 (27.9)11 (9.5)0.4400.2200.8820.021 Weekly37 (8.9)4 (10.8)0.5100.1721.5060.223 Daily8 (1.9)1 (12.5)0.6010.0724.9950.637Fullness after a small meal207 (48.7)35 (16.9)1.0640.6371.7770.813 Never (R)218 (51.3)35 (16.1) Rarely114 (26.8)18 (15.8)0.9800.5271.8220.950 Weekly32 (7.5)4 (12.5)0.7470.2472.2630.606 Daily61 (14.4)13 (21.3)1.4160.6952.8850.338Belching147 (37.3)18 (12.2)0.6440.3561.1630.144 Never (R)247 (62.7)44 (17.8) Rarely89 (22.6)9 (10.1)0.5190.2421.1120.092 Weekly25 (6.3)1 (4.0)0.1920.0251.4590.111 Daily33 (8.4)8 (24.2)1.4760.6253.4900.375Bloating285 (63.8)47 (16.5)0.9870.5881.6580.962 Never (R)162 (36.2)27 (16.7) Rarely126 (28.2)18 (14.3)0.8330.4361.5930.581 Weekly70 (15.7)13 (18.6)1.1400.5492.3670.725 Daily89 (19.9)16 (18.0)1.0960.5552.1650.792OR, odds ratio; CI, confidence interval; (R), reference^a^Pearson’s chi-squared test
Among the gastrointestinal symptoms, only nausea was significantly negatively associated with the test results (OR: 0.464, 95% CI: 0.254–0.848, p-value = 0.013). However, when nausea frequency was categorized as never, rarely, weekly, and daily, only rare occurrences were significantly negatively associated with a positive H. pylori test compared with never experiencing nausea (OR: 0.440, 95% CI: 0.220–0.882, p-value = 0.021). Further, weekly or daily nausea was not statistically significant, despite showing a negative association with a positive H. pylori test. The other gastrointestinal symptoms were positively associated with a positive H. pylori test when they occurred daily. However, none were statistically significant (Table 3).
Based on the multivariate analysis, male sex was the only independent predictor (adjusted OR: 2.127, 95% CI: 1.121–4.033, p-value = 0.021). Two age groups were approaching significance: the 31–40-year-old group (OR: 1.718, 95% CI: 0.930–3.173, p-value = 0.084) and the 41–50-year-old group (adjusted OR: 1.904, 95% CI: 0.948–3.824, p-value = 0.070). Age > 50 years, which showed a significant association with a positive H. pylori test in the initial analysis, did not show a significant association in the logistic regression analysis (OR: 1.814, 95% CI: 0.780–4.220, p-value = 0.167) (Table 4).
Table 4. Logistic regression analysis^a^ of variables identified as significant in the initial analysisCharacteristics of the participantsAdjusted OR95% CIp-valueLowerUpperSex Female (R)1.00 Male2.1271.1214.0330.021Age (years) 20–30 (R)1.00 31–401.7180.9303.1730.084 41–501.9040.9483.8240.070 > 501.8140.7804.2200.167Nationality Kuwaiti (R)1.00 Non-Kuwaiti1.0330.5861.8210.910OR, odds ratio; CI, confidence interval; (R), reference^a^Binary logistic regression. Dependent variable: 0 = negative H. pylori test, 1 = positive H. pylori test. Independent variables: sex, age, and nationality
Discussion
In the current study cohort, 16.6% of the participants tested positive for H. pylori, which is an important finding. However, these results should be interpreted with caution, as the sample may not represent the broader Kuwaiti population. First, this study exclusively focused on public sector employees, excluding other groups such as private sector employees, children, retirees, and the unemployed, thereby limiting its generalizability. In addition, our cohort comprised 62.2% of Kuwaiti nationals and 37.8% of non-Kuwaitis. This finding does not reflect the overall population in Kuwait in 2013, in which Kuwaiti nationals were the minority (33.6%) of the total population and non-Kuwaitis were the majority (66.4%) [9]. Further, as all participants were public sector employees, the cohort is more representative of the occupational distribution of Kuwaiti nationals as opposed to non-Kuwaitis because Kuwaiti nationals occupied 72.9% of public sector jobs in 2013 [9]. However, our study population offers insights into the overall H. pylori infection status among the employees of two of Kuwait’s government ministries. The male-to-female ratio is extremely similar to that of the overall Kuwaiti population, as the official estimates for 2013 reported that 55.6% of the total population were men. The proportion of ages represented in our sample is similar to the results of the 2011 national census, which reported that 74.3% of the total population was aged < 40 years [10]. This is reflected in our study cohort, in which 70.6% of participants were aged ≤ 40 years.
Compared with other countries, our results indicated a lower prevalence of H. pylori in Kuwait [11]. Several studies in West Asia and North Africa have reported high H. pylori prevalence infection among asymptomatic individuals. Rates include 71% in Nahavand, Iran [12], ; 64.2% among children in West Iran [13]; and 51% in Makkah, Saudi Arabia [14]. These studies showed that H. pylori prevalence increases with age. In Egypt, rates of 72.38% among schoolchildren [15] and 87.6% among individuals under 30 further indicate that infections commonly begin in early childhood [16]. However, a Saudi Arabian study reported a rate of 16.9% H. pylori seropositivity in those aged < 20 years and an overall prevalence of 28.8%, with higher rates in the older age groups [17]. Furthermore, they found that living in a rural area, crowded housing, and low socioeconomic status were independently associated with seropositivity. This may explain the slightly lower rate of seropositivity observed in our study, given the overall better quality of life, higher gross domestic product per capita, slightly younger population, higher level of urbanization, and lower unemployment rates in Kuwait [18, 19]. In our cohort, only 8.6% participants reported living in governorates that were considered rural, and the majority had either a university degree (46.9%) or intermediate education (35.2%).
Our prevalence aligns with reports from some European populations. A study in the Netherlands in 2013 reported a mean H. pylori seroprevalence for those born between 1977 and 1987 of 16% [20]. However, the aforementioned findings of a lower prevalence in some European countries are inconsistent. Another study performed in the Netherlands to determine H. pylori prevalence in pregnant women by measuring anti-H. pylori IgG and cytotoxin-associated gene product A antibodies found an overall seroprevalence of 46%, with Dutch women having a notably lower prevalence than non-Dutch women (24% vs. 64%) [21]. A study on H. pylori prevalence in Porto, Portugal, using an anti-H. pylori IgG enzyme-linked immunosorbent assay also found a high prevalence of 84.2% overall and 72.6% for those aged 18–30 years [22].
The prevalence of H. pylori in several Asian and African countries was also reported as high, reaching >50% in most countries [23]. Regional differences in the H. pylori prevalence likely reflect sanitation, hygiene, cultural practices, and socioeconomic conditions [24]. The lower prevalence observed in our study compared with regional and global estimates may be due to Kuwait’s higher living standards, widespread access to clean water and sanitation, robust public healthcare, lower household crowding, routine medical screening in government institutions, and accessible treatment through primary care. Improved childhood hygiene, including safer food preparation and reduced use of shared feeding utensils [25], may further reduce transmission and help explain lower prevalence in other Gulf countries.
In our study, male sex was the only independent factor significantly associated with a positive H. pylori test. Age > 50 years and non-Kuwaiti nationality were not statistically significant after adjustment in the logistic regression analysis, thereby indicating that their initial significance was attributed to confounding by male sex. This is supported by the demographic characteristics of our cohort, in which 95.3% (182/191) of non-Kuwaitis and 92.3% (48/52) of participants aged > 50 years were men. Consequently, male sex potentially confounded these associations.
Our findings are in contrast to those of other studies that did not find any association between H. pylori infection and sex [23]. Rather, socioeconomic factors such as low socioeconomic status, low education level, residence in rural areas or crowded homes, and consumption of contaminated water were found to be associated with H. pylori infection. However, our findings are in accordance with those of Replogle et al., who reported a significant association between male sex and H. pylori seropositivity, even after adjusting for confounders in a California-based study of 567 participants. This finding was further supported by a meta-analysis [26]. Replogle et al. showed that peptic ulcers and gastric cancers—both strongly associated with H. pylori—are 1.5–3 times more common in men, potentially because of a higher prevalence of H. pylori infection among the male participants. However, considering the inconsistency in existing data, further studies should be performed to confirm the correlation. Our univariate data analysis showed a negative association between some symptoms and H. pylori seropositivity, which should be interpreted cautiously. This may be because H. pylori infections are mostly asymptomatic [27, 28] or could reflect chance or reporting bias, as gastrointestinal symptoms were self-reported and subject to recall and perception variability.
This study uniquely explores the prevalence and risk factors of H. pylori infection among public sector employees in Kuwait, a population not previously examined. H. pylori infection is associated with numerous diseases, including gastric cancer. Hence, our findings should prompt further exploration of the health implications of the H. pylori prevalence found in our study. Further, they can be used as a baseline for future studies to determine whether the infection rate has increased or decreased since our study was performed. Literature from the Gulf region remains limited; therefore, our findings help address this gap and emphasize the need for larger, multicenter studies to validate the demographic, biological, and lifestyle determinants of H. pylori infection in Gulf states.
Limitations
The current study had several limitations including the test method used, source of the sample population, selection method, and sample size. Considering the cross-sectional design, temporality or causality between identified factors and H. pylori infection could not be determined. Observed associations should be interpreted cautiously, as the selected test detects IgG antibodies, which cannot distinguish current infections from previous ones. The manufacturer claimed that the test had a sensitivity of 95.1% and a specificity of 94.1%. However, it would have been better to use a test that had undergone independent and rigorous scrutiny, given the relatively lower specificity of serologic assays [29, 30] and the availability of more accurate serology tests, such as enzyme immunoassay [31]. Consequently, the possibility of obtaining false-positive and/or false-negative results remains a concern. Participants from the public sector better represent Kuwaiti nationals, who are a minority population in Kuwait, while the majority of the population is non-Kuwaiti. Participants were recruited from two government ministries only (Finance and Justice), which may limit generalizability of the results. However, considering Kuwait’s centralized government structure, small geographic size, and employment distribution, this limitation is unlikely to have significantly affected the results. Another limitation is the selection method used because potential participants had to approach the study investigators to be recruited. This introduced self-selection bias and might have had an effect on the results (i.e., those who had undergone recent testing for H. pylori infection or those who knew that they were infected and might have decided not to approach the study investigators). Further, data collection via self-reported questionnaires might have introduced recall or social desirability bias, particularly in responses concerning hygiene practices and symptoms. The sample size could have affected the association analysis, and a larger sample size might have revealed stronger associations. As job role data were not collected, the H. pylori tests between junior and senior level employees could not be compared, and this is another limitation of this study.
Supplementary Information
Below is the link to the electronic supplementary material.
Supplementary Material 1
The reference list from the paper itself. Each links out to its DOI / PubMed record.
- 1Cancer Today. Global Cancer Observatory. Available from: https://gco.iarc.who.int/today/
- 2Annual Statistical Abstract. 2014. State of Kuwait: Central Statistical Bureau; 2015. Available from: https://www.csb.gov.kw/. Accessed 9 May 2024.
- 3Annual Statistical Abstract. 2013. State of Kuwait: Central Statistical Bureau; 2014. Available from: https://www.csb.gov.kw/. Accessed 9 May 2024.
- 4Kuwait. The World Factbook. 2024. Available from: https://www.cia.gov/the-world-factbook/countries/kuwait/. Accessed 9 May 2024.
- 5Saudi Arabia. The World Factbook. 2024. Available from: https://www.cia.gov/the-world-factbook/countries/saudi-arabia/. Accessed 9 May 2024.