Global Bivariate Meta‐Analysis of FIB‐4 Cut‐Offs to Rule Out Advanced Fibrosis in MASLD
Anuradha Ghosal, Samit Ghosal

TL;DR
This study evaluates the FIB-4 index for detecting liver fibrosis in MASLD and finds that its performance varies by region and threshold.
Contribution
The study provides a global bivariate meta-analysis of FIB-4 thresholds for MASLD, highlighting regional differences in specificity.
Findings
FIB-4 < 1.3 has pooled sensitivity of 0.73 and specificity of 0.69 for ruling out advanced fibrosis.
FIB-4 < 1.0 shows higher specificity (0.83) but lower sensitivity (0.63) compared to the 1.3 threshold.
Indian cohorts showed higher specificity (0.83) than global estimates at the 1.3 threshold.
Abstract
The fibrosis‐4 (FIB‐4) index, a non‐invasive marker, evaluates advanced fibrosis in metabolic dysfunction‐associated steatotic liver disease (MASLD), but the variability in its performance across different populations remains unclear. We conducted a systematic review and bivariate meta‐analysis of 14 studies (N = 5521) with 2 × 2 contingency data for FIB‐4 at thresholds < 1.0 and < 1.3, compared with liver biopsy or transient elastography (TE). The Reitsma model (R v4.4.3) estimated pooled sensitivity and specificity. Subgroup analyses assessed region (India vs. global) and reference standard effects, with heterogeneity and publication bias (Deeks′ test) evaluated. Pooled sensitivity was 0.73 (95% CI: 0.69–0.77), and specificity was 0.69 (95% CI: 0.61–0.76) at < 1.3. The < 1.0 threshold demonstrated higher specificity (0.83, 95% CI: 0.75–0.89) but lower sensitivity (0.63, 95% CI:…
Genes, proteins, chemicals, diseases, species, mutations and cell lines named across the full text — each resolved to its canonical identifier and authoritative record.
Click any figure to enlarge with its caption.
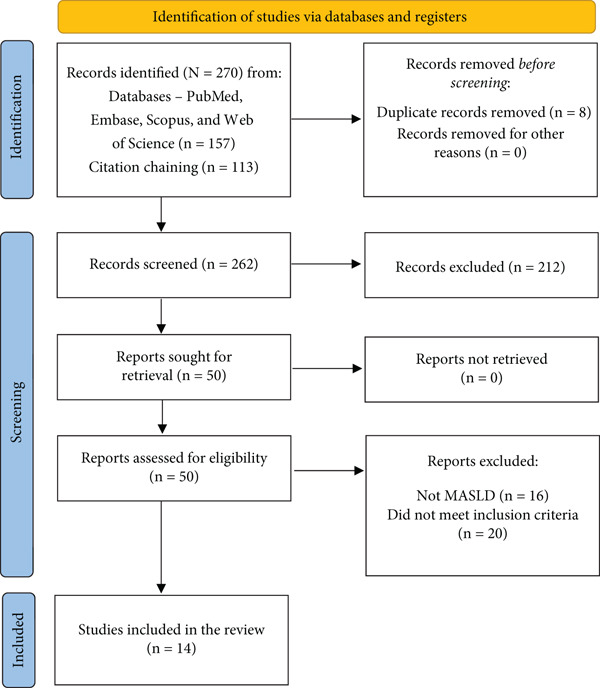 Figure 1
|
|
|
|
|
|
|
|
|
|
|
|
|---|---|---|---|---|---|---|---|---|---|---|
| Chen et al. [ | 278 | Global | < 1.3 | TE | 83 | 7 | 96 | 92 | 0.922 | 0.489 |
| Caussy et al. [ | 459 | Global | < 1.3 | TE | 49 | 11 | 170 | 229 | 0.817 | 0.574 |
| Woodard et al. [ | 400 | Global | < 1.3 | TE | 44 | 16 | 126 | 214 | 0.733 | 0.629 |
| Park et al. [ | 400 | Global | < 1.3 | TE | 71 | 11 | 83 | 235 | 0.866 | 0.739 |
| Kang et al. [ | 400 | Global | < 1.3 | TE | 90 | 7 | 92 | 211 | 0.928 | 0.696 |
| Deb et al. [ | 551 | India | < 1.3 | Histology | 107 | 22 | 85 | 337 | 0.829 | 0.799 |
| Datta et al. [ | 504 | India | < 1.3 | Histology | 64 | 16 | 101 | 323 | 0.8 | 0.762 |
| Dabbah et al. [ | 337 | Global | < 1.3 | Histology | 58 | 19 | 71 | 189 | 0.753 | 0.727 |
| Damnajovska et al. [ | 200 | Global | < 1.3 | Histology | 38 | 11 | 42 | 109 | 0.776 | 0.722 |
| Hoffmann et al. [ | 350 | Global | < 1.3 | Histology | 69 | 23 | 118 | 140 | 0.75 | 0.543 |
| Anstee et al. [ | 799 | Global | < 1.0 | Histology | 138 | 28 | 212 | 421 | 0.831 | 0.665 |
| Ananchuensook et al. [ | 334 | Global | < 1.0 | TE | 59 | 11 | 103 | 161 | 0.843 | 0.61 |
| Naskar et al. [ | 388 | India | < 1.0 | TE | 67 | 14 | 88 | 219 | 0.827 | 0.713 |
| Mathew et al. [ | 121 | India | < 1.3 | Histology | 28 | 7 | 26 | 60 | 0.8 | 0.698 |
Peer Reviews
No public reviews on file for this paper yet. If you reviewed it on a platform where reviews are public (OpenReview, ICLR, NeurIPS, ICML), you can paste yours below so the community can read it here.
Videos
No videos yet. Explain this paper in a talk, walkthrough, or lecture? Add one.
Taxonomy
TopicsLiver Disease Diagnosis and Treatment · Liver physiology and pathology · Liver Diseases and Immunity
1. Introduction
Metabolic dysfunction‐associated steatotic liver disease (MASLD) affects up to one‐third of the global population and is closely linked to metabolic risk factors such as Type 2 diabetes and obesity [1]. The presence of advanced fibrosis (≥F3) in MASLD predicts progression to cirrhosis and hepatocellular carcinoma, emphasising the importance of early and reliable detection [2]. Although liver biopsy remains the gold standard, its invasiveness and susceptibility to sampling errors have led to the increased adoption of non‐invasive tests (NITs) [3].
Among these, the fibrosis‐4 (FIB‐4) index, which is based on age, AST, ALT and platelet count, is widely used because of its low cost and convenience [4]. Typically, a cut‐off of > 1.3 is used to exclude ≥F3, with an upper threshold of > 2.67 indicating a high risk [4]. However, the diagnostic performance of FIB‐4 varies across populations. This variability is likely driven by differences in age (because age is a component of the FIB‐4 formula), the burden and pattern of metabolic risk factors (including Type 2 diabetes, obesity and other cardiometabolic comorbidities), underlying ethnic and regional risk profiles for MASLD and methodological factors such as referral‐centre versus population‐based sampling and the choice of reference standard (liver biopsy vs. transient elastography [TE]). These factors may alter both the pretest probability of ≥F3 and the operating characteristics of FIB‐4, leading to genuine between‐study heterogeneity. The validity of lower cut‐off remains uncertain, especially in high‐risk groups such as individuals with diabetes, where FIB‐4 may be less predictive. Notably, recent Indian studies, including the MISHTI trial, have reported limited concordance between FIB‐4 and TE, raising concerns regarding its clinical utility in local settings [5]. On this basis, we prespecified region (Indian vs. non‐Indian/global cohorts), FIB‐4 cut‐off (< 1.0 vs. < 1.3) and reference standard (histology vs. TE) as potential effect modifiers. The < 1.0 and < 1.3 thresholds were prespecified a priori, informed by existing clinical practice guidelines and previous meta‐analyses. The < 1.3 cut‐off is widely endorsed by AASLD (2023) and EASL (2021) clinical practice guidance as the standard rule out value for ≥F3 in MASLD. A lower < 1.0 threshold has been proposed in recent Asian and younger metabolic cohorts to enhance sensitivity and reduce missed cases in populations with lower pretest probability [6]. Importantly, no post hoc threshold optimisation was performed in this analysis to avoid data‐driven bias. These variables were used as subgroup and meta‐regression covariates to formally assess whether the hypothesised sources of heterogeneity influence the sensitivity and false positive rate (FPR) of FIB‐4 in MASLD.
This systematic review and meta‐analysis aimed to assess the diagnostic accuracy of the FIB‐4 index in detecting ≥F3 in patients with MASLD. It specifically investigates the influence of cut‐off thresholds (< 1.0 vs. < 1.3), regional variations (India vs. global) and reference standards (histology vs. TE). Sensitivity analyses, publication bias evaluation and QUADAS‐2 risk of bias assessment were conducted to guide evidence‐based clinical decisions.
2. Materials and Methods
2.1. Study Design
This systematic review and meta‐analysis adhered to PRISMA 2020 guidelines and was prospectively registered in the PROSPERO database (Registration ID: CRD420251105536) [7].
2.2. PICO Framework
To guide the study selection and synthesis, the PICO framework was applied:
- •Population (P): adults (≥ 18 years) diagnosed with MASLD.
- •Index Test (I): FIB‐4 score with cutoffs of < 1.0 and < 1.3.
- •Comparator (C): reference standards—liver biopsy (histology) or TE.
- •Outcomes (O): diagnostic accuracy metrics for identifying ≥F3, including sensitivity, specificity, area under the curve (AUC) and FPR.
Advanced fibrosis was defined as ≥F3 on histology or the corresponding threshold on TE, consistent with MASLD diagnostic criteria and prior meta‐analytic methodology. For studies using TE as the reference standard, fibrosis staging was based on liver stiffness measurement (LSM) cut‐offs as defined in the original publications. These thresholds varied across studies according to population characteristics and local validation, but generally ranged between approximately 8–10 kPa for ≥F3 and ≥ 12–14 kPa for cirrhosis (F4). The present meta‐analysis did not impose a single LSM cut‐off. Controlled attenuation parameter (CAP) values were not used to define fibrosis stage, as CAP reflects hepatic steatosis rather than fibrosis severity. Stage‐specific performance (e.g., separate F3 vs. F4 estimates) was not analysed because most included studies reported only binary outcomes for advanced versus non‐≥F3 rather than fibrosis‐stage–specific diagnostic accuracy.
3. Literature Search Strategy
A comprehensive search was conducted across PubMed, Embase, Scopus and Web of Science using the following Boolean search terms: (“FIB‐4” OR “Fibrosis‐4”) AND (“NAFLD” OR “MASLD” OR “MAFLD”) AND (“fibrosis” OR “advanced fibrosis”) AND (“diagnostic” OR “performance” OR “accuracy”). Manual screening of the reference lists from relevant articles and reviews was also performed. The PRISMA flow diagram is detailed in Figure 1.
PRISMA flow diagram. Flow diagram of the study selection process, showing 157 records from databases, 113 from citation chaining (Total: 270), eight duplicates removed, 262 screened, 50 full‐text articles assessed and 14 included in the meta‐analysis [6, 8–20].
3.1. Study Selection
Two reviewers (SG and AG) independently screened titles and abstracts, followed by a full‐text review of potentially eligible studies. Discrepancies were resolved through consensus.
3.2. Eligibility Criteria
3.3. Inclusion Criteria
- •Original studies evaluating the FIB‐4 score for the detection of ≥F3 in adults with MASLD.
- •Use of histology or TE as the reference standard.
- •Availability of sufficient data to construct 2 × 2 contingency tables (TP, FP, FN and TN).
- •Use of < 1.0 or < 1.3 as FIB‐4 thresholds.
- •Published in English with full‐text availability.
3.4. Exclusion Criteria
- •Paediatric populations or patients with other chronic liver diseases (e.g., viral hepatitis and alcohol‐related liver disease).
- •Non‐original articles (e.g., reviews and commentaries).
- •Studies with nonstandard FIB‐4 thresholds or duplicated data (excluding less comprehensive datasets).
3.5. Data Extraction and Handling
Two reviewers (SG and AG) independently extracted study‐level data into a structured spreadsheet. Variables included study identifier, country/region, sample size, FIB‐4 cut‐off used, reference standard and diagnostic outcomes (TP, FP, FN and TN). Covariates such as region (India vs. global), reference modality (TE vs. histology) and threshold (< 1.0 vs. < 1.3) were recorded for subgroup and meta‐regression analyses. We extracted 2 × 2 contingency data (true positives [TPs], false positives [FPs], false negatives [FNs] and true negatives [TNs]) to ensure uniform computation of the sensitivity, specificity and FPRs across all studies. Disagreements were resolved through discussion or consultation with the authors when needed. The extracted study characteristics and diagnostic accuracy data are presented in Table 1, with subgroup sample distributions summarised in Table S1.
3.6. Quality Assessment
The study quality and risk of bias were independently assessed by both reviewers using the QUADAS‐2 tool, addressing four domains: patient selection, index test, reference standard and flow/timing. All discrepancies were resolved by consensus.
3.7. Statistical Analysis
Pooled estimates of sensitivity, specificity and AUC were computed using a bivariate random‐effects model (Reitsma et al.) via the mada package in R.
Heterogeneity was assessed using the 95% prediction interval, whereas the proportion of variance attributable to between‐study heterogeneity was quantified using the I^2^ statistic.
Subgroup analyses were conducted for three predefined covariates:
- 1.FIB‐4 threshold (< 1.0 vs. < 1.3),
- 2.Geographic region (India vs. Global),
- 3.Reference standard (histology vs. TE).
These covariates were chosen a priori because they reflect clinical and methodological features that are expected to contribute to between‐study heterogeneity in FIB‐4 performance (age distribution and metabolic risk profile by region and differences in the accuracy of histology vs. TE as reference standards). These thresholds were selected a priori based on established guideline recommendations and prior meta‐analytic evidence. No post hoc threshold optimisation was performed. The biopsy‐versus‐TE comparison was conducted to address potential incorporation bias and assess the stability of performance estimates across reference standards.
Meta‐regression was performed on the logit‐transformed sensitivity and FPR using the metafor package, incorporating study‐level covariates. The standard errors were computed using the delta method.
All analyses were conducted in R (Version 4.x) using validated statistical packages, with significance defined as p < 0.05.
4. Risk of Bias and Applicability Assessment
The risk of bias was evaluated using QUADAS‐2, which assesses four domains: patient selection, index test (FIB‐4), reference standard (biopsy/TE) and flow and timing. Each domain was rated as low, high or some concerns; an overall judgement was made based on the highest risk across the domains. Two reviewers conducted the assessments, and the results are shown in Figure S1. All included studies contributed to the primary pooled analysis regardless of risk‐of‐bias rating; study quality was not used as an exclusion criterion but was evaluated to contextualise the robustness of the findings.
5. Statistical Analysis
The bivariate Reitsma model was used to estimate pooled sensitivity, specificity and the summary receiver operating characteristic (SROC) AUC, implemented using the mada package in R [21]. Heterogeneity was quantified using 95% prediction intervals. Subgroup analyses were stratified by region (India vs. Global), FIB‐4 cut‐off (<1.0 vs. <1.3) and reference standard (histology vs. TE). Meta‐regression was performed on logit‐transformed sensitivity and FPR using the metafor package, with variances estimated from binomial approximations [22]. Publication bias was assessed using Deeks’ funnel plot asymmetry test (log diagnostic odds ratio vs. 1/√effective sample size; p < 0.10 indicating asymmetry). Sensitivity analyses excluded small studies (N < 300), non‐< 1.3 cut‐offs and Indian cohorts. Forest plots of sensitivity and specificity were generated using the meta package, and SROC curves were visualised using ggplot2 [23, 24].
6. Results
6.1. Study Characteristics
Fourteen studies (N = 5521) were included, comprising 11 global and three Indian cohorts. The studies used either histology (n = 6) or TE (n = 8) as reference standards. The FIB‐4 cut‐off values were < 1.3 (n = 11) and < 1.0 (n = 3). Of the 5521 participants included, 2741 were evaluated against liver biopsy reference standards and 2780 against TE. Across FIB‐4 threshold analyses, 1021 participants were assessed using the < 1.0 cut‐off and 4500 using the < 1.3. Within TE‐based studies, 885 participants applied < 1.0 and 1895 applied < 1.3, whereas in biopsy‐confirmed cohorts, 136 applied < 1.0 and 3605 applied < 1.3. Table 1 summarises the study characteristics and diagnostic data. Detailed subgroup sample distributions by reference standard and cut‐off thresholds are provided in Table S1 to support transparency of weighting across analyses.
The proportion of cirrhosis (F4 fibrosis) could not be reported at the individual study level because the majority of included studies did not provide fibrosis‐stage–specific distributions (F3 vs. F4), instead reporting ≥F3 as a binary outcome.
6.2. Risk of Bias and Applicability
Risk of bias assessment using QUADAS‐2 is shown in Figure S1 (traffic light plot). Most studies had a low risk for the index test (12 out of 14 studies) but patient selection carried high or some concerns in 6 out of 14 studies due to referral‐centre cohorts. The TE‐based reference standards are associated with operator‐dependent variability. Flow and timing were low risk in 10 of 14 studies. Overall, three studies were high risk, 10 had some concerns and one had a low risk.
6.3. Overall Diagnostic Performance
The pooled sensitivity and specificity of FIB‐4 were 0.821 (95% CI: 0.761–0.871) and 0.619 (95% CI: 0.537–0.695), respectively. All pooled estimates reflect detection of advanced fibrosis defined as ≥F3. The SROC AUC was 0.836. Heterogeneity was evident, with prediction intervals for sensitivity ranging from 0.57 to 0.96 and for FPR from 0.21 to 0.49. The combined forest and SROC plots are shown in Figure 2. Differences in total participant numbers across stratified subgroup analyses reflect that not all studies contributed data to both threshold comparisons or both reference standards, rather than variation in overall study inclusion.
Figure 2. Forest plots and summary ROC for the diagnostic performance of FIB‐4 in detecting advanced fibrosis (≥F3) in MASLD. (a) Forest plot of specificity with 95% confidence and prediction intervals; (b) Forest plot of sensitivity with 95% confidence and prediction intervals; (c) SROC curve generated using the Reitsma bivariate random‐effects model, with individual study estimates indicated by red points, and the confidence and prediction regions shown around the pooled curve. Histology‐based and TE‐based reference standards contribute separately to the pooled estimates as outlined in subgroup analyses.(a)(b)(c)
6.4. Subgroup Analyses
Subgroup sample sizes varied across categories due to differences in reporting between thresholds and reference standards (Table S3 provides full details).
- •By region: Indian studies (n = 3) had a sensitivity of 0.820 (95% CI: 0.771–0.860), specificity of 0.760 (95% CI: 0.709–0.804) and AUC of 0.824. Global studies (n = 11): sensitivity 0.822 (95% CI: 0.778–0.860), specificity 0.636 (95% CI: 0.586–0.683) and AUC 0.798. These estimates should be interpreted cautiously due to the small number of Indian studies (n = 3), which may contribute to statistical instability and sampling imbalance in regional comparisons.
- •By cut‐off: < 1.3 (n = 11): sensitivity 0.835 (95% CI: 0.792–0.870), specificity 0.642 (95% CI: 0.579–0.701) and AUC 0.822. < 1.0 (n = 3): sensitivity 0.743 (95% CI: 0.634–0.832), specificity 0.678 (95% CI: 0.565–0.775) and AUC 0.783.
- •By reference standard: Histology (n = 6): sensitivity 0.798, specificity 0.707 and AUC 0.816. TE (n = 8): sensitivity 0.845; specificity 0.631 and AUC 0.809.
Meta‐regression did not show any significant effect of region (p = 0.894), reference standard (p = 0.064) or FIB‐4 cut‐off (p = 0.852) on sensitivity. For FPR, there was a nonsignificant trend toward lower FPRs in Indian cohorts (p = 0.062), although this finding did not reach statistical significance and should be interpreted cautiously. The reference standard and cut‐off values did not significantly influence FPR (p = 0.385 and p = 0.848, respectively). The meta‐regression results are presented in Table S2.
6.5. Publication Bias
Deeks′ funnel plot asymmetry test showed no significant bias (unweighted p = 0.5503 and weighted p = 0.4901). A funnel plot is shown in Figure S2.
6.6. Sensitivity Analyses
- •Excluding small studies (N < 300 and n = 2), the pooled sensitivity was 0.818 (95% CI: 0.773–0.855), specificity was 0.665 (95% CI: 0.602–0.723) and AUC was 0.821.
- •Excluding < 1.0 cut‐off studies (n = 3): summary estimates matched < 1.3 subgroup: sensitivity 0.818, specificity 0.665 and AUC 0.821.
- •Excluding Indian studies (n = 3), the sensitivity was 0.822 (95% CI: 0.778–0.860), specificity was 0.636 (95% CI: 0.586–0.683) and AUC was 0.798.
The sensitivity analysis results for the pooled diagnostic sensitivity and specificity are summarised in Table S3. These results provide the basis for the subsequent interpretation of clinical relevance and implications, which are discussed below.
7. Discussion
7.1. Current Understanding
Non‐invasive fibrosis scoring tools, such as the FIB‐4 index, are recommended for initial risk assessment in MASLD, providing a practical alternative to liver biopsy. [3, 4] The FIB‐4 index′s simplicity and affordability have contributed to its widespread use, although its diagnostic accuracy varies across different populations and settings [5, 25].
7.2. What This Meta‐Analysis Adds
This systematic review, analysing 14 studies (N = 5521), synthesises FIB‐4′s performance for ruling out ≥F3 in MASLD using histology and TE. Pooled sensitivity (0.73) and specificity (0.69) at < 1.3, with an SROC AUC of 0.836, support its utility as a rule‐out test. Indian cohorts (n = 3) showed higher specificity (0.83) than the global average (0.66), with similar sensitivity (0.73–0.74), suggesting regional influences. Regional differences observed in subgroup analyses should be considered exploratory because only three Indian studies were available. This limited sample may exaggerate apparent differences and restrict generalisability, highlighting the need for larger, high‐quality Indian cohorts. The < 1.3 cut‐off demonstrated superior overall diagnostic performance and remains the preferred rule‐out threshold. The discussion of a lower threshold (< 1.0) in Indian settings reflects pragmatic considerations in selected populations—such as lower pretest probability of ≥F3 and health‐system constraints—rather than evidence of superior diagnostic performance. Our findings align with previous Asian cohort studies supporting the potential value of < 1.0 in populations with lower pretest probability of ≥F3, while confirming the established performance of <1.3 as the standard rule‐out threshold in broader MASLD settings. The observed regional variation in FPRs (p = 0.062) should be considered exploratory and hypothesis‐generating rather than confirmatory, given that it did not reach statistical significance.
7.3. Strengths
- •Incorporating diverse reference standards (histology and TE) improves generalizability.
- •Bivariate meta‐analysis with 2 × 2 data ensures robust pooling.
- •Subgroup analyses clarify regional and cut‐off effects.
- •Prediction intervals offer a nuanced assessment of heterogeneity.
7.4. Limitations
- •Heterogeneity from different reference standards and settings may influence results.
- •The small Indian sample (n = 3) limits regional conclusions. As a result, the regional comparison may primarily reflect sampling imbalance rather than true population‐level performance differences.
- •Stage‐specific performance for distinguishing F3 from F4 could not be analysed because most included studies did not report separate diagnostic accuracy metrics by fibrosis stage. Future studies should evaluate stage‐stratified accuracy to better understand clinical utility in advanced versus cirrhotic disease.
- •Moderate to high QUADAS‐2 bias risks (e.g., patient selection) suggest exercising caution. Although only six studies were judged to be at low risk of bias, sensitivity analyses showed that the overall diagnostic estimates remained stable, supporting the robustness of the conclusions.
- •Focusing on rule‐out ability excludes consideration of positive predictive value and cost‐effectiveness.
- •Performance in subgroups such as diabetics or the elderly was not examined.
- •A key methodological limitation is incorporation bias due to the inclusion of TE‐based reference standards, which have lower diagnostic accuracy than liver biopsy. Although biopsy remains the gold standard, TE is increasingly used in routine clinical decision‐making, particularly where biopsy is not feasible. To mitigate this bias, we performed stratified subgroup analyses by reference standard, demonstrating comparable diagnostic performance patterns across biopsy and TE cohorts. Nonetheless, estimates within TE‐based studies may overestimate sensitivity and underestimate FPRs relative to biopsy‐verified disease, and results should therefore be interpreted cautiously.
7.5. Clinical implications
From a clinical perspective, these findings reinforce the role of FIB‐4 < 1.3 as a practical rule‐out tool for ≥F3 in MASLD, especially in primary and secondary care settings where biopsy or elastography may not be readily available. This should not be interpreted as a recommendation to replace the < 1.3 threshold but rather as a context‐specific adaptation in selected settings. Applying a lower threshold (< 1.0) may be considered in selected populations with lower pretest probability, such as younger metabolic cohorts or regions with lower MASLD prevalence. In practice, patients above the rule‐out threshold should be triaged to further assessment with imaging‐based elastography or liver biopsy, enabling more resource‐efficient risk stratification. Future research incorporating stage‐specific accuracy and prospective head‐to‐head comparisons across ethnic cohorts will help refine optimal cut‐off selection and enhance real‐world implementation.
8. Conclusion
This meta‐analysis demonstrates that the FIB‐4 index, using a threshold of < 1.3, is a reliable and pragmatic first‐line tool for ruling out ≥F3 in MASLD, with consistent diagnostic performance across diverse cohorts. Although Indian studies showed higher specificity, sensitivity remained comparable with global cohorts, and these regional differences should be interpreted cautiously given the limited number of Indian studies. Although a lower threshold (< 1.0) offers higher specificity at the cost of reduced sensitivity and may be considered in selected clinical contexts, it does not outperform the < 1.3 threshold overall. Accordingly, FIB‐4 < 1.3 should remain the default rule‐out strategy, with sequential testing using TE reserved for patients above this threshold to optimise diagnostic accuracy and resource utilisation.
Ethics Statement
The authors have nothing to report.
Conflicts of Interest
The authors declare no conflicts of interest.
Author Contributions
S.G. conceptualised the study and performed statistical analysis. S.G. and A.G. conducted the literature search. A.G. drafted the manuscript, which was reviewed and verified for accuracy by S.G.
Funding
No funding was received for this manuscript.
Supporting information
Supporting Information Additional supporting information can be found online in the Supporting Information section. Figure S1: QUADAS‐2 risk of bias assessment (a) Summary plot and (b) traffic light plot. Figure S2: Deeks′ funnel plot asymmetry test for publication bias in studies evaluating the diagnostic performance of FIB‐4 for advanced fibrosis. Table S1: Meta‐regression results evaluating the impact of moderator variables on sensitivity and false positive rate (FPR). Table S2: Pooled sensitivity and specificity estimates for FIB‐4 in detecting advanced fibrosis across sensitivity analyses. Table S3: Pooled sensitivity and specificity estimates for FIB‐4 in detecting advanced fibrosis across sensitivity analyses.
The reference list from the paper itself. Each links out to its DOI / PubMed record.
- 1Chan W. K. , Chuah K. H. , Rajaram R. B. , Lim L. L. , Ratnasingam J. , and Vethakkan S. R. , Metabolic Dysfunction-Associated Steatotic Liver Disease (MASLD): A State-of-the-Art Review, Journal of Obesity & Metabolic Syndrome. (2023) 32, no. 3, 197–213, 10.7570/jomes 23052, 37700494.37700494 PMC 10583766 · doi ↗ · pubmed ↗
- 2Lekakis V. and Papatheodoridis G. V. , Natural History of Metabolic Dysfunction-Associated Steatotic Liver Disease, European Journal of Internal Medicine. (2024) 122, 3–10, 10.1016/j.ejim.2023.11.005.37940495 · doi ↗ · pubmed ↗
- 3Frączek J. , Sowa A. , Agopsowicz P. , Migacz M. , Dylińska-Kala K. , and Holecki M. , Non-Invasive Tests as a Replacement for Liver Biopsy in the Assessment of MASLD, Medicina. (2025) 61, no. 4, 10.3390/medicina 61040736.PMC 1202873940283027 · doi ↗ · pubmed ↗
- 4European Association for the Study of the Liver (EASL) , European Association for the Study of Diabetes (EASD) , and European Association for the Study of Obesity (EASO) , EASL-EASD-EASO Clinical Practice Guidelines on the Management of Metabolic Dysfunction-Associated Steatotic Liver Disease (MASLD), Journal of Hepatology. (2024) 81, no. 3, 492–542, 10.1016/j.jhep.2024.04.031.38851997 · doi ↗ · pubmed ↗
- 5Datta D. , Seshadri K. G. , and Ghosal S. , MISHTI Study Evaluating Hepatic Fibrosis in Type 2 Diabetes Patients in India, Scientific Reports. (2025) 15, no. 1, 10.1038/s 41598-025-10871-9, 40634664.PMC 1224156840634664 · doi ↗ · pubmed ↗
- 6Duseja A. , Singh S. P. , De A. , Madan K. , Rao P. N. , Shukla A. et al., Indian National Association for Study of the Liver (INASL) Guidance Paper on Nomenclature, Diagnosis and Treatment of Nonalcoholic Fatty Liver Disease (NAFLD), Journal of Clinical and Experimental Hepatology. (2023) 13, no. 2, 273–302, 10.1016/j.jceh.2022.36950481 PMC 10025685 · doi ↗ · pubmed ↗
- 7SAMIT GHOSAL, Anuradha Ghosal , Global Bivariate Meta-Analysis of FIB-4 Cut-Offs to Rule Out Advanced Fibrosis in MASLD. PROSPERO 2025 CRD 420251105536, https://www.crd.york.ac.uk/PROSPERO/view/CRD 420251105536.
- 8Chen M. , Guo C. , Ouyang K. , and Liu N. , Diagnostic Role of the Fibrosis-4 Index and Nonalcoholic Fatty Liver Disease Fibrosis Score as a Noninvasive Tool for Liver Fibrosis Scoring, Medicine. (2024) 103, no. 43, e 40214, 10.1097/MD.0000000000040214.39470560 PMC 11521016 · doi ↗ · pubmed ↗