Genomic Structural Equation Modeling Combined With Post‐GWAS Analysis Identifies Two Risk Gene Loci and Functionally Sensitive Genes Associated With Cardiac Conduction Block
Tongyu Wang, Xinge Miao, Yunlong Xia

TL;DR
This study identifies new genetic loci and genes linked to cardiac conduction disorders, offering potential biomarkers for better diagnosis and treatment.
Contribution
The study introduces a novel genomic SEM approach combined with post-GWAS methods to discover new risk loci and functionally sensitive genes for cardiac conduction disorders.
Findings
The SNP rs112720315 is a novel genetic locus significantly associated with cardiac conduction disorders.
Five genes (CCDC141, SCN10A, SH3PXD2A, FKBP7, and ESR2) are identified as potential biomarkers for a wide spectrum of CCDs.
The APOL1 gene is specifically linked to CCD risk in individuals of African ancestry.
Abstract
Cardiac conduction disorders (CCDs) represent a broad spectrum of severe cardiovascular conditions associated with syncope and sudden cardiac death. Therefore, identification of reliable biomarkers is necessary to significantly improve the diagnostic accuracy and therapeutic outcomes of CCDs. This study analyzed GWAS summary datasets using a genomic structural equation model (Genomic‐SEM), fine mapping, linkage disequilibrium score regression (LDSC), and two‐sample Mendelian randomization (TSMR) analyses to identify genetic loci and genes associated with CCDs. GWAS summary datasets of European subjects were obtained from the GWAS Catalog and FinnGen databases. The GenomicSEM R package was used to construct a structural equation model to identify common latent factors influencing CCD progression. The Functional Mapping and Annotation of Genome‐Wide Association Studies (FUMA) platform…
Genes, proteins, chemicals, diseases, species, mutations and cell lines named across the full text — each resolved to its canonical identifier and authoritative record.
Click any figure to enlarge with its caption.
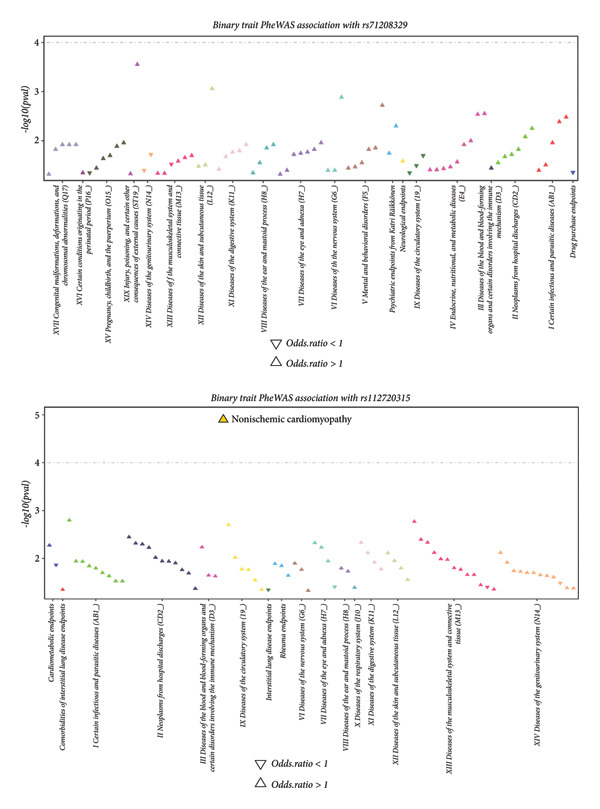 Figure 4
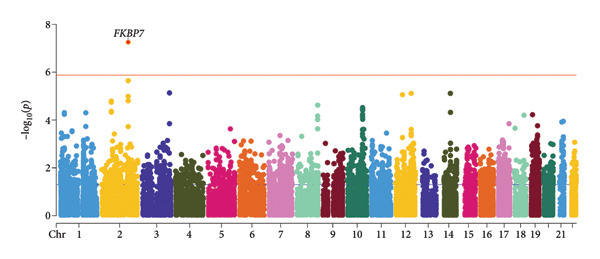 Figure 5
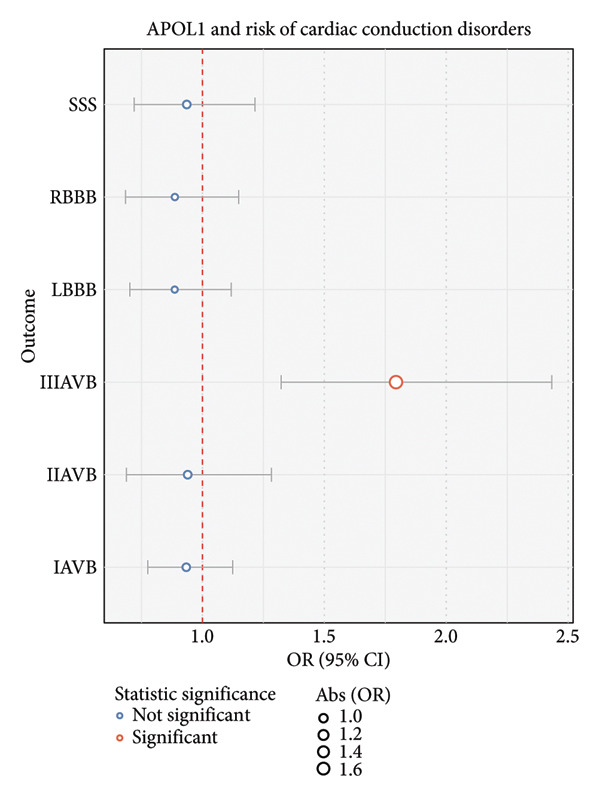 Figure 7
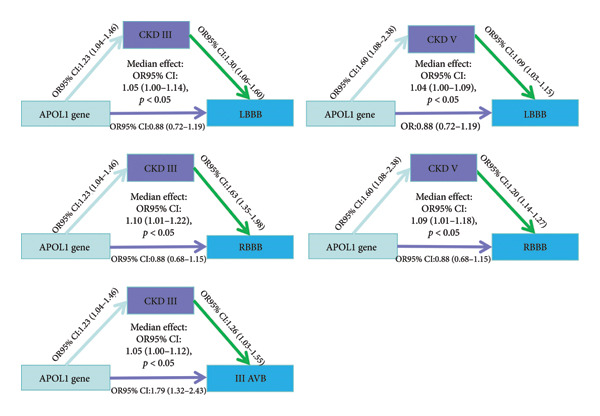 Figure 8
| Accession no. | Ancestry | Cases | Controls | Sample size | Ratio | Imputation panel | Source | λGC | NSNP | Definition |
|---|---|---|---|---|---|---|---|---|---|---|
| GCST90475955 | European | 2012 | 447,369 | 449,381 | 0.0044 | 1000 Genomes Project | GWAS Catalog | 1.0288 | 1,173,070 | Second‐degree AV block |
| GCST90477911 | European | 6274 | 443,107 | 449,381 | 0.0139 | 1000 Genomes Project | GWAS Catalog | 1.0606 | 1,173,072 | Atrioventricular block, complete |
| GCST90475980 | European | 6431 | 439,404 | 445,835 | 0.0144 | 1000 Genomes Project | GWAS Catalog | 1.0767 | 1,173,071 | Sinoatrial node dysfunction (bradycardia) |
| GCST90475954 | European | 6072 | 435,543 | 441,615 | 0.0137 | 1000 Genomes Project | GWAS Catalog | 1.0784 | 1,173,067 | First‐degree AV block |
| I9_LBBB | European | 2766 | 375,343 | 378,109 | 0.0073 | SISu v4.2 | FinnGen | 1.059 | 1,159,470 | Left bundle branch block |
| I9_RBBB | European | 1347 | 375,343 | 376,690 | 0.0035 | SISu v4.2 | FinnGen | 1.0291 | 1,159,466 | Right bundle branch block |
| Lhs | Op | Rhs | Unstandardized_estimate | Unstandardized_SE | Standardized_Est | Standardized_SE |
|
|---|---|---|---|---|---|---|---|
| F1 | =∼ | SSS | 0.17 | 0.023 | 0.68 | 0.092 | 2.18 |
| F1 | =∼ | IAVB | 0.16 | 0.03 | 0.63 | 0.11 | 2.78 |
| F1 | =∼ | IIAVB | 0.27 | 0.04 | 0.97 | 0.14 | 3.64 |
| F1 | =∼ | IIIAVB | 0.25 | 0.029 | 0.93 | 0.10 | 2.44 |
| F1 | =∼ | LBBB | −0.09 | 0.037 | −0.29 | 0.11 | 0.0098 |
| F1 | =∼ | RBBB | −0.21 | 0.049 | −0.73 | 0.16 | 1.19 |
| SSS | ∼∼ | SSS | 0.03 | 0.011 | 0.53 | 0.17 | 0.0021 |
| IAVB | ∼∼ | IAVB | 0.040 | 0.013 | 0.59 | 0.18 | 0.0017 |
| IIAVB | ∼∼ | IIAVB | 0.003 | 0.026 | 0.045 | 0.33 | 0.89 |
| IIIAVB | ∼∼ | IIIAVB | 0.01 | 0.014 | 0.13 | 0.18 | 0.47 |
| LBBB | ∼∼ | LBBB | 0.097 | 0.025 | 0.91 | 0.23 | 0.00010 |
| RBBB | ∼∼ | RBBB | 0.039 | 0.044 | 0.46 | 0.51 | 0.37 |
| Panel | ID | CHR | P0 | P1 | Best.GWAS.ID | eQTL.ID | eQTL.R2 | eQTL.Z | eQTL.GWAS.Z | NSNP | TWAS.Z | TWAS.P | FDR | Pips |
|---|---|---|---|---|---|---|---|---|---|---|---|---|---|---|
| Heart_Atrial_Appendage | FKBP7 | 2 | 178,478,599 | 178,478,600 | rs13019119 | rs13411588 | 0.12 | 6.7 | 3.55 | 464 | 3.4 | 0.000473 | 0.17 | 0.71 |
| Heart_Left_Ventricle | FKBP7 | 2 | 178,478,599 | 178,478,600 | rs13019119 | rs13411588 | 0.13 | 6.85 | 3.55 | 463 | 3.5 | 0.000378 | 0.15 | 0.052 |
| Accession no. | Ancestry | Cases | Controls | Sample size | Ratio | Imputation panel | Source | λGC | NSNP | Definition |
|---|---|---|---|---|---|---|---|---|---|---|
| GCST90477908 | African | 1415 | 118,304 | 119,719 | 0.011 | 1000 Genomes Project | GWAS Catalog | 1.0269 | 1,159,809 | IAVB |
| GCST90477909 | African | 536 | 120,832 | 121,368 | 0.004 | 1000 Genomes Project | GWAS Catalog | 1.0155 | 1,159,804 | IIAVB |
| GCST90477910 | African | 856 | 120,644 | 121,500 | 0.007 | 1000 Genomes Project | GWAS Catalog | 1.0033 | 1,159,807 | IIIAVB |
| GCST90477917 | African | 879 | 119,623 | 120,502 | 0.007 | 1000 Genomes Project | GWAS Catalog | 0.9972 | 1,159,800 | LBBB |
| GCST90477916 | African | 1024 | 119,414 | 120,438 | 0.008 | 1000 Genomes Project | GWAS Catalog | 1.0098 | 1,159,793 | RBBB |
| GCST90477950 | African | 695 | 120,312 | 121,007 | 0.005 | 1000 Genomes Project | GWAS Catalog | 1.0051 | 1,159,801 | SSS |
| Lhs | Op | Rhs | Unstandardized_estimate | Unstandardized_SE | Standardized_est | Standardized_SE |
|
|---|---|---|---|---|---|---|---|
| F1 | =∼ | IAVB | 0.20 | 0.08 | 0.71 | 0.28 | 0.012 |
| F1 | =∼ | IIAVB | 0.16 | 0.10 | 0.37 | 0.23 | 0.11 |
| F1 | =∼ | IIIAVB | 0.24 | 0.09 | 0.93 | 0.35 | 0.009 |
| F1 | =∼ | LBBB | −0.043 | 0.08 | −0.68 | 1.30 | 0.60 |
| F1 | =∼ | RBBB | 0.34 | 0.13 | 1.07 | 0.40 | 0.008 |
| F1 | =∼ | SSS | 0.052 | 0.08 | 0.2 | 0.46 | 0.54 |
| IAVB | ∼∼ | IAVB | 0.039 | 0.04 | 0.49 | 0.50 | 0.33 |
| IIAVB | ∼∼ | IIAVB | 0.17 | 0.061 | 0.86 | 0.33 | 0.009 |
| IIIAVB | ∼∼ | IIIAVB | 0.009 | 0.06 | 0.13 | 0.94 | 0.88 |
| LBBB | ∼∼ | LBBB | 0.002 | 0.06 | 0.53 | 15.22 | 0.97 |
| RBBB | ∼∼ | RBBB | −0.016 | 0.09 | −0.15 | 0.88 | 0.85 |
| SSS | ∼∼ | SSS | 0.031 | 0.06 | 0.91 | 1.82 | 0.61 |
| Phenotype | Accession number | Number of cases | Number of controls | Ancestry |
|---|---|---|---|---|
| Stage I ∼ II CKD | GCST90478531 | 5454 | 112,018 | African |
| Stage III CKD | GCST90476127 | 13,744 | 104,364 | African |
| Stage IV CKD | GCST90476129 | 4501 | 116,141 | African |
| End‐stage renal disease | GCST90476125 | 4335 | 116,698 | African |
- —Liaoning Revitalization Talents Program10.13039/501100018617
- —National Key Research and Development Program of China10.13039/501100012166
Peer Reviews
No public reviews on file for this paper yet. If you reviewed it on a platform where reviews are public (OpenReview, ICLR, NeurIPS, ICML), you can paste yours below so the community can read it here.
Videos
No videos yet. Explain this paper in a talk, walkthrough, or lecture? Add one.
Taxonomy
TopicsGenetic Associations and Epidemiology · Cardiac electrophysiology and arrhythmias · Congenital heart defects research
1. Background
Cardiac conduction disorders (CCDs) are a group of clinical conditions characterized by disruptions in the normal cardiac depolarization, leading to bradycardia [1]. Clinical presentation of CCDs varies widely, from asymptomatic cases detected incidentally on electrocardiograms (ECGs) to severe cases causing syncope, heart failure, or sudden cardiac death [2]. Clinically important CCDs include sick sinus syndrome (SSS), atrioventricular block (AVB), left bundle branch block (BBB) (LBBB), and right BBB (RBBB). Each type of conduction disorder results from different levels of damage to the conduction system. For example, AVB derives from a block in the His bundle or AV node. LBBB and RBBB derive from damage to the distal His bundle area. Epidemiological studies have demonstrated that prolonged PR intervals and RBBB are significantly associated with an increased risk of cardiovascular disease (CVD) mortality [3, 4]. Twenty percent of individuals in a recent multicenter cohort study involving 189,163 samples were diagnosed with a conduction disorder at baseline, and over 6% of the study sample developed a new conduction disorder over 10 years of follow‐up [5].
The pathogenesis of CCDs involves the loss of nonrenewable cardiomyocytes during the aging process [6, 7]. Moreover, animal studies have demonstrated that dysregulation of calcium‐handling proteins impairs atrioventricular node conduction by disrupting Ca^2+^ homeostasis in the endoplasmic reticulum [8, 9]. Mutations in the connexin 45 gene cause progressive AVB [10]. Purkinje cell (PC) dysfunction also contributes to intraventricular conduction disorders and heart failure. Nav1.5 α‐subunit (SCN5A) gene mutation is related to His‐Purkinje conduction disease and cellular hyperexcitability [11]. Cx43 polymorphism is associated with increased risk of developing LBBB [12]. Epigenetic markers also contribute to the pathogenesis of sinoatrial node (SAN) dysfunction. The expression of miR‐486‐3p is significantly lower in normal SAN tissue than in nonpacemaker atrial muscle tissue, and miR‐486‐3p is involved in the regulation of HCN4 expression [13]. Human HF hearts exhibit elevated miR‐486‐3p expression in the SAN [14].
Currently, specific circulating biomarkers to definitively predict the risk of CCDs and guide intervention strategies are unavailable. Furthermore, different types of conduction disorders can be explained by common mechanisms, such as conduction system dysfunction. The genomic structural equation model (Genomic‐SEM) uses published CCD GWAS data to create a new GWAS summary dataset. This helps explain latent confounding factors for diseases and speeds up the discovery of new genetic loci for CCDs. Unlike traditional GWAS meta‐analysis, Genomic‐SEM considers causal relationships and correlations among multiple traits. MTAG, however, only enhances the significance of single genetic loci via correlation between two traits and cannot handle complex frameworks [15]. We used multiple methods, including fine mapping, Phenome‐Wide Association Study (PheWAS), Transcriptome‐Wide Association Study (TWAS), Functional Mapping and Annotation of Genome‐Wide Association Studies (FUMA), and Functional Summary Statistics (FOCUS), to determine the associations between CCDs and genetic markers. Linkage disequilibrium (LD) score regression (LDSC) and two‐sample Mendelian randomization (TSMR) were performed to determine causal relationships between the candidate risk genes and specific CCDs. The overall aim was to discover potential clinical biomarkers as therapeutic targets and identify biomarkers that predict broad‐spectrum CCD risk.
2. Methods
2.1. Source and Genomic Parameters of GWAS Summary Data
We analyzed GWAS summary‐level data for CCDs in a European ancestry population. The database construction methods and quality control parameters are shown in Table 1.
2.2. Genomic Structural Equation Modeling Analysis
The GenomicSEM R package (v.0.0.5) was used to construct a Genomic‐SEM to investigate the broad genetic susceptibility underlying CCDs such as SSS, IAVB, IIAVB, IIIAVB, LBBB, and RBBB. Genomic‐SEM is a multivariate method that evaluates genetic relationships between multiple traits simultaneously and demonstrates robustness against biases due to sample overlap or unequal sample sizes. It also distinguishes genetic variants affecting specific trait subsets from those influencing cross‐trait susceptibility. This analysis used a two‐stage approach, wherein the empirical genetic covariance matrix and its sampling covariance matrix were first analyzed, followed by model fitting. We constructed the model based on a hypothesis that conduction disorders can be explained by one common latent factor.
A multivariate cross‐trait LD score regression analysis was performed, and an empirical genetic covariance matrix for six traits was generated as inputs for the SEM common factor model. Discrepancy between the empirical matrix and the hypothesized covariance structure was minimized using structural equation modeling. This study specifically investigated the genetic architecture underlying the six CCD traits and evaluated a single‐factor model. Subsequently, we evaluated the model fit using the standardized root‐mean‐square residual (SRMR), χ^2^ statistic, Akaike information criterion (AIC), and comparative fit index (CFI). The χ^2^ statistic assessed the discrepancy between the genetic covariance matrix and the empirical covariance matrix. The AIC balanced the model fit and complexity for model selection and was used to compare models. SRMR quantified the standardized residuals between predicted and observed values, with values below 0.08 suggesting a good fit. The CFI compared the model to a perfect fit, with values closer to 1 indicating a better fit.
2.3. Identifying Genomic Loci and Novel Variants Associated With CCDs
The FUMA platform is a valuable tool for identifying genomic loci and lead single‐nucleotide polymorphisms (SNPs) linked with the CCDs [16]. Lead SNPs were defined as variants with a genome‐wide significance of p < 5 × 10^−8^ and a low LD of r ^2^ < 0.1. Genomic‐SEM was used to assess the strength of association of potential risk SNPs with CCDs by integrating summary statistics from GWAS. These lead SNPs and loci were then compared against those identified in the original univariate GWAS. SNPs demonstrating greater significance in the Genomic‐SEM than in the individual univariate GWAS analysis were considered novel genetic loci. Furthermore, MAGMA (v1.08) functions in the FUMA website were also used to expand genes associated with conduction disorders, and genes with adjusted Bonferroni p‐value < 0.05 were selected.
2.4. Fine Mapping to Identify Causal SNPs
Fine‐mapping methods, such as Sum of Single Effects (SuSIE) and FINEMAP, from the R package echolocatoR (v. 2.0.3), were used to identify the most probable causal variants in the GWAS analysis. A probability threshold of 0.95 was used to identify credible sets of potential causal variants. Both SuSIE and FINEMAP are statistical fine‐mapping methods used to identify specific genetic variants that are most likely responsible for the observed phenotype [17]. A 250‐kb region around each lead SNP was selected to capture potentially associated variants. Then, the posterior inclusion probability (PIP) was calculated for all the SNPs within these intervals. Genetic variants with PIP > 0.95 were classified as probable causal variants.
2.5. TWAS
After identifying potential causal variants, a TWAS was performed to detect genes associated with CCDs based on their expression–phenotype relationships. The FOCUS (v0.802) method was used to assess causal gene–phenotype relationships by calculating PIP values. The FUSION method was used to evaluate these associations using precomputed mixed tissue panels’ expression quantitative trait loci (eQTL) weights from GTEx v8, which included 37,920 gene–tissue pairs [18]. Weight panels are developed based on expression–phenotype associations across multiple genes and types of tissue mixtures and were used for the exploratory identification of associated genes. Moreover, to confirm the results from the mixture panels, we also used left ventricle and atrial appendage weights from GTEx v8.
Weight panels can be found at the following website: https://gusevlab.org/projects/fusion/#gtex-cross-tissue-scca-expression.
2.6. LDSC Analysis
LDSC is used to estimate genetic correlations from GWAS summary statistics by quantifying conserved genetic effects between quantitative traits. The LDSC manual outlines intercept and heritability as key GWAS quality check metrics. Intercept, aiming for a value of 1, detects potential confounding factors. Heritability (h2) quantifies the proportion of trait variation explained by common genetic variants. Genetic correlation (r _ g _) was calculated using the R package “ldscr (v0.1.0)” [19].
2.7. TSMR Analysis
The causal relationship between genetic markers and abnormal conduction on an ECG was explored through TSMR analysis. eQTL data were derived from the eQTLGen database and included results of testing blood samples from 31,684 individuals, encompassing 16,989 gene eQTL loci. This approach ensured compliance with the following core assumptions of Mendelian randomization analysis: (i) SNPs have a strong correlation; (ii) SNPs are independent of confounders; and (iii) SNPs have no effect on outcome [20]. We filtered exposure datasets by retaining variants with a p‐value of < 5e − 8 and F < 10, removing SNPs showing LD using clumping parameters of 10,000 kb window size and r^2^threshold of 0.6. For the outcome datasets, SNPs with p < 5e − 8 were excluded to minimize direct effects on the outcomes. Egger’s regression was used to determine whether the instrumental variable had horizontal pleiotropy. At the core, we evaluated whether the intercept significantly deviated from zero using regression analysis. We used the Steiger directionality test to verify the directionality of causal relationships. The basic logic involves determining the causal direction by comparing the correlation between SNPs and exposures, as well as between the instrumental variable and the outcome. The Mendelian randomization analysis was conducted using the “TwoSampleMR (v 0.6.2)” package in R, and both random‐effects inverse‐variance weighted (IVW) and Wald ratio methods were used to estimate causal effects between exposures and outcomes. Regarding the median analysis, the median effect was evaluated using the “RMediation (v 1.2.2)” package using the “medic” function.
3. Results
3.1. Quality Control Parameters for GWAS Summary Data and the Genomic‐SEM
Based on the LDSC analysis, the heritability estimates (h ^2^) for the six GWAS traits were as follows: SSS (0.006 ± 0.0012), IAVB (0.0059 ± 0.0012), IIAVB (0.0019 ± 0.0011), IIIAVB (0.0061 ± 0.001), LBBB (0.006 ± 0.0014), and RBBB (0.0027 ± 0.0014). Genetic covariance values between traits are shown in Figure 1(a). Our data showed positive genetic correlations between AVBs and infra‐His bundle conduction disorders, such as LBBB and RBBB. SSS exhibits a positive correlation with AVB and a negative correlation with BBBs. BBBs demonstrate negative correlations with AVBs. Subsequently, a Genomic‐SEM was constructed using the configuration shown in Figure 1(b).
Figure 1(a) Correlation plot of the LD score regression analysis shows associations between distinct types of conduction disorders. (b) The genomic structural equation model for calculating genetic correlations between distinct types of conduction disorders. SSS, sick sinus syndrome; LBBB, left branch bundle block; RBBB, right branch bundle block; IAVB, first‐degree atrioventricular block; IIAVB, second‐degree atrioventricular block; IIIAVB, third‐degree atrioventricular block.(a)(b)
Before constructing the model, the genetic relationships between the six GWAS traits were analyzed using GenomicSEM to identify the effectiveness of the model. Regarding the chi‐square test, the χ ^2^ was 8.2165 and the p‐value was 0.5124, indicating that the model showed no difference between the genetic covariance matrix and the empirical covariance matrix. The CFI value of 1.00 in this study indicates that the model fits very well. The AIC value of this model was 32.2165. Although our SRMR value (0.0984) was slightly above 0.08, it is still within an acceptable range, indicating that the model performs well in fitting the data. Table 2 shows the latent factor derived from genome structural equation modeling and the univariate SEM parameter associations. As the table indicates, different degrees of AVBs and SSS are significantly positively associated with the common latent factor, whereas intraventricular conduction block is significantly negatively associated with the common latent factor. These findings support the presence of a conserved genetic architecture among the CCD traits evaluated in this study. In‐depth molecular mechanisms may differ between the two categories of CCDs (AVB and BBBs).
3.2. Quality Control and Statistical Genetic Analysis Report for the GenomicSEM Identified a Latent Factor
Quality analysis of latent factor GWAS summary datasets using methodological parameter controls resulted in the exclusion of 6,401,566 SNPs and retention of 1,117,809 effective variants. The characteristics of the retained SNPs were as follows: mean X ^2^ = 1.1023; genomic control lambda (λGC) = 1.1491; max X ^2^ = 33.324; contribution ratio of genetic component to environment = 0.1066 (0.0623); and h ^2^ = 0.0699 (0.0083).
3.3. Identification of CCD‐Related Genetic Loci and Genes Based on Structural Equation Modeling and FUMA Software Analysis of GWAS Data
We identified four risk loci (rs71208329, rs13031826, rs2634071, and rs112720315; Table S1) with parameter p‐value < 5*e − *8 and LD R ^2^ < 0.1 using the FUMA website. Among these, rs71208329 and rs112720315 were significant SNPs in the common latent factor GWAS summary dataset; these loci had smaller p‐values than others in each type of conduction disorder. Furthermore, we identified four genes significantly associated (FDR < 0.05) with the CCD traits (CCDC141, SCN10A, SH3PXD2A, and ESR2) by analyzing GWAS data (Figure 2).
Figure 2. Manhattan plots from the FUMA software analysis. (a) Annotation of lead SNPs using the FUMA software with p‐value < 5 × 10^−8^ and R ^2^ < 0.1 set as threshold parameters. (b) Identification of CCD‐associated genes (CCDC141, SCN10A, SH3PXD2A, and ESR2) with significant adjusted p‐values based on the FUMA software analysis.(a)(b)
3.4. Fine‐Mapping Analysis Identifies Latent Factor as the Causal SNP
A fine‐mapping analysis demonstrated strong associations between multiple genomic loci and the CCDs, especially rs71208329, a variant within the AC023469.1 region on Chromosome 2, and rs112720315, a variant located in the TCP10L2 locus on Chromosome 6. SuSiE indicated that rs71208329 has a posterior probability of 1, and FINEMAP also indicated a posterior probability of 1. SuSiE and FINEMAP showed that rs112720315 has a posterior probability of 0.99 and 0.99, respectively. Thus, both methods support the causal effect of the variants. Regional association plots displayed distinct peaks at these locations in Chromosomes 2 and 6, and these associations were further confirmed by their identification as credible set variants (Figure 3 and Figure S1).
Figure 3. The LocusZoom plot shows the fine‐mapping analysis results. The plots show results from two methods (SuSiE and FINEMAP) of fine‐mapping analysis. The lowest panel shows the final results of the fine‐mapping analysis. (a) A fine‐mapping plot showing a PP of > 0.95 for rs112720315 with both the SuSiE and FINEMAP fine‐mapping methods, thereby indicating its causal role in the pathogenesis of CCDs. (b) A fine‐mapping plot demonstrating a PP of > 0.95 for rs71208329 with SuSiE and FINEMAP methods, thereby indicating its causal role in the pathogenesis of CCDs.(a)(b)
3.5. PheWAS Analysis Confirms a Significant Association Between rs112720315 and Nonischemic Cardiomyopathy
We then assessed the association between the two significant SNPs (rs71208329 and rs112720315) and the CCD‐associated traits from the FinnGen database. We found a significant association between nonischemic cardiomyopathy and rs112720315 (OR > 1) using a p‐value threshold of 1 × 10^−4^ (Figure 4). This suggested a potential link between CCDs and cardiomyopathy.
PheWAS analysis based on the FinnGen database. The association between significant SNPs identified by fine‐mapping analysis and CCD‐related traits is illustrated. As shown, only nonischemic cardiomyopathy is correlated with rs112720315 (odds ratio > 1).
3.6. Transcriptome‐Wide Association Analysis Demonstrates a Significant Causal Association Between FKBP7 and CCDs
Subsequently, we performed TWAS using the FUSION software based on three types of tissue mixture panels (sCCA1, sCCA2, and sCCA3) to identify genes significantly associated with CCDs. Among 37,640 genes identified by TWAS (Table S2 indicated those with TWAS p‐value < 0.05), only FKBP7 in the sCCA2 panel reached TWAS significance (p-value < 0.05/37,640) (Figure 5) and exhibited a positive relationship with the SEM‐identified factor. Subsequently, we conducted a FOCUS fine‐mapping analysis of the genomic structural equation modeling data and intersected the result with the significant genes in the TWAS analysis (Table S3). We found that FKBP7 (PIP > 0.9 in the FOCUS analysis) demonstrated significant causal relationships with CCDs.
A Manhattan plot of the FUSION TWAS results. As shown, only the FKBP7 gene is significantly associated with CCDs based on the adjusted p‐value.
To further confirm the role of FKBP7 in cardiac‐specific tissues, we repeated the TWAS and FOCUS analyses on the left ventricle and atrial appendage panels. We found that FKBP7 still exhibited a positive correlation and a causal relationship (PIP > 0.7 in FOCUS test) with the CCD latent factor in the left ventricle panel (Table 3).
3.7. LDSC and TSMR Demonstrate a Causal Association Between the Identified Genes and CCDs
We used a MAGMA analysis to further annotate genes associated with the latent factor F1. However, MAGMA cannot verify causal effects. We identified four genes (CCDC141, SCN10A, SH3PXD2A, and ESR2) with an adjusted p‐value < 0.05. To further determine whether the identified genes can predict the occurrence of different types of CCDs, we analyzed eQTL data from the eQTLGen cohort for the identified genes.
For the GWAS dataset parameters (in Table S4), we found that SH3PXD2A’s intercept (12.20) was significantly larger than 1, indicating population stratification. Although CCDC141 (intercept: 0.1014) and ESR2 genes had intercepts significantly lower than 1, this suggests that the trait was affected by some confounding factors. Moreover, regarding heritability, we found that the CCDs exhibited significantly lower h ^2^ (< 0.01), which was due to the relative size or depth of the included GWAS summary data.
As shown in Figure 6(a), CCDC141 demonstrated a positive correlation with RBBB and negative correlations with SSS, IIIAVB, IIAVB, and IAVB. Furthermore, CCDC141 demonstrated a strong association with the latent factor identified from the GenomicSEM analysis. ESR2 demonstrated a significant positive correlation with SSS, IIIAVB, IIAVB, and IAVB and a negative association with RBBB. FKBP7 demonstrated significant positive correlations with F1, SSS, IIIAVB, IIAVB, LBBB, and IAVB and a negative association with RBBB. SH3PXD2A demonstrated significant negative correlations with F1, IIIAVB, IIAVB, and IAVB.
Figure 6(a) A correlation heat map shows the LDSC analysis results of the association between four specific genes (CCDC141, ESP2, FKBP7, and SH3PXD2A) and multiple CCDs. The red color indicates positive correlations with the CCD traits. (b) A heat map shows the results of the two‐sample Mendelian randomization analysis of the causal relationships between four specific genes (CCDC141, ESP2, FKBP7, and SH3PXD2A) and multiple CCDs.(a)(b)
The TSMR analysis results (Figure 6(b)) demonstrated a positive causal relationship of CCDC141 with RBBB and LBBB. Furthermore, CCDC141 showed negative causal relationships with IIIAVB and F1. ESR2 demonstrated significant positive correlations with SSS, IIIAVB, IIAVB, and IAVB and negative correlations with RBBB and LBBB. FKBP7 demonstrated significant positive correlations with F1, IIAVB, and IAVB and a negative association with RBBB. SH3PXD2A showed a negative correlation with RBBB and positive correlations with IIAVB and F1. The Steiger test and pleiotropy tests demonstrated that the TSMR results were stable and reliable (Table S5).
In summary, we identified genetic biomarkers for accurately predicting a wide spectrum of CCDs. This includes CCDC141, which increases the risk of SSS, RBBB, IIAVB, and latent factor; ESR2, which increases the risk of SSS, IIIAVB, IIAVB, IAVB, and RBBB; and FKBP7, which increases the risk of IAVB, RBBB, and IIAVB.
3.8. Cross‐Ancestry Validation of the Efficiency of the Above Model
In the TWAS section, we found that the APOL1 gene was significantly associated with a latent factor in two reference panels (sCCA1 and sCCA2). APOL1 was previously reported to be associated with kidney diseases in individuals of African ancestry [21, 22]. Therefore, we tested the structural model among individuals of African ancestry. The included datasets are shown in Table 4. The χ ^2^ was 3.29 (p‐value: 0.95), indicating that the model showed no difference between the genetic covariance matrix and the empirical covariance matrix. The CFI value of 1.00 in this study indicates that the model fits very well. The AIC value in this model was 27.29, indicating a relatively better fit than that of those of European ancestry. However, the SRMR value of the model was 0.219, which is higher than that of the European model, indicating that the model may not fit African ancestry data. Regarding the relationship between each type of CCD and the common latent factor (F1), we found no significant association between F1 and IIAVB, LBBB, and SSS (p‐value > 0.05; Table 5).
3.9. In‐Depth Exploration of the Effect of the APOL1 Gene on CCDs
As previously reported, chronic kidney disease (CKD) is independently associated with AVB (HR: 1.83; 95% CI: 1.73–1.93) [23]. Additionally, CKD is associated with mortality in patients with LBBB (HR = 2.48, 95% CI = 1.71–3.59, p < 0.001) [24]. Furthermore, APOL1 is strongly associated with CKD in persons of African ancestry. In this study, the TWAS analysis revealed a potential association between CCDs and the APOL1 gene in individuals of European ancestry. We evaluated the relationships among the APOL1 gene, different stages of CKD (Table 6), and CCDs, using Mendelian randomization to identify causal relationships.
The MR analysis (Figure 7) between APOL1 and CCDs among persons of African ancestry indicated that APOL1 is a direct causal factor for third‐degree AVB (OR: 1.79, 1.32–2.43; p‐value < 0.01), and the result of the sensitivity analysis is shown in Table S6. Additionally, APOL1 increased the risk of Stage III CKD (OR: 1.23, 1.04–1.46; p‐value < 0.05) and Stage V CKD (OR: 1.60, 1.08–2.38; p‐value < 0.05), and these CKD stages mediated the increased risk of RBBB, LBBB, and IIIAVB (Figure 8). Stage III CKD is a mediator for APOL1‐related LBBB, RBBB, and IIIAVB. Stage V CKD is a mediator for APOL1‐related LBBB and RBBB. The sensitivity analysis of the median MR analysis is shown in Tables S7–S8. Thus, we found novel connections between CKD, the APOL1 gene, and CCDs among persons of African ancestry, which would benefit the management of cardiac arrhythmia in patients with CKD.
A forest plot reveals the causal relationships between the APOL1 gene expression and the risk of each type of cardiac conduction disorder in African ancestry data.
Median analysis of the relationships among the APOL1 gene, chronic kidney diseases, and each type of cardiac conduction disorder.
4. Discussion
CCDs are associated with life‐threatening cardiovascular events related to syncope and sudden cardiac death [25]. Therefore, an in‐depth understanding of the genetic basis of various CCDs is beneficial for their management. In this study, we performed an integrated investigation of CCD traits to identify new genetic markers that can accurately predict CCDs. By offering a fresh theoretical framework, the study advances the identification of CCD‐linked genetic loci to inform precision medicine strategies and public health initiatives.
A Genomic‐SEM analysis uncovered shared genetic variants across SSS, BBBs, and all grades of AVB. Genetically, AVB and BBB are strongly positively correlated, whereas SSS is negatively correlated with BBB but positively correlated with AVB; accordingly, AVB and BBB show a distinct genetic architecture. Genomic‐SEM revealed a latent factor that drives CCDs and highlighted previously unreported risk loci. Fine mapping prioritized rs112720315 as a novel CCD‐associated variant, and PheWAS further linked this allele to nonischemic cardiomyopathy. As previously reported, conduction disorders such as LBBB result from NICM [26]. However, previous studies have not analyzed the genetic links between BBBs, especially LBBB, and NICM or heart failure. Our study provides insights into the underlying genetic mechanisms. Furthermore, we performed TWAS, FOCUS, and FUMA analyses and identified causal gene markers related to the risk of conduction disorders. Subsequent LDSC and MR analyses demonstrated the clinical potential of these gene markers in predicting a wide spectrum of conduction disorders.
GWAS data have shown that FKBP7 is a marker of increased risk and a therapeutic target of atrial fibrillation (AF) [27–29]. Our data exhibited a positive correlation between different degrees of AVB and FKBP7 gene expression levels, as determined by the TSMR method. First‐degree AVB and AF were reported to have a common underlying mechanism [30]. Our data suggest that FKBP7 may play a key role in AVB and AF. Moreover, FKBP7 can bind to Ca^2+^ in the endoplasmic reticulum and helps control cellular calcium ion concentrations [31]. An enhanced binding of Ca^2+^ in the endoplasmic reticulum reduces cardiac conduction velocity because of a reduced Ca^2+^ transient [32]. Previous GWASs have reported that CCDC141 was associated with SAN dysfunction, distal conduction disorders, and pacemaker implantation [33]. Our study confirms the association between CCDC141 and distal conduction disorders. Our data indicate that, in contrast to CCDC141, ESR2 is related to SSS and AVB, revealing an opposite genetic effect on CCDs. ESR2, the principal nuclear receptor for estrogen, downregulates GLUT4 and accelerates collagen deposition and cardiac fibrosis [34, 35]. Previous studies have shown that AVB and early AF share pathophysiological features, most notably pronounced atrial fibrosis [36, 37]. Thus, ESR2 is a promising therapeutic target that drives atrial fibrosis and, consequently, CCDs. A previous study reported that SH3PXD2A increased the risk of AF [38]. However, LDSC and TSMR analyses in our study did not demonstrate that SH3PXD2A was a significant predictor of conduction disorders.
Regarding the transancestry applicability of our model, we tested the model among individuals of African ancestry because the TWAS analysis among persons of European ancestry revealed that the APOL1 gene showed a significant positive correlation with CCDs, and the APOL1 gene is related to kidney diseases in people of African ancestry [39]. The common factor model demonstrated better fitting effectiveness among individuals of African ancestry than among those of European ancestry. However, the associations between the common factor and each type of CCD were not significant, indicating that the model should be cautiously applied across ancestry. Moreover, CKD is related to the severity of BBBs [24] and the occurrence of third‐degree AVBs [23]. Our TSMR results demonstrate a novel connection between APOL1 and IIIAVB. Moreover, Stage 3 and 5 CKDs are mediators of APOL1‐related conduction disorders. However, current studies primarily focus on the variants of APOL1 associated with CVDs, with a limited number of studies examining arrhythmia. Therefore, we provided new insights into the APOL1 gene’s role in arrhythmia and CKD.
Overall, our study demonstrates genetic correlations between distinct types of CCDs. We also detected a novel locus of a latent factor that modulates several CCDs. SNP rs112720315 on Chromosome 6 shows a significant causal relationship with NICM, a disease closely linked with CCDs. Therefore, this genetic locus has significant clinical value in CCD therapy. Furthermore, we identified multiple genes as potential prediction biomarkers for CCDs.
5. Limitations
Although this study revealed genetic correlations between CCDs, the heterogeneity of genetic associations and differences in data format and annotation in different sources may limit the accuracy and interpretability of the model estimates. However, only GWAS summaries are retrieved from the database; specific individual data were not extracted, making it impossible to prevent sample overlap. The GenomicSEM method calculates genetic correlation between traits before formal calculation, and this correlation matrix was considered to minimize the overlap. SCN10A was undetected due to a lack of eQTL data. Markers identified in the European GWAS may not be applicable to other populations, necessitating validation in diverse groups. Fine‐mapping and transcriptomics identified CCD loci, but their biological effects are unknown because of a lack of functional validation. Polygenic factors significantly impact CCDs, but environmental factors are also crucial. However, this method detected markers rarely reported in experimental studies. Genomic SEM identified a latent CCD factor, partially addressing this limitation [40].
5.1. Conclusion
This study performed a Genomic‐SEM using CCD GWAS summary data and identified a latent factor that influences CCDs. Based on the results from the SEM and fine‐mapping analyses, we identified a novel lead gene locus associated with the latent factor and nonischemic cardiomyopathy. Furthermore, TWAS, FUMA, FOCUS, LDSC, and TSMR analyses identified four gene markers (CCDC141, FKBP7, SH3PXD2A, and ESR2) that are significantly associated with the latent factor. We tested the structural model using African ancestry data and found that APOL1 was associated with the occurrence of IIIAVB and caused CCDs through CKD.
NomenclatureCCDsCardiac conduction disordersGWASGenome‐wide association studyTSMRTwo‐sample Mendelian randomizationLDSCLinkage disequilibrium score regressionSRMRStandardized root‐mean‐square residualTWASTranscriptome‐wide association studyFUMAFunctional Mapping and Annotation of Genetic AssociationsSSSSick sinus syndromeAVBAtrioventricular blockLBBBLeft bundle branch blockRBBBRight bundle branch blockNICMNonischemic cardiomyopathy
Ethics Statement
The authors have nothing to report.
Consent
The authors have nothing to report.
Disclosure
All the authors read and approved the final manuscript.
Conflicts of Interest
The authors declare no conflicts of interest.
Author Contributions
Yunlong Xia designed the entire study. Tongyu Wang and Xinge Miao performed data collection and analysis. Tongyu Wang and Xinge Miao performed data visualization. Yunlong Xia performed language editing. Tongyu Wang and Xinge Miao wrote the original draft. Tongyu Wang and Xinge Miao contributed equally to this work.
Funding
This study was supported by funds from the Liaoning Revitalization Talents Program (Grant No. XLYC2002096) and National Key Research and Development Program of China (Grant No. 2022YFC2405002).
Supporting Information
Figure S1: Regional association plots and LD patterns for rs71208329 and rs112720315. LocusZoom plots of the top lead SNPs identified by GWAS. A. Chromosome 2 locus (lead SNP: rs71208329; position 151.7–152.2 Mb). B. Chromosome 6 locus (lead SNP: rs112720315; position 167.4–167.8 Mb). For each panel, ‐log (p) is plotted on the y‐axis and genomic position (hg19) on the x‐axis. Color coding indicates LD R ^2^.
Table S1. Detailed information of the FUMA analysis with annotated leading SNPs, including the position, nearest gene, alleles, effect parameters, and MAF values.
Table S2. TWAS analysis results. This table indicates the correlation between the gene in the GTEx reference panel and the latent factor of interest.
Table S3. FOCUS analysis results. A Bayes colocalization analysis showing the causal genes associated with the latent factor (F1) of interest.
Table S4. This table presents key quality control metrics estimated using LDSC to evaluate the validity of the genome‐wide association study (GWAS) summary statistics before downstream analyses.
Table S5. Results of directionality and pleiotropy tests for gene and cardiac conduction disorders: Mendelian randomization analyses. A. Pleiotropy test results for the Mendelian randomization analysis to detect horizontal pleiotropy in the TSMR analysis; the MR‐Egger intercept test evaluates the presence of directional horizontal pleiotropy. A p‐value of < 0.05 indicates significant pleiotropic bias. B. Results of the MR‐Steiger test to identify the direction of MR results; the Steiger test was used to assess the correctness of the assumed causal direction between exposure and outcome. A p‐value of < 0.05 suggests that the direction of the MR analysis is correct.
Table S6. Results of the directionality and pleiotropy tests in Mendelian randomization analyses of the association between the APOL1 gene and cardiac conduction disorders in African ancestry data. A. Pleiotropy test results from the Mendelian randomization analysis to assess horizontal pleiotropy in the two‐sample MR (TSMR) framework; the MR‐Egger intercept test was used to evaluate the presence of directional horizontal pleiotropy. A p‐value of < 0.05 indicates significant pleiotropic bias. B. Results of the MR‐Steiger test to determine the causal directionality of the MR estimates; the Steiger test assesses the validity of the assumed causal direction between exposure and outcome. A p‐value of < 0.05 supports the correctness of the specified direction in the MR analysis.
Table S7. Results and sensitivity analysis of the Mendelian randomization analysis of the association between the APOL1 gene and different stages of chronic kidney disease in African ancestry data. A. Mendelian randomization results for the causal relationship between APOL1 and chronic kidney diseases in African ancestry data using the “IVW” method. B. Results of the pleiotropy test of the Mendelian randomization analysis to assess horizontal pleiotropy in the two‐sample MR (TSMR) framework; the MR‐Egger intercept test was used to evaluate the presence of directional horizontal pleiotropy. A p‐value of < 0.05 indicates significant pleiotropic bias. C. Results of the MR‐Steiger test to determine the causal directionality of the MR estimates; the Steiger test assesses the validity of the assumed causal direction between exposure and outcome. A p‐value of < 0.05 supports the correctness of the specified direction in the MR analysis.
Table S8. Results and sensitivity analysis of Mendelian randomization between different stages of chronic kidney disease and cardiac conduction disorders in African ancestry data. A. Mendelian randomization results for the causal relationship between chronic kidney diseases and cardiac conduction disorders in African ancestry data using the “IVW” method. B. Pleiotropy test results from the Mendelian randomization analysis to assess horizontal pleiotropy in the two‐sample MR (TSMR) framework; the MR‐Egger intercept test was used to evaluate the presence of directional horizontal pleiotropy. A p‐value of < 0.05 indicates significant pleiotropic bias. C. Results of the MR‐Steiger test to determine the causal directionality of the MR estimates; the Steiger test assesses the validity of the assumed causal direction between exposure and outcome. A p‐value of < 0.05 supports the correctness of the specified direction in the MR analysis.
Supporting information
Supporting Information Additional supporting information can be found online in the Supporting Information section.
The reference list from the paper itself. Each links out to its DOI / PubMed record.
- 1Cristina B. , Luca C. , Marco Z. et al., Cardiac Conduction Disorders Due to Acquired or Genetic Causes in Young Adults: A Review of the Current Literature, Journal of the American Heart Association. (2025) 14, no. 9, 10.1161/jaha.124.040274.PMC 1218422840314370 · doi ↗ · pubmed ↗
- 2Bingxun L. , Hongxuan X. , and Lin W. , Genetic Insights Into Cardiac Conduction Disorders From Genome-Wide Association Studies, Human Genomics. (2025) 19, no. 1, 10.1186/s 40246-025-00732-x.PMC 1187180940022259 · doi ↗ · pubmed ↗
- 3Petri H. , Ismo A. , Kjell N. et al., Prognostic Implications of Intraventricular Conduction Delays in a General Population: The Health 2000 Survey, Annals of Medicine. (2015) 47, no. 1, 74–80, 10.3109/07853890.2014.985704, 2-s 2.0-84923287275.25613171 · doi ↗ · pubmed ↗
- 4Wenli O. , Peipei L. , Naihui Z. et al., Association Between Cumulative Body Mass Index Exposure and the Risk of Incident Cardiac Conduction Block, Journal of the American Heart Association. (2025) 14, no. 8, 10.1161/jaha.124.039522.PMC 1213282940207481 · doi ↗ · pubmed ↗
- 5Julian S H. , Paolo D. A. , Victor N. et al., Frequency of electrocardiogram-defined Cardiac Conduction Disorders in a Multi-Institutional Primary Care Cohort, JACC Advances. (2024) 3, no. 7, 10.1016/j.jacadv.2024.101004.PMC 1131278239130046 · doi ↗ · pubmed ↗
- 6Stefan v. D. , Christopher P N. , Zahra R.-E. et al., Leucocyte Telomere Length and Conduction System Ageing, Heart. (2024) 111, no. 7, 314–320, 10.1136/heartjnl-2024-324875.PMC 1201505039689933 · doi ↗ · pubmed ↗
- 7Judy R S. , Hector M.-N. , Xin S. et al., Cardiac Conduction System Regeneration Prevents Arrhythmias After Myocardial Infarction, Nature Cardiovascular Research. (2025) 4, no. 2, 163–179, 10.1038/s 44161-024-00586-x.PMC 1182536739753976 · doi ↗ · pubmed ↗
- 8Hongwei C. , Godfrey L S. , Jules C H. , and Clive H O. , Inhibition of Spontaneous Activity of Rabbit Atrioventricular Node Cells by kb-r 7943 and Inhibitors of Sarcoplasmic Reticulum ca(2+) AT Pase, Cell Calcium. (2010) 49, 56–65, 10.1016/j.ceca.2010.11.008, 2-s 2.0-79951551951.21163524 PMC 3048929 · doi ↗ · pubmed ↗