Standalone Anterior Lumbar Interbody Fusion L5-S1 for Single-Level Degenerative Disc Disease: Implant Parameters Influencing Radiological Results
Pierre Barthes, André Boché, Richard Lacroix, Cécile Swennen, Mathieu Severyns, Clément Giraud, Tanguy Vendeuvre

TL;DR
This study examines how implant parameters affect radiological outcomes after a specific spinal surgery for degenerative disc disease at the L5-S1 level.
Contribution
The study identifies anterior implant height as the most influential implant parameter for postoperative radiological outcomes in standalone L5-S1 ALIF.
Findings
Standalone L5-S1 ALIF significantly improved sagittal alignment and foraminal height.
Anterior implant height was significantly associated with L4-S1 correction and postoperative lumbar distribution index.
The fusion rate at one year was 88%.
Abstract
Introduction Degenerative disc disease at the L5-S1 level is a common condition and is often associated with chronic low back pain and, in some cases, radicular symptoms. Anterior lumbar interbody fusion (ALIF) is intended to restore segmental and global lumbar lordosis (LL), improve sagittal alignment, and achieve decompression. The primary objective of this study was to examine the association between implant-related parameters and postoperative radiological outcomes following standalone L5-S1 ALIF. A secondary exploratory objective was to assess how closely postoperative LL at the L4-S1 and L5-S1 levels matched pelvic incidence-based theoretical alignment targets. These targets were used as a reference framework for sagittal alignment assessment and were calculated using established proportional relationships between pelvic incidence and LL. Methods We conducted a retrospective,…
Genes, proteins, chemicals, diseases, species, mutations and cell lines named across the full text — each resolved to its canonical identifier and authoritative record.
Click any figure to enlarge with its caption.
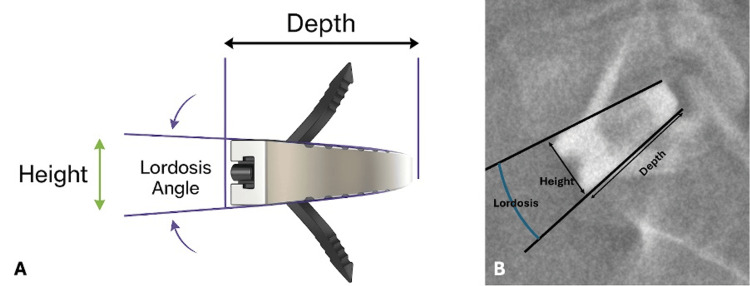 Figure 1
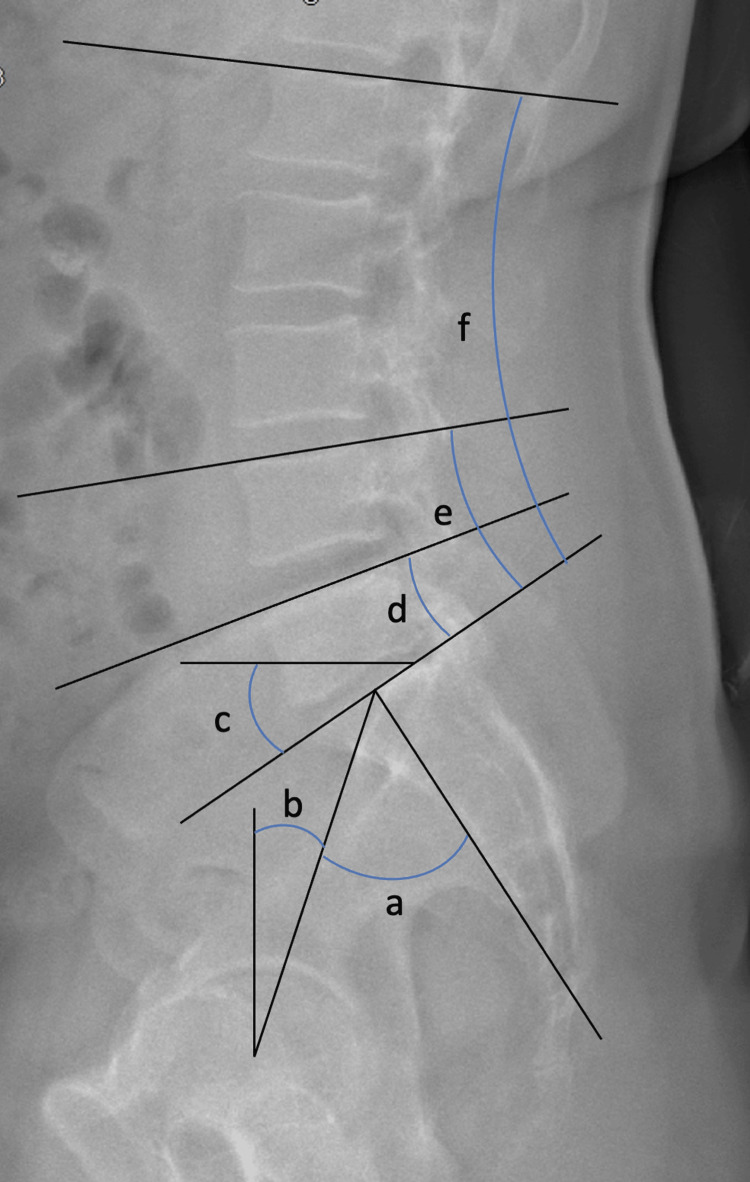 Figure 2
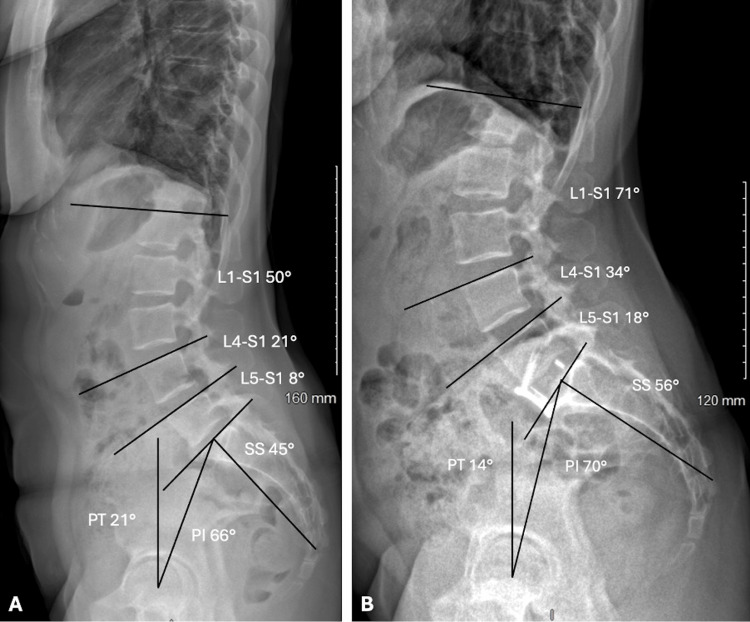 Figure 3
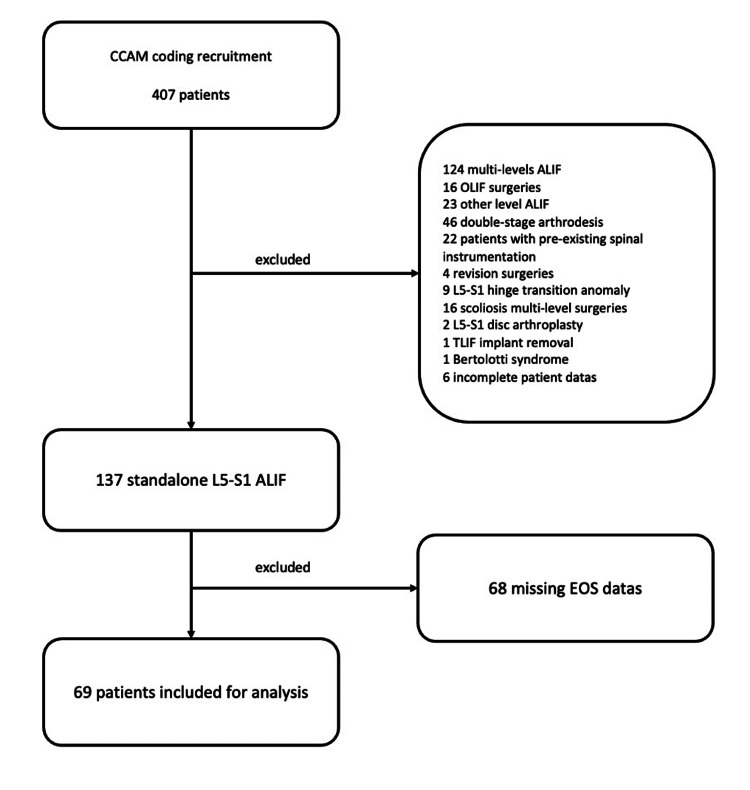 Figure 4
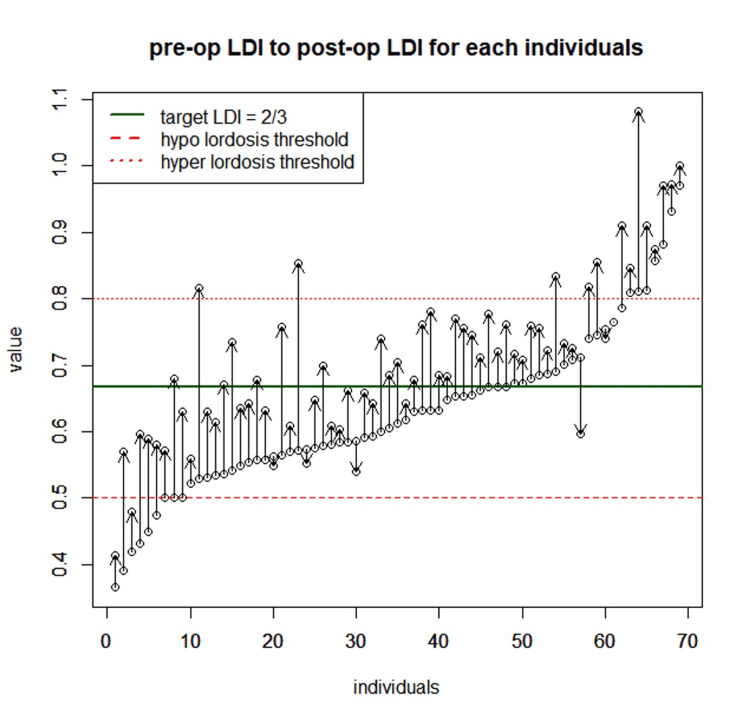 Figure 5
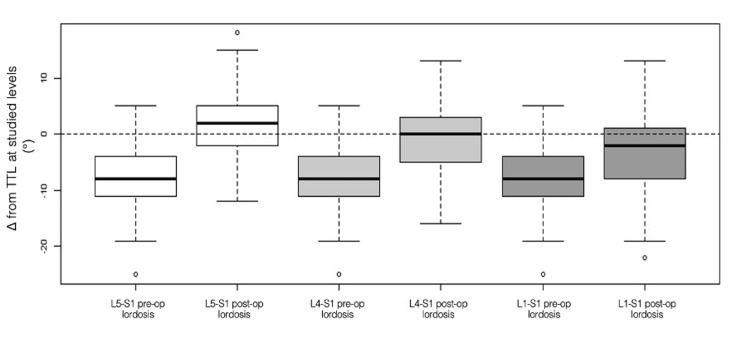 Figure 6
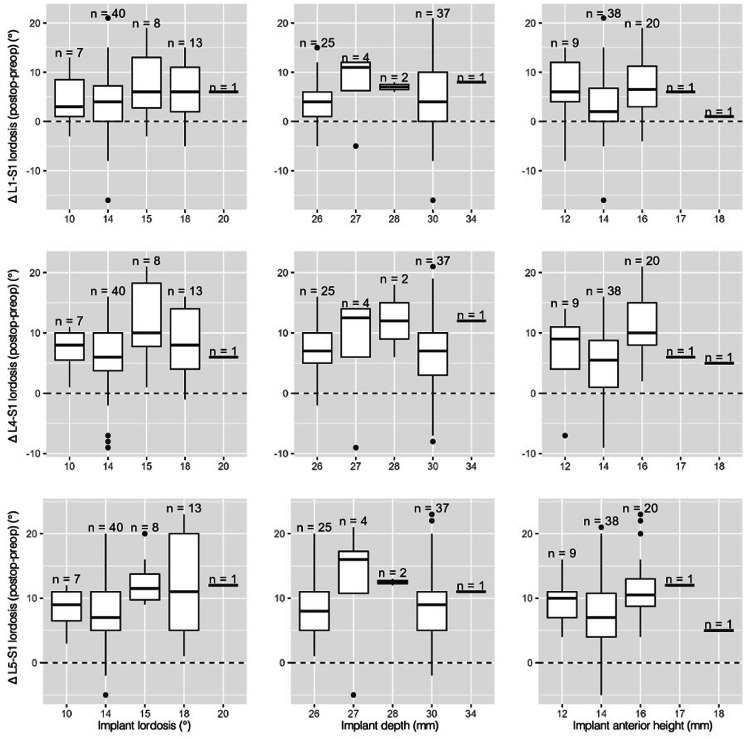 Figure 7
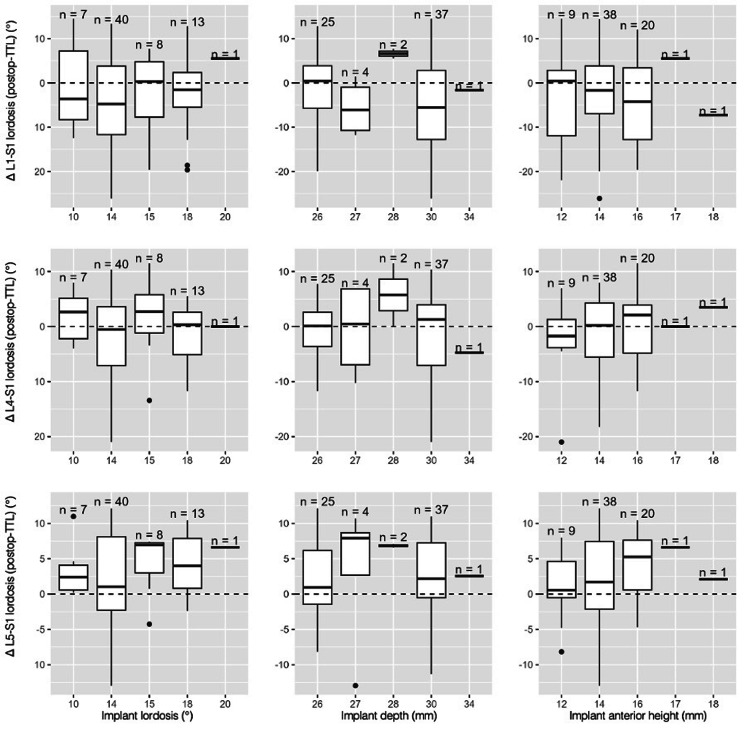 Figure 8
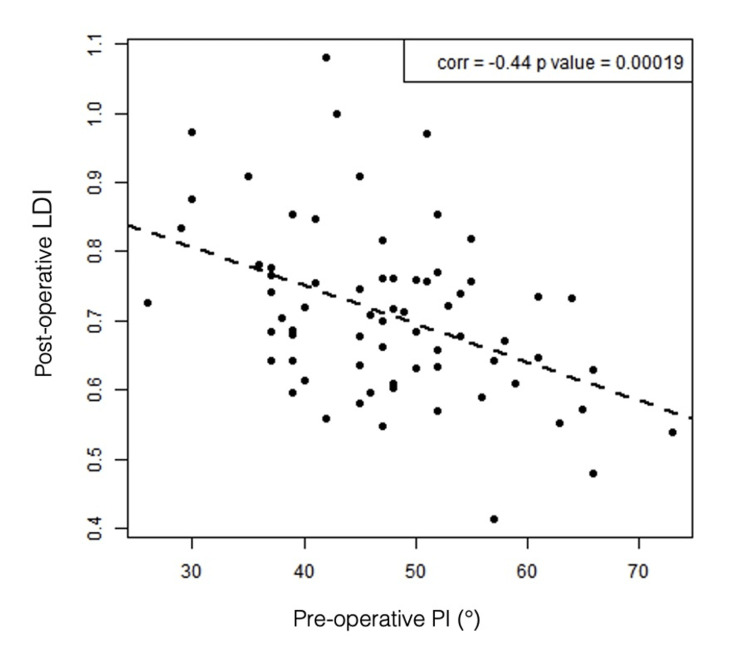 Figure 9
| Baseline characteristics | Values |
| Age (years) mean ± SD | 46.7 ± 9.1 |
| Sex ratio | 46 F/23 M |
| Height (cm) mean ± SD | 169.3 ± 8.6 |
| Weight (kg) mean ± SD | 80.2 ± 15.1 |
| BMI (kg/m²) mean ± SD | 27.9 ± 4.6 |
| Implants (n = 69) | |
| Zero-profile titanium implants with screws fixation, n | 16 |
| Cage + plate peek implants, n | 53 |
| Implant anterior height (mm) mean ± SD | 14.42 ± 1.4 |
| Implant lordosis (°) mean ± SD | 14.55 ± 2.2 |
| Implant depth (mm) mean ± SD | 28.38 ± 2.0 |
| Preoperative measurements | Postoperative measurements | P-value | |
| Pelvic Incidence (°), mean ± SD | 47.46 ± 9.71 | 50.97 ± 10.81 | <0.05 |
| Pelvic tilt (°), mean ± SD | 11.72 ± 6.18 | 11.06 ± 6.81 | 0.082 |
| Sacral slope (°), mean ± SD | 35.72 ± 7.91 | 39.78 ± 8.59 | <0.05 |
| SVA (mm), mean ± SD | 23.96 ± 28.06 | 20.61 ± 26.91 | 0.215 |
| ADH (mm), mean ± SD | 7.1 ± 2.74 | 15.81 ± 1.99 | <0.05 |
| PDH (mm), mean ± SD | 2.61 ± 1.32 | 6.76 ± 1.93 | <0.05 |
| Foraminal height (mm), mean ± SD | 13.8 ± 2.1 | 17.04 ± 2.51 | <0.05 |
| L1-S1 lordosis (°), mean ± SD | 50.2 ± 10.22 | 54.87 ± 11.11 | <0.05 |
| L4-S1 lordosis (°), mean ± SD | 31.01 ± 6.71 | 38.12 ± 6.29 | <0.05 |
| L5-S1 lordosis (°), mean ± SD | 16.93 ± 5.15 | 25.94 ± 5.2 | <0.05 |
| L5-S1/L1-S1, mean ± SD | 0.34 ± 0.12 | 0.49 ± 0.11 | <0.05 |
| LDI (%), mean ± SD | 63 ± 12 | 71 ± 12 | <0.05 |
| Subgroup LDI (n = 69) | |||
| <50% | 6 | 2 | |
| 50-80% | 56 | 54 | |
| >80% | 7 | 13 |
| Variables | Values, mean ± SD |
| Theoretical L1-S1 lordosis (°) | 58.2° ± 5.2 |
| Δ L1-S1 preoperative – TTL (°) | -8.0° ± 8.7 |
| Δ L1-S1 postoperative – TTL (°) | -3.32° ± 9.5 |
| Theoretical L4-S1 lordosis (°) | 38.8° ± 3.5 |
| Δ L4-S1 preoperative – TTL (°) | -7.8° ± 7.0 |
| Δ L4-S1 postoperative – TTL (°) | -0.7° ± 6.5 |
| Theoretical L5-S1 lordosis (°) | 23.3° ± 2.1 |
| Δ L5-S1 preoperative – TTL (°) | -6.35° ± 5.7 |
| Δ L5-S1 postoperative – TTL (°) | 2.67° ± 5.6 |
| Pelvic incidence subgroups | <45° | 45-60° | >60° | Overall | P-value | H-statistic |
| Patient characteristics | ||||||
| Sex F, n (%) | 16 (66.67) | 23 (62.16) | 7 (87.5) | 46 (66.67) | 0.44278 | NA |
| Sex M, n (%) | 8 (33.33) | 14 (37.84) | 1 (12.5) | 23 (33.33) | 0.44278 | NA |
| Weight (kg), mean ± SD | 81.62 ± 17.91 | 80.11 ± 14.17 | 76.25 ± 11.61 | 80.19 ± 15.2 | 0.74824 | 0.5800693 |
| Height (cm), mean ± SD | 169.5 ± 9.33 | 169.38 ± 8.86 | 168.88 ± 6.15 | 169.36 ± 8.66 | 0.98921 | 0.0216985 |
| BMI (kg/m2), mean ± SD | 28.31 ± 5.42 | 27.91 ± 4.39 | 26.64 ± 3.26 | 27.9 ± 4.64 | 0.76067 | 0.5471058 |
| Age at surgery (years), mean ± SD | 45.04 ± 7.94 | 48.57 ± 9.48 | 43.25 ± 10.5 | 46.72 ± 9.19 | 0.21059 | 3.1156527 |
| Implant parameters | ||||||
| Cage + plate peek implants, n (%) | 20 (83.3) | 26 (70.27) | 7 (87.5) | 53 (76.81) | 0.27536 | NA |
| Zero-profile titanium implants, n (%) | 4 (16.7) | 11 (29.73) | 1 (12.5) | 16 (23.19) | 0.27536 | NA |
| Implant depth (mm), mean ± SD | 28.92 ± 2.1 | 28.11 ± 1.93 | 28 ± 2.14 | 28.38 ± 2.02 | 0.28288 | 2.5254899 |
| Implant anterior height (mm), mean ± SD | 14.17 ± 1.43 | 14.62 ± 1.36 | 14.25 ± 1.28 | 14.42 ± 1.38 | 0.49645 | 1.4005443 |
| Implant lordosis (°), mean ± SD | 14.21 ± 2.5 | 14.54 ± 2.1 | 15.62 ± 2 | 14.55 ± 2.25 | 0.27707 | 2.5669918 |
| Vertebra parameters | ||||||
| Inferior L5 endplate depth (mm), mean ± SD | 33.42 ± 2.36 | 33.19 ± 3.52 | 32 ± 3.07 | 33.13 ± 3.1 | 0.4067 | 1.7993819 |
| Superior S1 endplate depth (mm), mean ± SD | 33.12 ± 3.66 | 33.59 ± 3.41 | 31.75 ± 2.43 | 33.22 ± 3.41 | 0.41176 | 1.7746207 |
| L5 S1 discal lordosis pre-op (°), mean ± SD | 6.12 ± 4.48 | 7.38 ± 5.41 | 6.38 ± 4.96 | 6.83 ± 5.02 | 0.41234 | 1.7718182 |
| Implant positioning | ||||||
| Implant anterior wall to anterior L5 wall (mm), mean ± SD | -4.25 ± 1.78 | -3.05 ± 3.23 | -4.38 ± 1.77 | -3.62 ± 2.7 | 0.2709 | 2.6120014 |
| Coverage ratio, mean ± SD | 0.88 ± 0.08 | 0.86 ± 0.07 | 0.88 ± 0.1 | 0.87 ± 0.08 | 0.37986 | 1.9359310 |
| Corrected coverage ratio, mean ± SD | 0.75 ± 0.08 | 0.76 ± 0.11 | 0.74 ± 0.1 | 0.76 ± 0.1 | 0.93831 | 0.1273519 |
| Pelvic incidence subgroups | <45° | 45-60° | >60° | Overall | P-value | H-statistic |
| Preoperative measurements | ||||||
| L1-S1 lordosis (°), mean ± SD | 44.54 ± 8.26 | 51.57 ± 9.63 | 60.88 ± 7.95 | 50.2 ± 10.22 | 0.00022 | 16.832056 |
| L5-S1 lordosis (°), mean ± SD | 17.29 ± 4.09 | 16.7 ± 5.71 | 16.88 ± 5.84 | 16.93 ± 5.15 | 0.95983 | 0.0819922 |
| L4-S1 lordosis (°), mean ± SD | 29.92 ± 5.55 | 31.08 ± 7.08 | 34 ± 8 | 31.01 ± 6.71 | 0.29882 | 2.4158404 |
| SVA (mm), mean ± SD | 18.5 ± 24.15 | 27.78 ± 30.1 | 22.62 ± 29.86 | 23.96 ± 28.06 | 0.30255 | 2.3910063 |
| PI (°), mean ± SD | 37.21 ± 4.39 | 50.35 ± 4.1 | 64.88 ± 3.83 | 47.46 ± 9.71 | <0.0001 | 54.683878 |
| PT (°), mean ± SD | 8.17 ± 5.1 | 12.7 ± 5.45 | 17.88 ± 6.4 | 11.72 ± 6.18 | 0.00043 | 15.508122 |
| SS (°), mean ± SD | 28.96 ± 5.17 | 37.65 ± 5.54 | 47.12 ± 6.1 | 35.72 ± 7.91 | <0.0001 | 35.182577 |
| ADH (mm), mean ± SD | 7 ± 2.77 | 7.08 ± 2.99 | 7.5 ± 1.31 | 7.1 ± 2.74 | 0.96435 | 0.0726004 |
| PDH (mm), mean ± SD | 2.5 ± 1.29 | 2.54 ± 1.32 | 3.25 ± 1.39 | 2.61 ± 1.32 | 0.31362 | 2.3191286 |
| FH (mm), mean ± SD | 13.71 ± 1.9 | 13.54 ± 2.18 | 15.25 ± 1.98 | 13.8 ± 2.1 | 0.19204 | 3.3000754 |
| L5.S1/L1.S1 lordosis ratio, mean ± SD | 0.4 ± 0.11 | 0.32 ± 0.12 | 0.27 ± 0.08 | 0.34 ± 0.12 | 0.00636 | 10.116546 |
| LDI, mean ± SD | 0.68 ± 0.14 | 0.61 ± 0.1 | 0.55 ± 0.08 | 0.63 ± 0.12 | 0.01175 | 8.8879704 |
| Postoperative measurements | ||||||
| L1-S1 lordosis, mean ± SD | 49.12 ± 9.22 | 55.81 ± 10.21 | 67.75 ± 8.71 | 54.87 ± 11.11 | 0.00026 | 16.515384 |
| L5-S1 lordosis, mean ± SD | 26.42 ± 4.37 | 25.3 ± 5.67 | 27.5 ± 5.42 | 25.94 ± 5.2 | 0.50058 | 1.3839854 |
| L4-S1 lordosis, mean ± SD | 36.96 ± 5.13 | 38.14 ± 6.32 | 41.5 ± 8.67 | 38.12 ± 6.29 | 0.31752 | 2.2944017 |
| SVA (mm), mean ± SD | 13.88 ± 26.21 | 22.35 ± 26.63 | 32.75 ± 28.14 | 20.61 ± 26.91 | 0.30348 | 2.3848846 |
| PI (°), mean ± SD | 41.25 ± 5.12 | 52.65 ± 5.28 | 72.38 ± 6.61 | 50.97 ± 10.81 | <0.0001 | 47.826572 |
| PT (°), mean ± SD | 7.71 ± 6.56 | 11.54 ± 5.14 | 18.88 ± 8.03 | 11.06 ± 6.81 | 0.00082 | 14.210122 |
| SS (°), mean ± SD | 33.33 ± 5.9 | 41.05 ± 6.26 | 53.25 ± 6.52 | 39.78 ± 8.59 | <0.0001 | 30.687371 |
| ADH (mm), mean ± SD | 15.42 ± 1.82 | 15.95 ± 1.86 | 16.38 ± 3.02 | 15.81 ± 1.99 | 0.63619 | 0.9045228 |
| PDH (mm), mean ± SD | 6.62 ± 1.86 | 6.72 ± 2.08 | 7.38 ± 1.51 | 6.76 ± 1.93 | 0.60422 | 1.0076486 |
| FH (mm), mean ± SD | 16.67 ± 2.48 | 16.92 ± 2.63 | 18.75 ± 1.16 | 17.04 ± 2.51 | 0.07416 | 5.2031456 |
| L5.S1/L1.S1 lordosis ratio, mean ± SD | 0.55 ± 0.1 | 0.46 ± 0.1 | 0.41 ± 0.08 | 0.49 ± 0.11 | 0.00238 | 12.077400 |
| LDI, mean ± SD | 0.77 ± 0.13 | 0.69 ± 0.11 | 0.61 ± 0.09 | 0.71 ± 0.12 | 0.00402 | 11.032845 |
| Postoperative LDI subgroups | ||||||
| <0.80, n (%) | 16 (66.67) | 32 (86.49) | 8 (100) | 56 (81.16) | 0.06697 | NA |
| >0.80, n (%) | 8 (33.33) | 5 (13.51) | 0 (0) | 13 (18.84) | 0.06697 | NA |
| TTL values | ||||||
| L5-S1 lordosis TTL (°), mean ± SD | 21.06 ± 0.95 | 23.9 ± 0.89 | 27.04 ± 0.83 | 23.28 ± 2.1 | <0.0001 | 54.683878 |
| L4-S1 lordosis TTL (°), mean ± SD | 35.1 ± 1.58 | 39.83 ± 1.48 | 45.06 ± 1.38 | 38.79 ± 3.5 | <0.0001 | 54.683878 |
| L1-S1 lordosis TTL (°), mean ± SD | 52.65 ± 2.37 | 59.75 ± 2.22 | 67.59 ± 2.07 | 58.19 ± 5.24 | <0.0001 | 54.683878 |
| Δ L1-S1 postoperative-TTL, mean ± SD | -3.53 ± 8.85 | -3.94 ± 10.07 | 0.16 ± 9.88 | -3.32 ± 9.59 | 0.53617 | 1.2465902 |
| Δ L4-S1 postoperative-TTL, mean ± SD | 1.86 ± 5.03 | -1.7 ± 6.42 | -3.56 ± 9.6 | -0.68 ± 6.61 | 0.0492 | 6.0236705 |
| Δ L5-S1 postoperative-TTL, mean ± SD | 5.36 ± 4.48 | 1.4 ± 5.75 | 0.46 ± 5.76 | 2.67 ± 5.63 | 0.01669 | 8.1856873 |
| Pelvic incidence subgroups/postoperative-preoperative Δ | <45°, mean ± SD | 45-60°, mean ± SD | >60°, mean ± SD | Overall | P-value | H-statistic |
| L1-S1 lordosis (°) | 4.58 ± 5.32 | 4.24 ± 6.52 | 6.88 ± 9.75 | 4.67 ± 6.52 | 0.79066 | 0.4697833 |
| L4-S1 lordosis (°) | 7.04 ± 4.14 | 7.05 ± 6.39 | 7.5 ± 9.21 | 7.1 ± 6.02 | 0.96975 | 0.0614319 |
| L5-S1 lordosis (°) | 9.12 ± 4.15 | 8.59 ± 6.37 | 10.62 ± 6.14 | 9.01 ± 5.62 | 0.76227 | 0.5429054 |
| ADH (mm) | 8.42 ± 3.03 | 8.86 ± 3.6 | 8.88 ± 3.44 | 8.71 ± 3.35 | 0.92293 | 0.1604019 |
| PDH (mm) | 4.12 ± 2.21 | 4.18 ± 2.11 | 4.12 ± 1.64 | 4.15 ± 2.07 | 0.98802 | 0.0241105 |
| FH (mm) | 2.96 ± 2.12 | 3.38 ± 2.1 | 3.5 ± 2.07 | 3.25 ± 2.08 | 0.58317 | 1.0785480 |
| PS (°) | 4.38 ± 4.08 | 3.41 ± 4.9 | 6.12 ± 7.81 | 4.06 ± 5.04 | 0.60695 | 0.9986186 |
| PT (°) | -0.46 ± 3.72 | -1.16 ± 3.24 | 1 ± 5.21 | -0.67 ± 3.68 | 0.28392 | 2.5181343 |
| PI (°) | 4.04 ± 2.65 | 2.3 ± 3.71 | 7.5 ± 5.1 | 3.51 ± 3.89 | 0.00089 | 14.044659 |
| SVA (mm) | -4.62 ± 27.92 | -5.43 ± 24.35 | 10.12 ± 24.48 | -3.35 ± 25.76 | 0.32006 | 2.2784652 |
| L5-S1/L1-S1 ratio | 0.15 ± 0.06 | 0.14 ± 0.12 | 0.14 ± 0.07 | 0.14 ± 0.1 | 0.21485 | 3.0756673 |
| LDI | 0.08 ± 0.07 | 0.09 ± 0.07 | 0.06 ± 0.07 | 0.08 ± 0.07 | 0.49523 | 1.4054474 |
Peer Reviews
No public reviews on file for this paper yet. If you reviewed it on a platform where reviews are public (OpenReview, ICLR, NeurIPS, ICML), you can paste yours below so the community can read it here.
Videos
No videos yet. Explain this paper in a talk, walkthrough, or lecture? Add one.
Taxonomy
TopicsSpine and Intervertebral Disc Pathology · Scoliosis diagnosis and treatment · Cervical and Thoracic Myelopathy
Introduction
Degenerative lumbar disc disease (DDD) is a common cause of chronic low back pain and may also result in radicular symptoms. Its prevalence is particularly high at the L5-S1 level, affecting 66.7% of men and 70.9% of women, second only to L4-L5 [1]. When conservative treatment fails, interbody fusion represents an established surgical option [2]. Single-level DDD is often associated with disc height loss and reduced segmental lordosis (SL), which disrupts the natural elliptical distribution of lumbar lordosis (LL). This imbalance has been associated with compensatory hyperlordosis at adjacent levels and increased mechanical stress and may contribute to accelerated degeneration. It is frequently accompanied by reduced foraminal height (FH) and radicular pain [3].
The goals of interbody fusion are to restore both segmental and global lordosis, re-establish sagittal balance, and provide indirect foraminal decompression [4,5]. At the L5-S1 level, the anterior retroperitoneal approach offers specific advantages, including resection of the anterior longitudinal ligament and placement of wedge-shaped implants that enhance segmental correction, provide primary stability, and maximize graft surface area, all contributing to favorable fusion outcomes [6-8].
L5-S1 is a key level in sagittal alignment, contributing approximately 40% of total LL [9]. Correcting distal lordosis at this level is therefore critical to achieving a harmonious distribution of global LL. Moreover, the anterior approach is technically facilitated at this level by favorable vascular anatomy, as the aorto-iliac bifurcation is usually located more cranially. Radiological changes were evaluated after standalone L5-S1 anterior lumbar interbody fusion (ALIF), focusing on L4-S1 lordosis, L5-S1 SL, global lordosis defined as L1-S1 LL, lordosis distribution index (LDI), and FH.
The primary objective of this study was to examine the association between implant-related parameters and postoperative radiological outcomes following standalone L5-S1 ALIF. A secondary exploratory objective was to assess how closely postoperative lordosis at the L4-S1 and L5-S1 levels matched pelvic incidence (PI)-based theoretical alignment targets, which were used as a reference framework for sagittal alignment assessment and were derived from established proportional relationships between PI and LL.
Materials and methods
Study design
We conducted a monocentric retrospective observational radiological study. We included all patients operated on for single-level ALIF in the L5-S1 spine for DDD between January 1, 2017, and January 1, 2023.
Patient selection
Inclusion criteria were as follows: age >18 years, surgical indication for DDD, and treatment with single-level ALIF at the L5-S1 level. Exclusion criteria were as follows: L5-S1 hinge transition anomaly, presence of spondylolisthesis, pre-existing spinal instrumentation, double-stage arthrodesis, indication for multilevel surgical treatment, and absence of preoperative, postoperative, or follow-up EOS imaging.
Patients were identified retrospectively during the study period using standardized French CCAM (Classification Commune des Actes Médicaux) coding: LFCA005: anterior spinal osteosynthesis and/or arthrodesis without exploration of the canal contents, via laparotomy or lumbotomy; LFFA010: excision of a spinal disc herniation with osteosynthesis and/or arthrodesis, via laparotomy or lumbotomy; LFPA001: anterior osteotomy or complete discectomy for rigid spinal deformity, with arthrodesis and instrumental correction, involving one to three vertebrae, via laparotomy or lumbotomy. Because these codes are not indication-specific, all patients’ medical records and imaging studies were subsequently reviewed by the investigators to confirm the surgical indication and to exclude cases not meeting the predefined inclusion criteria, including multilevel procedures, deformity surgery, spondylolisthesis, or non-degenerative indications.
Surgical technique
All procedures were performed via a retroperitoneal approach by four senior spine surgeons. The main surgical steps were standardized, including patient positioning, approach, disc preparation, and fluoroscopic control. Under general anesthesia and after placement of an indwelling urinary catheter, patients were positioned supine in the Da Vinci (French) position, with the surgeon standing between the patient’s legs. Fluoroscopic localization of the L5-S1 level was first performed in the lateral view, and the surface projection of the L5-S1 disc space was marked on the skin. An anteroposterior fluoroscopic view was then obtained to confirm correct patient positioning and ensure pedicle symmetry. A vertical skin incision was made centered over the projected L5-S1 disc space.
Careful dissection was carried out to identify the linea alba. A right-sided paramedian incision was performed lateral to the linea alba to expose the rectus abdominis muscle and allow a right-sided retroperitoneal approach. Blunt and meticulous dissection was continued to identify the vascular plane, with mobilization of the vessels on either side of the L5-S1 disc space. Lateral fluoroscopy was used to confirm the correct operative level. After resection of the anterior longitudinal ligament, a complete discectomy was performed. The posterior longitudinal ligament was ruptured using an interbody distractor and a dilator, and subsequently resected using a Kerrison rongeur. The vertebral endplates were carefully prepared using curettes. Implant selection was not fully standardized and was based on intraoperative stability and press-fit assessment, according to surgeon preference and anatomical constraints. Final fluoroscopic controls were then performed to confirm proper implant centering and positioning (maximum endplate coverage).
Data collection
Demographic variables (sex, height, weight, BMI, age) and implant parameters (Figure 1) were retrieved from the electronic medical records.
Parameters of anterior lumbar interbody fusion implantsHeight (mm), depth (mm), and lordosis angle (°) (A). Radiological correlation of these parameters at the L5-S1 level on EOS imaging (B)
All patients underwent a preoperative as well as a postoperative EOS between two months and one year after surgery. EOS imaging was performed using a standardized biplanar low-dose acquisition system, providing simultaneous anteroposterior and lateral full-spine radiographs. All examinations were acquired with the patient in a relaxed standing position, barefoot, with knees fully extended and hands resting on the shoulders, in accordance with standard EOS acquisition protocols. On the anteroposterior and lateral views, the femoral heads were identified bilaterally to determine the bicoxofemoral axis, which served as the reference for pelvic measurements. The sacrum was visualized in its entirety, enabling accurate identification of the sacral endplate. Pelvic parameters were measured using established anatomical landmarks, including the center of the femoral heads, the midpoint of the sacral endplate, and the vertical reference line.
PI, pelvic tilt (PT), and sacral slope (SS) were calculated according to conventional definitions. Lumbar lordosis measurements were performed on the lateral view using the Cobb method: global lordosis was defined as the angle between the superior endplate of L1 and the superior endplate of S1 (L1-S1), distal lordosis as the angle between L4 and S1 (L4-S1), and segmental lordosis as the angle between the inferior endplate of L5 and the superior endplate of S1 (L5-S1). Sagittal vertical axis (SVA) was measured as the horizontal distance between the C7 plumb line and the posterior superior corner of S1. All measurements were performed using sterEOS software (EOS Imaging), which allows three-dimensional reconstruction and precise angular and linear assessment from biplanar radiographs.
Radiological measurements (Figures 2, 3) were carried out by a single blinded independent observer using sterEOS software: L1-S1, L4-S1, and L5-S1 lordosis (°), SVA (mm), PI (°), SS (°), PT (°), anterior disc height (ADH, mm), posterior disc height (PDH, mm), FH (mm), L5 lower endplate depth (mm), S1 upper endplate depth (mm), and distance between the anterior L5 endplate and the implant (mm). Interbody fusion was assessed on one-year postoperative CT imaging using the Bridwell fusion grading system (grade I-fused with remodelling and trabeculae present; grade II-graft intact, not fully remodelled and incorporated, but no lucency present; grade III-graft intact, potential lucency present at top and bottom of graft; grade IV-fusion absent with collapse/resorption of the graft) [10]. No inter- or intra-observer reliability assessment was performed.
Pelvic parameters and lumbar lordosis measurements on EOS lateral viewa: pelvic incidence (PI, °); b: pelvic tilt (PT, °); c: sacral slope (SS, °); d: L5-S1 lordosis (°); e: L4-S1 lordosis (°); f: L1-S1 lordosis (°)
Preoperative (A) and postoperative EOS measurements (B)Pelvic incidence (PI, °); pelvic tilt (PT, °); sacral slope (SS, °); L5-S1 lordosis (°); L4-S1 lordosis (°); L1-S1 lordosis (°)
Theoretical target lordosis (TTL) was determined for each patient based on preoperative PI. We introduced 'coverage rates' (CR), which represent the extent of intervertebral implant coverage in the anteroposterior plane. These CR values will be tested as positioning parameters in the correlation analyses. The following formulas were used: theoretical L1-S1 lordosis (°) = 0.54 x PI (°) + 32.56 [11]; theoretical L4-S1 lordosis (°) = 0.66 x L1-S1 lordosis (°) [12]; theoretical L5-S1 lordosis (°) = 0.4 x L1-S1 lordosis (°) [9]; LDI (%) = L4-S1 lordosis (°)/L1-S1 lordosis (°) [13,14]; CR = Implant depth (in mm)/L5 endplate depth (mm); corrected CR = (implant depth (mm) + cage distance from L5 anterior wall (mm))/L5 endplate depth (mm)
Statistical analysis
Statistical analysis was performed using R software. Data were expressed as means ± standard deviations (SD), or as numbers (percentages). Non-parametric statistical methods were used because the data did not follow a normal distribution. Therefore, t-tests, ANOVA, and chi-square tests were not applicable. Paired Wilcoxon tests were used for statistical analysis of preoperative and postoperative results and for comparisons with theoretical targets, to enhance test sensitivity. Correlation analyses were performed using Spearman's rank correlation coefficients. Comparisons of results in PI subgroups were performed using Kruskal-Wallis and Fisher’s exact tests. P-values < 0.05 were considered significant. Analyses were performed on a complete-case basis. Comparisons with pelvic incidence-based theoretical lordosis targets were performed for descriptive and exploratory purposes only, as these targets are model-derived reference values rather than observed paired measurements.
Results
All in all, 407 patients were screened, of whom 137 underwent a single-level L5-S1 ALIF. Because of missing EOS data in 68 patients, a total of 69 patients were ultimately included in the analysis (Figure 4).
Flow chart depicting patient selection from initial recruitment to final analysisCCAM: Classification Commune des Actes Médicaux (French coding); OLIF: oblique lateral interbody fusion; ALIF: anterior lumbar interbody fusion; TLIF: transforaminal lumbar interbody fusion
The mean age of the cohort was 46.7 years (range: 29-75 years), with a sex ratio of 46F/23M, and a mean BMI of 27.9 kg/m2 (range: 18.8-37.8 kg/m2). The implant anterior height averaged 14.42 mm (range: 12-18 mm), implant lordosis averaged 14.55° (range: 10-20°), and implant depth averaged 28.38 mm (range: 26-34 mm) (Table 1).
Radiological results
We found a significant (p < 0.05) increase in PI of 3.51° ± 3.86°, SS of 4.06° ± 5.00°, ADH of 8.71 mm ± 3.33 mm, PDH of 4.15 mm ± 2.06 mm, FH of 3.25 mm ± 2.07 mm, L1-S1 lordosis of 4.67° ± 6.47°, L4-S1 lordosis of 7.10° ± 5.97°, L5-S1 lordosis of 9.01° ± 5.58°, and LDI of 8% ± 6.9% (Table 2, Figure 5).
Changes in LDI for each patient between pre- and post-opLDI <50% corresponds to malalignment with hypo-lordosis of the caudal segment. LDI between 50% and 80% is considered satisfactory alignment. LDI >80% corresponds to malalignment with hyperlordosis of the caudal segmentLDI: lordosis distribution index
The main hypothesis was tested using paired Wilcoxon tests and value distribution: postoperative L5-S1 lordosis was greater than TTL (p = 0.00027), postoperative L4-S1 lordosis was not statistically different from TTL (p = 0.7378), and postoperative L1-S1 lordosis was lower than TTL (p = 0.0176) (Table 3, Figure 6).
Preoperative and postoperative deviations from TTL at L5-S1, L4-S1, and L1-S1This figure displays box plots illustrating the difference (Δ) between measured lordosis and the TTL at the L5-S1, L4-S1, and L1-S1 levels, both preoperatively and postoperatively. Negative values reflect undercorrection relative to TTL, whereas positive values reflect overcorrection. Δ was calculated as measured lordosis minus TTL, with TTL derived from pelvic incidence-based formulas. The figure highlights the magnitude of correction achieved at each level and shows a progressive decrease in correction efficiency at more proximal lumbar segmentsTTL: theoretical target lordosis
Interbody fusion was evaluated on postoperative CT scans using the modified Bridwell fusion grading system [10]. Among the 69 patients, 37 (54%) achieved Grade I fusion, and 24 (35%) achieved Grade II fusion, resulting in an overall satisfactory fusion rate of 88%. Grade III fusion was observed in seven patients (10%), and one patient (1%) demonstrated Grade IV nonunion.
Correlation analyses
We looked for a correlation between implant parameters (IAH, implant lordosis, and implant depth) and positioning parameters (CR, corrected CR, and the distance from the L5 anterior wall) with postoperative results (L1-S1, L4-S1, and L5-S1 lordosis, LDI, and FH), as well as their postoperative to preoperative and postoperative to theoretical lordosis differentials (Figure 7).
Box plots illustrating the distribution of implant parameters (anterior height, depth, and implant lordosis) in relation to postoperative–preoperative lordosis differentials at each studied spinal level (L5-S1, L4-S1, L1-S1)Boxplots illustrating the relationship between implant parameters and postoperative changes in lordosis: Δ L5-S1 lordosis (top row), Δ L4-S1 lordosis (middle row), and Δ L1-S1 lordosis (bottom row). Columns represent implant lordosis (°), implant depth (mm), and anterior implant height (mm). Sample sizes for each subgroup are indicated above the boxplots. The dashed horizontal line represents no change (Δ = 0°)
The associations found were as follows: IAH and Δ postoperative-preoperative L4-S1 lordosis (ρ = 0.256, p = 0.034); IAH and Δ postoperative-preoperative LDI (ρ = 0.362, p = 0.002); IAH and postoperative FH (ρ = 0.309, p = 0.0099); corrected CR and Δ postoperative-preoperative FH (ρ = 0.291, p = 0.015)
In our population, greater implant anterior height (IAH) was associated with a larger postoperative-preoperative difference in L4-S1 lordosis, LDI, and postoperative FH. Additionally, greater cage depth and more posterior implant positioning were linked to larger postoperative-preoperative differences in FH. No other correlation tests showed statistically significant results (Figure 8).
Box-plots illustrating the distribution of implant parameters (anterior height, depth, and cage lordosis) in relation to postoperative-theoretical lordosis differentials at each studied spinal level (L5-S1, L4-S1, L1-S1)Boxplots illustrating postoperative deviation from the theoretical target lordosis (Δ postoperative – TTL) at three levels: L5-S1 (top row), L4-S1 (middle row), and L1-S1 (bottom row). Columns correspond to implant characteristics: implant lordosis (°), implant depth (mm), and implant anterior height (mm). Sample sizes for each implant subgroup are displayed above the boxplots. The horizontal dashed line represents perfect alignment with the theoretical target (Δ = 0°). Values above the line indicate overcorrection, while values below indicate undercorrectionTTL: theoretical target lordosis
Analysis of radiological results by PI subgroups
The mean preoperative PI was 47.46° ± 9.71° (Table 2). The three subgroups of preoperative PI (PI < 45°: 24 patients, PI 45-60°: 37 patients, and PI > 60°: eight patients) were comparable in terms of patient and implant characteristics (Table 4). We found significant differences between the subgroups for L1-S1 lordosis, PI, PT, SS, and LDI both in preoperative and postoperative measurements (Table 5).
Postoperative-theoretical differentials were statistically significant only for L4-S1 and L5-S1 (Table 5). The only significant postoperative-preoperative difference observed was in PI (Table 6).
We found that preoperative pelvic incidence was inversely correlated with postoperative LDI (p < 0.001 ρ: -0.435 IC [-0.609; -0.221]). Higher pelvic incidence was associated with lower postoperative LDI values in our population (Figure 9).
Association between preoperative PI and postoperative LDIScatterplot illustrating the association between preoperative PI (°) and postoperative LDI, with each point representing an individual patient. The dashed line represents the linear regression fit. The correlation coefficient and corresponding p-value (r = -0.44; p = 0.00019) are displayed in the upper right cornerPI: pelvic incidence; LDI: lordosis distribution index
Discussion
The main goals of this study were to explore radiological changes after standalone L5-S1 ALIF and to examine associations between implant parameters and postoperative sagittal alignment. Using a pelvic incidence-based reference framework, we secondarily assessed how postoperative L4-S1 lordosis compared to theoretical alignment targets derived from established proportional relationships between pelvic incidence and lumbar lordosis. These targets were used as a descriptive reference rather than validated surgical endpoints. While similar alignment-focused ALIF studies have been previously reported with different conceptual approaches, the present analysis provides an additional perspective by contextualizing postoperative alignment within a PI-based proportional framework. This series also represents one of the largest cohorts of standalone L5-S1 ALIF procedures for degenerative disc disease with detailed sagittal alignment assessment.
Our findings support the corrective potential of standalone L5-S1 ALIF for sagittal alignment. Significant improvements were observed at multiple levels: L5-S1 lordosis increased by +9.0°, L4-S1 lordosis matched closely with the TTL (+7.1°), and L1-S1 lordosis showed a more moderate gain (+4.7°). Lumbar lordosis distribution improved, with an increase in the LDI, while FH also increased, supporting the efficacy of ALIF in achieving indirect foraminal decompression. However, correction efficiency declined at higher lumbar levels, likely reflecting reduced hyperextension compensation proximally. Although these lordosis gains reached statistical significance, their magnitude should be interpreted cautiously, taking into account the inherent measurement variability of sagittal alignment parameters and the fact that statistically significant changes do not necessarily translate into clinically meaningful differences. These comparisons should be interpreted with caution, as PI-based theoretical targets are derived from population-based proportional models. The present analysis specifically examined postoperative L4-S1 lordosis in the context of theoretical caudal alignment, intending to describe lordosis distribution patterns in patients with degenerative disc disease at the lumbosacral junction. Such restoration of a harmonious lordosis profile may be of interest, as it has been associated with a lower risk of subsequent mechanical complications in previous studies [14-16].
Comparison with previous studies highlights both similarities and differences. Formica et al. reported moderate increases in L1 to S1 and segmental lordosis, together with indirect foraminal decompression, although the correction remained below the implant’s intrinsic lordosis, which is consistent with our findings [8]. Lee DY and Marouby et al. observed SL gains of 7.8° and 4.8° with 12° and 10° implants, respectively [17,18], while Siepe et al. noted significant SL correction but a slight decrease in overall lumbar lordosis [19]. Kapustka et al. demonstrated increases in both foraminal height and L1 to S1 lordosis with anteriorly elevated implants [20]. Similarly, Afathi et al. showed that lordosis gains were mostly limited to the lower lumbar levels, without a major impact on L1 to S1 [21].
The present study found a moderate association between anterior implant height (IAH) and L4 S1 correction, postoperative LDI, and foraminal height. Corrected CR was also associated with FH variation, whereas implant lordosis showed no significant association with postoperative alignment, even though the lowest implant lordosis used was still 10°. These associations should be interpreted as exploratory and do not imply causality, as the heterogeneity of implant designs may represent an additional source of uncontrolled confounding. These findings contrast with the predictive model proposed by Ahlquist et al., which incorporated implant lordosis as a determinant of postoperative SL [6].
In line with our results, Wu et al. reported that implant position along the anteroposterior axis, rather than implant lordosis, influenced segmental and disc height correction [22]. Zavras et al. further stressed the importance of implant positioning, showing that anterior placement in ALIF increased the risk of cage subsidence [23]. Likewise, Issa et al. demonstrated that anterior positioning of LLIF cages was more effective for SL correction, whereas posterior placement favored posterior disc height restoration, again without a consistent correlation between implant lordosis and sagittal correction [24]. Collectively, these findings suggest that implant positioning and height play a more decisive role than implant angulation in sagittal restoration.
Exploratory PI subgroup analysis revealed significant differences in L1-S1 lordosis, but not at the distal levels, suggesting that PI primarily influences proximal lumbar lordosis (L1-L4), as found by Pesenti et al. [25]. However, these subgroup findings should be interpreted with caution, particularly for patients with high PI, as the small sample size in this subgroup limits statistical power and precludes definitive conclusions. An inverse correlation was observed between preoperative PI and postoperative LDI, highlighting the difficulty of restoring harmonious sagittal alignment in extreme PI cases. Specifically, patients with low PI are at risk of overcorrection at L5-S1, whereas those with high PI may remain undercorrected. Based on these observations, implants with lower anterior height may be preferable in low-PI patients to avoid excessive distal lordosis, while higher IAH may be beneficial in high-PI patients to optimize sagittal alignment.
We also observed a postoperative increase in PI, which may reflect sacroiliac joint remodeling, although these differences remain minimal and may be partly attributable to measurement variability. Lee et al. previously described PI increases in patients undergoing long fusions, including the sacrum [26]. Similar mechanisms may explain the occurrence of sacroiliac joint pain following isolated L5-S1 ALIF [27]. This observation deserves further investigation, as it may influence both implant selection and patient counseling.
The present results should be interpreted in light of several limitations. The retrospective, single-center design carries inherent risks of selection bias and limits the generalizability of the findings. Although the sample size is relatively large compared with previous series, it remains modest and may lack sufficient statistical power to detect subtle associations. The analysis was purely radiological and did not include clinical outcomes. The absence of a control group prevents comparisons with other fusion techniques or with posterior instrumentation and therefore precludes technique-specific or causal inferences. Further prospective studies integrating clinical endpoints are required to confirm both the long-term durability of these radiological findings and their clinical relevance. All radiological measurements were performed by a single blinded observer, and the absence of inter- and intra-observer reproducibility testing may have introduced measurement bias. This limitation could be addressed in future studies by involving multiple blinded observers and evaluating reproducibility to enhance the reliability of the measurements.
In addition, follow-up was heterogeneous and relatively short, which precluded the evaluation of long-term durability. Standardized and longer follow-up would be required to more accurately assess the maintenance of sagittal correction and fusion over time. Finally, although EOS imaging offers important advantages, including low radiation exposure and acquisition in a standing position with parallel X-rays that reduce image distortion compared with conventional radiographs, it may still underestimate small segmental variations compared with CT, which remains the gold standard for precise angular measurements. Patients without preoperative or postoperative standing EOS imaging were excluded from the analysis, potentially introducing selection bias, as this subgroup may not be fully representative of the overall population undergoing standalone L5-S1 ALIF.
Several different implant designs were used in this study, including integrated cage-and-plate systems that allow direct continuity with the anterior vertebral wall, as well as zero-profile implants that enable deeper seating to enhance press-fit stability. This heterogeneity represents a limitation because implant characteristics were not fully standardized and may have introduced uncontrolled confounding, thereby reducing the internal validity of the correlation analyses. Implant type was not included as an adjustment variable, and no stratified or multivariable analyses were performed. Consequently, the observed associations between implant parameters and radiological outcomes may be partially influenced by unmeasured implant-related characteristics, limiting internal validity and precluding causal interpretation.
Despite these limitations, this study has important strengths. It focused exclusively on a homogeneous cohort of patients undergoing standalone L5-S1 ALIF for DDD, excluding those with transitional anomalies, spondylolisthesis, or prior instrumentation, thereby reducing potential confounding factors. All patients were evaluated with standardized EOS imaging in the standing position with hands on the shoulders, as well as CT scans, using consistent radiological parameters to ensure reproducibility. These exploratory findings may provide a basis for future research and guide surgical decision-making regarding implant parameter selection in standalone L5-S1 ALIF. However, further prospective studies that incorporate clinical outcomes and standardized implant selection are needed to optimize surgical planning and confirm the clinical relevance of these associations.
Conclusions
In patients with single-level degenerative disc disease, standalone L5-S1 ALIF was associated with improvements in caudal, segmental, and global lumbar lordosis, as well as with restoration of lumbar lordosis distribution and indirect foraminal decompression. Postoperative L4-S1 lordosis approached PI-based theoretical alignment targets, which were used in this study as a descriptive reference framework rather than as validated surgical endpoints. Exploratory analyses indicated that implant-related parameters were associated with postoperative radiological outcomes. In particular, anterior implant height appeared to be the implant parameter most consistently associated with L4-S1 lordosis correction, lordosis distribution, and FH, whereas implant lordosis itself was not linked to postoperative sagittal alignment. These findings should be interpreted in the context of the retrospective and observational design and do not imply causality. Further prospective studies incorporating clinical outcomes and standardized implant selection are needed to more clearly define the role of implant parameters in optimizing sagittal alignment after standalone L5-S1 ALIF.
The reference list from the paper itself. Each links out to its DOI / PubMed record.
- 1Prevalence and distribution of intervertebral disc degeneration over the entire spine in a population-based cohort: the Wakayama Spine Study Osteoarthritis Cartilage Teraguchi M Yoshimura N Hashizume H 1041102220142423994310.1016/j.joca.2013.10.019 · doi ↗ · pubmed ↗
- 2Lumbar spine fusion for chronic low back pain due to degenerative disc disease: a systematic review Spine (Phila Pa 1976) Phillips FM Slosar PJ Youssef JA Andersson G Papatheofanis F 02238201310.1097/BRS.0b 013e 3182877 f 1123334400 · doi ↗ · pubmed ↗
- 3Compensatory mechanisms contributing to keep the sagittal balance of the spine Eur Spine J Barrey C Roussouly P Le Huec JC D'Acunzi G Perrin G 04122201310.1007/s 00586-013-3030-z PMC 383002624052406 · doi ↗ · pubmed ↗
- 4Indirect foraminal decompression after anterior lumbar interbody fusion: a prospective radiographic study using a new pedicle-to-pedicle technique Spine J Rao PJ Maharaj MM Phan K Lakshan Abeygunasekara M Mobbs RJ 8178241520152554301110.1016/j.spinee.2014.12.019 · doi ↗ · pubmed ↗
- 5Global alignment and proportion (GAP) score: development and validation of a new method of analyzing spinopelvic alignment to predict mechanical complications after adult spinal deformity surgery J Bone Joint Surg Am Yilgor C Sogunmez N Boissiere L 166116729920172897643110.2106/JBJS.16.01594 · doi ↗ · pubmed ↗
- 6Does approach matter? A comparative radiographic analysis of spinopelvic parameters in single-level lumbar fusion Spine J Ahlquist S Park HY Gatto J Shamie AN Park DY 199920081820182963106110.1016/j.spinee.2018.03.014 · doi ↗ · pubmed ↗
- 7Sagittal alignment after lumbar interbody fusion: comparing anterior, lateral, and transforaminal approaches J Spinal Disord Tech Watkins RG 4th Hanna R Chang D Watkins RG 3rd 2532562720142351164110.1097/BSD.0b 013e 31828 a 8447 · doi ↗ · pubmed ↗
- 8ALIF in the correction of spinal sagittal misalignment. A systematic review of literature Eur Spine J Formica M Quarto E Zanirato A Mosconi L Lontaro-Baracchini M Alessio-Mazzola M Felli L 50623020213293084310.1007/s 00586-020-06598-y · doi ↗ · pubmed ↗