Development and initial validation of the Communication Inventory Disability – Observer Reported (CID-OR): a measure of communication in CDKL5 deficiency disorder
Jenny Downs, Jessica Keeley, Peter Jacoby, Sofia Benson-Goldberg, Sarah Pillar, Andrea Miele, Helen Leonard, Jacinta Saldaris, Eric D. Marsh, Tim A. Benke, Scott T. Demarest

TL;DR
This paper introduces a new communication assessment tool for CDKL5 deficiency disorder, which is more reliable than existing measures and could help track treatment effectiveness.
Contribution
The CID-OR is a novel communication measure specifically developed for CDKL5 deficiency disorder with strong psychometric properties.
Findings
CID-OR demonstrated high test-retest reliability (ICC 0.966) and satisfactory internal consistency.
CID-OR scores showed less right skewness compared to existing measures like the CSBS-DP ITC.
The CID-OR has potential to assess communication responsiveness in CDD and similar conditions.
Abstract
CDKL5 Deficiency Disorder (CDD) is a rare neurodevelopmental disorder characterised by early onset seizures combined with complex healthcare needs and developmental impairment that influence functional domains including communication. Communication is a high priority domain for families but currently used measures demonstrate floor effects. Emerging disease-modifying trials necessitate the precise and granular measurement of communication to determine drug efficacy. This study evaluated a new measure of communication for CDD called the Communication Inventory Disability – Observer Reported (CID-OR). CID-OR was developed using a communication framework for CDD created from qualitative data and informed through evaluation of current measures and consultation with clinical experts. Scores for items describing communicative purpose were derived from ratings of consistency and the mode of…
Genes, proteins, chemicals, diseases, species, mutations and cell lines named across the full text — each resolved to its canonical identifier and authoritative record.
Click any figure to enlarge with its caption.
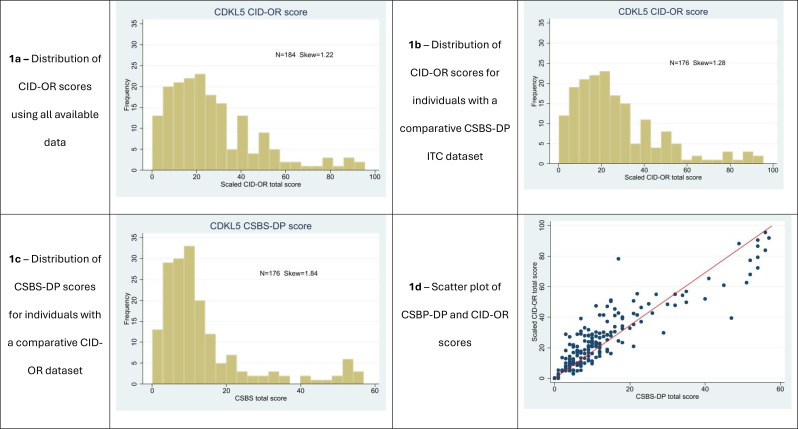 Figure 1
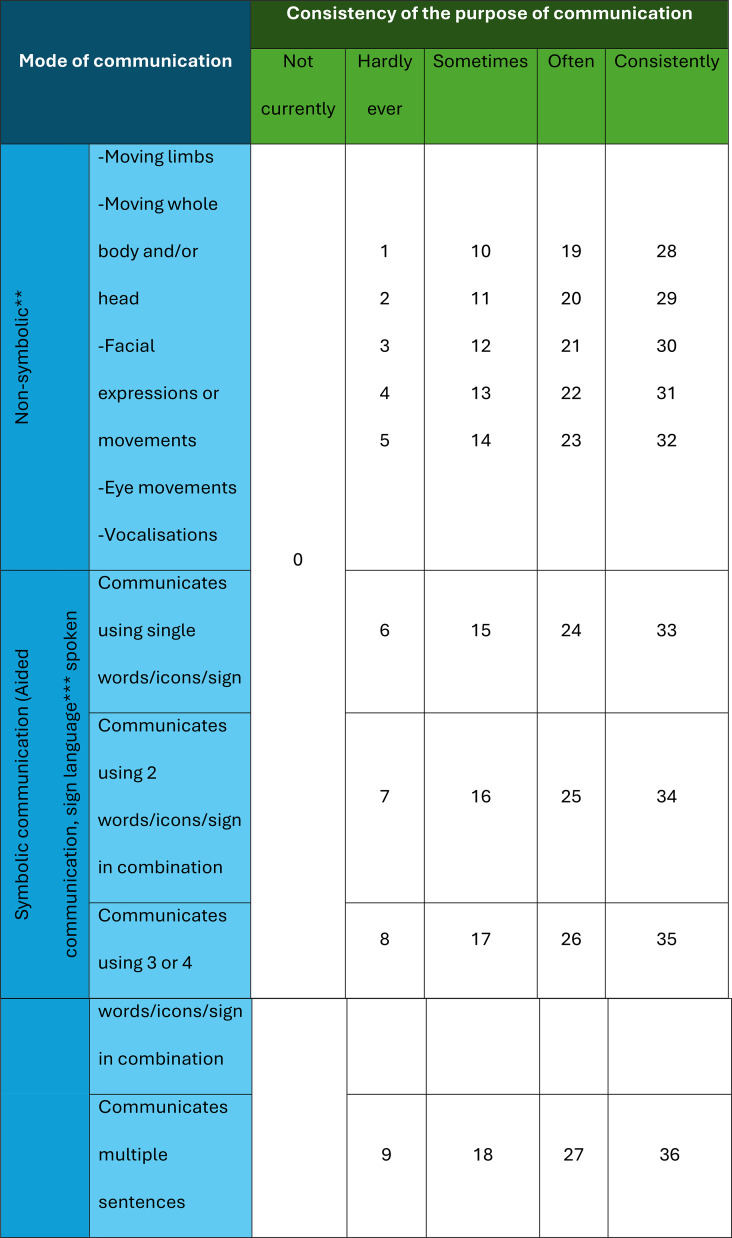 Figure 2
- —International Foundation for CDKL5 Research
- —National Institute of Health
- —http://dx.doi.org/10.13039/501100020265Stan Perron Charitable Foundation
Peer Reviews
No public reviews on file for this paper yet. If you reviewed it on a platform where reviews are public (OpenReview, ICLR, NeurIPS, ICML), you can paste yours below so the community can read it here.
Videos
No videos yet. Explain this paper in a talk, walkthrough, or lecture? Add one.
Taxonomy
TopicsGenetics and Neurodevelopmental Disorders · Attention Deficit Hyperactivity Disorder · Epilepsy research and treatment
Background
CDKL5 deficiency disorder (CDD) is a rare Developmental and Epileptic Encephalopathy (DEE) caused by a genetic variant in CDKL5 [1]. Symptoms include early onset epilepsy, global developmental delay, and other impacts on functioning and health such as cortical visual impairment, poor sleep, and gastrointestinal disturbances [1]. Individuals require daily care to support activities of daily living and complex health needs.
Each of the core functional domains of motor and cognitive skills, communication, and feeding are severely impacted. For example, approximately 33% are unable to sit, 75% unable to walk, and approximately 80% cannot use spoken words [2]. Approximately 25% are fed enterally [3]. In addition to achieving better seizure control, caregivers prioritize treatments that will address these developmental impairments, as even small improvements are anticipated to greatly improve quality of life for both individuals with CDD and their caregivers [4].
Communication has been expressed as a specific priority domain for families of people with CDD [4, 5]. However, the ability to directly measure the effectiveness of interventions on communication is limited by the challenges of accurate assessment in individuals with significant levels of intellectual disability [6]. Parent-report and direct clinical assessments of communication in very young children with developmental disorders or who were typically developing have been found to be generally consistent [7]. Valid parent-report measures of communication that are appropriate for the measurement of early communication skills in individuals with significant disabilities will have essential roles in documenting communication. Such measures can be used to evaluate the impacts of interventions and inform clinical decisions.
In a systematic review, 16 parent-report communication measures used in rare disease observational studies and clinical trials were identified where the Vineland Adaptive Behavior Scale was most frequently used [8]. Incomplete validation data in rare disease patient groups were found for six of the measures [8], although the Observer Reported Communication Assessment (ORCA) has comprehensive validation data for Angelman syndrome [9] and Rett syndrome [10] where functional impairments are generally less severe than CDD. Due to its ability to measure very early communication skills [11], we previously evaluated the validity and reliability of the Communication and Symbolic Behavior Scales - Developmental Profile Infant Toddler Checklist (CSBS–DP ITC) for CDD [12]. There were already existing validation data for the CSBS in some DEE conditions [e.g., 13], as well as report of responsiveness to change in a clinical trial evaluating trofinetide for Rett syndrome [14]. In CDD (n = 150), we found that goodness of fit and internal consistency statistics were strong, scores varied as expected by biological sex [i.e., lower score for males without mosaicism who typically experience more severe impairments than females; 1] and other functional abilities, and test-retest reliability was good [15]. On the other hand, the distribution of scores was right skewed where 58% of items were rated as 0 and the proportion of items rated 0 increased to 75% in people who could not walk, use spoken words or were gastrostomy fed [15]. The floor effect suggested inadequate granularity to capture methods of communication that are used by people with severe impairments, and that the CSBS may not be sensitive to change over time.
We subsequently undertook a concept elicitation study with 23 parents who have a child with CDD to explore their child’s communication [16]. Parents identified multiple non-symbolic and symbolic communication modes that their child used to express meaning, including communication of preferences, emotions, and social engagement with others [16]. Despite severely impaired communication, the data still illustrated richness and complexity [16], revealing that the individual useds skills that are not measured comprehensively in other communication tools [12]. Based on this qualitative framework and prompted by review of the literature [8], we constructed a new measure of communication for people with severe functional impairments. This paper presents the development and initial validation of the Communication Inventory Disability – Observer Reported (CID-OR) measure for people with CDD.
Methods
This study was approved by the Internal Review Board at University of Colorado COMIRB 19-2756, with reliance agreements at each clinical site, and University of Western Australia (RA/4/20/6198). The International CDKL5 Clinical Research Network (ICCRN) is registered with ClinicalTrials.gov (NCT0555837).
Development
The concepts and content validity of CID-OR were established through rigorous qualitative processes, as we have done previously [17–19]. Full details of the content validity of for CID-OR is published separately [20] but is summarized below for context.
This research was guided the following key principles: (1) receptive and expressive communication skills are intertwined and can be observed simultaneously [16], (2) communication is an expression of purpose through modes to form the communicative act and can be intentional [or non-intentional when the partner interpreted it as meaningful; 21, 22, 23], (3) communication partners need to understand meaning communicated through multiple non-symbolic and symbolic modes [16], and (4) symbolic language can be conveyed using words, signs, and alternative and augmentative communication (AAC) methods [16].
We created a framework from categories within the qualitative data and illustrated by quotes [16]. These categories were reviewed against concepts in existing communication measures, including the CSBS-DP ITC [12], the Communication Matrix [24], and the Vineland Adaptive Behavior Scales 3rd Edition [Vineland-3, communication domain; 25]. A suite of items was developed based on our qualitative data [16] but consistent with items in other measures. Where a concept from our communication framework was inconsistent with items in existing measures, unique items (n = 13/35, 37%) were created.
When completing CID-OR, parents were asked to report observable behaviours from the past 30 days. Each item is accompanied by examples able to be observed in people with less or more communication impairment [20]. First, each item evaluates the consistency of communication for a specific purpose (not currently, hardly ever, sometimes, often, consistently). This five-point scale reflects narratives provided in the initial qualitative dataset [16] and is consistent with clinical observations. Second, each mode of communication for that purpose is reported, including 5 groups of non-symbolic modes (moving limbs, moving whole body, facial expressions, eye movements, and vocalisations), and 4 levels of symbolic communication (single words/signs, 2 words in combination, 3 or 4 words in combination, or multiple sentences expressed in either spoken words, sign language, or using an AAC device). See Table 1.
Table 1. Table showing the bands of item scores for each level of consistency reported for each item** Individuals receive a score from a band of scores according to the consistency of the communication of the item. When the individual does not currently exhibit an item, they receive a score of zero. Individuals using non-symbolic communication modes only are given the sum of non-symbolic communication modes reported up to 5. Individuals who communicate symbolically are automatically awarded 5 points for non-symbolic communication with the item score determined by the complexity of symbolic communication. The maximum item score is 36 and the maximum scale score is 1224. The total score is then scaled to a score out of 100** 1 point for each mode used and summed*** Automatic 5 points for non-symbolic communication when symbolic communication used
The initial draft questionnaire comprised 35 items. Content validity was assessed by interviewing 21 parents/caregivers of children with CDD (17 females, median [range] age 15 [2–31] years) recruited from the International CDKL5 Disorder Database (ICCD) using ‘think aloud’ methodology to review clarity, comprehensiveness, and relevance of the items and measure [26, 27]. The measure was presented to six speech and language pathologists for feedback.
Scoring
Scoring combines observations on the consistency of the communication purpose and the mode of communication for each item, prioritising purpose over mode (Table 1). For each item, the response about consistency of purpose places the score for that item into a consistency band. Points are assigned according to the mode(s) of communication employed within each band. People with non-symbolic communication are given one point for each of the 5 non-symbolic modes employed. People who use symbolic communication are automatically credited with all non-symbolic communication skills and given a score ranging from 6 (e.g., using single words) to 9 (e.g., using multiple sentences) depending on use. The mode score is then added to the minimum score for each consistency band giving a total item score. The maximum possible item score is 36 for a person who consistently communicates a purpose using multiple sentences. Symbolic communication includes signs and use of an AAC device as well as spoken words. Equal weight is given to all three when scoring. Therefore, each combination of purpose and mode yields a unique score (Table 1). Seven allied health clinicians (speech and language pathology, neuropsychology) provided feedback on the clinical utility of the scoring system.
Validation
Data sources
The ICCRN, comprising the CDD Centers of Excellence (CoE) network [28] and the ICDD [3] were the data sources for this study. Informed consent was obtained from all parent participants who provided data to the study.
Parents who attended a CoE in the USA since January 2023 were invited to participate in longitudinal clinic evaluations and completion of parent-reported questionnaires to describe their child’s comorbidities, communication, and quality of life. Assessments are repeated at approximately 6-month intervals for two years to track trajectories. An optional assessment is scheduled one month after the 12-month assessment to enable evaluation of test-retest reliability, completed by a subset of CoE participants. The CID-OR measure was introduced into the questionnaire battery in March 2024. The first completed CID-OR measure and test-retest reliability data are presented in this study. Families who were registered with the ICDD living internationally or in the US (but had not attended a CoE clinic) were invited to complete CID-OR between January and November 2024, if they spoke fluent English and had previously provided family questionnaire data to the database.
All people were required to have a CDKL5 variant that was considered pathogenic or likely pathogenic. Data were collected and managed using the Research Electronic Data Capture (REDCap) electronic data capture tool hosted at Children’s Hospital Colorado and The Kids Research Institute Australia.
Variables
In addition to CID-OR data, we collected data to describe person’s age, sex, and functional abilities. Walking ability was classified as walking without assistance, walking with assistance, or being unable to walk. Feeding ability was classified as oral only, some oral and some enteral feeding, or all enteral feeding. To assess convergent validity, some families completed the CSBS–DP ITC at the same time. The CSBS–DP ITC is a 24-item parent-report questionnaire that gives a total possible score of 57 [11, 12].
Statistical analysis
The distribution of CID-OR scores and CSBS-DP ITC scores were compared visually in histograms, a scatterplot and using the skew statistic to assess any floor effects.
We applied Confirmatory Factor Analysis (CFA) to CID-OR responses using the lavaan package in R. The appropriate weighted least squares (WLS) estimator for items with ordinal levels was used. Factor loadings were calculated in addition to the following model fit statistics: Root Mean Square Error of Approximation (RMSEA), Standardized Root Mean Square Residual (SRMR), Comparative Fit Index (CFI), and Tucker-Lewis Index (TLI). These were compared with accepted thresholds [29]. Average Variance Extracted (AVE) was calculated. Discriminant validity of the multi-factor model domains was examined using the Fornell-Larcker criterion [30], i.e., by comparing AVE with the square of the maximum inter-domain correlation. Where necessary, the factor structure was re-organized, and items removed until satisfactory model statistics were achieved. Internal consistency was assessed using Cronbach’s Alpha.
The CID-OR questionnaire was completed on a second occasion after an interval of approximately 4 weeks, by a randomly selected subgroup (n = 26) of caregivers from the CoE group. Test-retest reliability for the total score was estimated using the Intraclass Correlation Coefficient (ICC). ICC values were interpreted as good (0.75–0.9) or excellent (> 0.9) reliability. Minimum Detectable Difference (MDD), that is the difference in score which can be said with confidence to be greater than measurement error, was calculated using the formula \documentclass[12pt]{minimal} \usepackage{amsmath} \usepackage{wasysym} \usepackage{amsfonts} \usepackage{amssymb} \usepackage{amsbsy} \usepackage{mathrsfs} \usepackage{upgreek} \setlength{\oddsidemargin}{-69pt} \begin{document}$$\:MDD=z\surd\:2SD\surd\:(1-ICC)$$\end{document} with values of \documentclass[12pt]{minimal} \usepackage{amsmath} \usepackage{wasysym} \usepackage{amsfonts} \usepackage{amssymb} \usepackage{amsbsy} \usepackage{mathrsfs} \usepackage{upgreek} \setlength{\oddsidemargin}{-69pt} \begin{document}$$\:z=1.96$$\end{document} for 95% confidence and \documentclass[12pt]{minimal} \usepackage{amsmath} \usepackage{wasysym} \usepackage{amsfonts} \usepackage{amssymb} \usepackage{amsbsy} \usepackage{mathrsfs} \usepackage{upgreek} \setlength{\oddsidemargin}{-69pt} \begin{document}$$\:z=1.64$$\end{document} for 90% confidence [31].
We used linear regression to evaluate differences between known groups, to test the hypotheses that males without mosaicism, gastrostomy tube users, and those who could not walk would have lower communication scores than females, those able to feed orally and walk (with or without assistance), respectively.
Convergent validity was assessed using the Pearson correlation coefficient by comparing CID-OR scores with single factor scores from the CSBS-DP ITC.
Results
There were 184 of 214 (86%) CID-OR questionnaires completed: 109 of 134 (81%) from the CoE dataset and 75 of 80 (94%) invited from the ICDD. There were no missing item data. The median (range) age for people with CDD was 9.8 (1–43) years. The majority were female (81.5%) as expected [32], 25% were able to walk independently and two thirds (63%) took all food orally. Characteristics of the participants and their communication scores are shown in Table 2.
Table 2. Characteristics of CID-OR questionnaire for all respondents and by data sourceParticipant characteristicsMedian (IQR; min-max) / n (%)All (n = 184)COE (N = 109)ICDD (N = 75)Age,** years9.8(5.1–17.1; 1.0-42.6)8.7(4.0-15.8; 1.0-42.6)13.8(6.8–18.2; 2.5–30.9) Age group 1–5 years45 (24.5)35 (32.1)10 (13.3) 5–10 years48 (26.1)28 (25.7)20 (26.7) 10–15 years28 (15.2)16 (14.7)12 (16.0) > 15 years63 (34.2)30 (27.5)33 (44.0)Sex, n (%)** Female150 (81.5)91 (83.5)59 (78.7) Male34 (18.5)18 (16.5)16 (21.3)Ability to walk (N = 175), n (%) Walks without assistance44 (25.1)25 (25.0)19 (25.3) Walks with assistance30 (17.1)16 (16.0)14 (18.7) Unable to walk101 (57.7)59 (59.0)42 (56.0)Feeding abilities,** n (%)** Oral only116 (63.0)67 (61.5)49 (65.3) Some or all feeding enterally**68 (37.0)42 (38.5)26 (34.7)**CID-OR score (**N **= 184)**22.5(12.4–38.2; 0.1–95.6)21.8(11.3–41.5; 0.1–95.6)23.4(12.9–32.2; 0.2–88.2)**CSBS score (**N = 176) 17.5(10.5–28.1; 0-100)17.6(10.5–31.6; 0-100)15.8(8.8–22.8; 1.8–91.2) Includes 10 males with identified mosaicism Maximum possible score of 57 scaled to maximum possible score of 100 for comparability with CID-OR scores 27 in the COE cohort were fully fed enterally, 14 in the ICDD cohort were fully fed enterally
Confirmatory factor analysis
Initially a 5-factor CFA model was examined based on initial conceptual grouping of items suggested in the qualitative study, consisting of the groups of items describing Demonstrating Preferences (6 items), Indicating Understanding (9 items), Expressing Emotions (9 items), Social Connections (6 items), and Two-Way Exchanges (5 items). Goodness of fit statistics were satisfactory, but the discriminant validity requirement was not satisfied due to very high inter-domain correlations. A single factor model was subsequently evaluated. This model performed well apart from a low factor loading (0.3) for one item (specific communication used with specific people). This item was removed resulting in the final single factor 34-item CID-OR questionnaire (Table 3).
Table 3CID-OR item factor loadings (n = 34 items). Summary of item content is presented in the CID-OR item content columnCID-OR itemFactor loading95% confidence intervalDoes your child1. Indicate preference for people/activities0.8400.805–0.8752. Indicate not wanting something0.7930.750–0.8353. Indicate wanting more of something0.8350.796–0.8744. Make choices between items0.8150.773–0.8575. Indicate yes/no to a question0.8030.758–0.8496. Let you know they need help0.7110.657–0.7647. Respond to their name0.7270.673–0.7808. Anticipate preferred activities0.8440.804–0.8859. Persist when not understood0.8090.769–0.85010. Follow one-step instructions0.8410.801–0.88111. Follow two-step instructions0.9430.906–0.98012. Recognise familiar objects/people0.7740.727–0.82113. Recognise familiar objects spontaneously0.7790.730–0.82914. Respond in expected way0.8300.777–0.88315. Describe things using actions/gestures0.9060.859–0.95316. Indicate when they are happy0.8300.792–0.86717. Indicate that they are excited0.8260.786–0.86618. Indicate that they are upset/sad0.7550.707–0.80319. Indicate that they are worried/scared0.8330.786–0.88120. Indicate that they are frustrated0.7320.679–0.78521. Indicate that they are angry0.7360.677–0.79522. Indicate that they are uncomfortable0.6120.552–0.67323. Indicate that they are in pain0.6030.536–0.66924. Indicate location of pain0.7920.735–0.85025. Try to get your attention0.8410.803–0.87926. Try to get you to notice objects0.8850.840–0.9327. Show/accept affection0.7420.693–0.79028. Do things to please you0.8730.826–0.92129. Play with others0.8510.806–0.89530. Greet you0.7880.735–0.84131. Make or imitate noises0.7640.709–0.81932. Respond to questions0.8790.833–0.92533. Give you information0.8970.807–0.98834. End an interaction0.6740.592–0.756
Fit statistics for the final model are shown in Table 4. The SRMR and TLI values were > 0.9 indicating good model fit. The RMSEA was higher than the recommended threshold. However, RMSEA is not recommended as a fit measure for use in models with a small sample size (n < 200) where the SRMR is considered a preferable indicator of model fit [33]. Average Variance Extracted (AVE) with the 34 items was 0.64 which is above the recommended minimum of 0.5. Cronbach’s alpha was 0.97 indicating excellent internal consistency of the scale.
Table 4. Fit statistics of the single factor CFA model with 34 itemsFit statisticObservedRecommended thresholdChi-square (degrees of freedom)1338.9 (527)Chi-square / df2.54< 3Root Mean Square Error of Approximation (RMSEA)0.092< 0.08Comparative Fit Index (CFI)0.97> 0.9Tucker-Lewis Index (TLI)0.96> 0.9Standardised Root Mean Square Residual (SRMR)0.065< 0.08 Hu L, Bentler PM. Cutoff criteria for fit indexes in covariance structure analysis: Conventional criteria versus new alternatives. Structural Equation Modeling: A Multidisciplinary Journal 1999;6:1–55
Distribution of scores
The median CID-OR score (n = 184) was 22.5 (skew 1.22, Fig. 1a), out of a total possible score of 100. No person scored 0 points. For the 176 participants who completed both communication questionnaires, the median CID-OR score was 22.2 (skew 1.28) and the median scaled CSBS-DP ITC score was 17.5 (skew 1.84). There was less right skew in the CID-OR score distribution than in the CSBS-DP score distribution (Fig. 1b, c). Three (1.7%) people scored 0 points on the CSBS-DP. The mean number of items scored as 0 was 45% for CID-OR compared with 63% for CSBS-DP. Items for the person indicating they are happy, showing affection, and indicating they did not want something had the highest median CID-OR item scores whilst items for following two-step instructions, describing things with actions or gestures, and giving information had the lowest median scores (Supplementary Table 1). Case studies derived from the dataset are presented to illustrate skills associated high and low scores, and variability by consistency of communication (Supplementary Table 2).
Fig. 1. Histograms and scatterplot showing distributions of CID-OR and CSBS-DP scores
Convergent validity
For the 176 people with CID-OR and CSBS-DP ITC data, scores were strongly positively correlated (r = 0.89). The scatter plot illustrates a greater range of CID-OR scores for low CSBS-DP ITC scores, suggesting that CID-OR reduced the floor effect of the CSBS-DP (Fig. 1d).
Known groups validity
Results of the known-groups validity analysis are presented in Table 5. As hypothesized, females had a higher mean CID-OR score than males (after removal of males with reported mosaicism) although this effect did not reach statistical significance. People who fed orally had significantly higher scores than people who were reliant on a gastrostomy tube for feeding and people unable to walk had significantly lower scores than people who could walk independently or with assistance.
Table 5. Known groups comparison of CID-OR scores by feeding ability, mobility and sex categoriesMean CID-OR score95% CIEffect size (95% CI)p-value Feeding Gastrostomy tube (N = 68)17.8614.40–21.3215.19 (9.38–21.01)P < 0.001Oral feeding(N = 116)33.0629.07–37.04**Mobility (**N **= 175)Unable to walk(N = 101)18.2014.94–21.46RefWalks with assistance(N = 30)27.9321.95–33.919.73 (2.92–16.54)P = 0.005No assistance needed(N = 44)48.6043.66–53.5330.40 (24.48–36.31)P < 0.001Sex (N = 172)Male (N = 22)21.0224.04–30.336.17 (-2.53–14.87)P = 0.16Female (N = 150)27.1929.07–37.04 12 males with reported mosaicism removed
Test-retest reliability and MDD
Test-retest reliability, calculated from repeat administration after a mean (SD) of 33.9 (7.1) days (n = 26 from the ICCRN dataset), was excellent with an ICC value of 0.966 (95%CI 0.925–0.984). The Minimum Detectable Difference (MDD) was calculated to be 10.53, corresponding to the CID-OR score change where there is 95% confidence that the change is greater than measurement error. MDD corresponding to 90% confidence was 8.81.
Discussion
Communication is a high priority domain for parents of children with CDD [4, 5]. We developed CID-OR to measure communication in CDD because available data suggested floor effects in existing parent-report measures [15]. Thus, the observable and practical communication skills that people living with a severe disability learn and use in their everyday life were not being measured. The development process involved mapping concepts from a rich qualitative dataset [16] against concepts in existing measures [12, 24, 25], and generating new items. We then used ‘think aloud’ for content validation and consultation with clinicians to further inform the structure and presentation of CID-OR. Initial validation provided good evidence of goodness of fit for a single domain, known groups validation, and test-retest reliability. Importantly, there was reduced right skew for CID-OR scores compared to scores derived from the CSBS-DP ITC.
CID-OR uses a novel questionnaire structure to measure communication behaviours [21] for individuals with severe communication impairments. In sum, receptive and expressive communication skills are demonstrated within the one item set, consistency of purpose and mode of communication are rated for each item, and equal weight is afforded to different modes of symbolic communication. The scoring then prioritises consistency of purpose over mode, based on parent and clinician feedback to measure functional communication. Bands of scores are applied to each level of consistency with higher scores for more complex symbolic modes of communication within each band. Each combination of purpose and mode has a unique score. The scoring of CID-OR credits symbolic communicators with the non-symbolic modes of communication. Preliminary analysis identified that the symbolic communicators were sometimes receiving low mode scores that did not reflect their more complex communication because parents were not recording the more subtle forms of communication (i.e., non-symbolic communication modes such as facial expressions, eye movements). The automatic application of non-symbolic communication modes to the score was included after a thorough review of scores and in consultation with healthcare professionals with extensive experience working with individuals with CDD and other DEE conditions within and outside the team.
To our knowledge, the structure of the CID-OR questions and scoring is unique although there are some commonalities with other parent-report communication measures. For example, CID-OR generates a single score consistent with the communication domain of the Developmental Profile 4th Edition [34], and the Observer Reported Communication Assessment developed for Angelman syndrome [9] and adapted for Rett syndrome [10]. However, the Vineland-3 communication subscale has additional scales for expressive, receptive, and written communication [25]. There are some commonalities with the Communication Matrix [24] where the purpose is to generate a profile; first classifying by different modes of symbolic communication and then coding the purpose as emerging or mastered and generating a map across different modes. However, we are not aware of any communication measure that privileges consistency of purpose over mode nor generates combined purpose and mode item and total scores.
After establishing a model of communication in CDD [16] and consulting with healthcare professionals [35], we evaluated CID-OR’s structural characteristics, construct validity, and test-retest validity [36]. Testing the themes derived from the qualitative data as domains in a confirmatory factor analysis resulted in poor discriminant validity. Rather, the model fitted well for a single domain, potentially indicating that communication is a complex interactive skill at every level of ability and that multiple skills are being acquired simultaneously as communication develops. For example, individuals with greater communication impairments demonstrated components of each of the qualitative themes but with lesser consistency or using less symbolic modes.
Initial evidence for reliability and validity indicates many future potential studies including evaluation of responsiveness to change, the determinants of communication in CDD, and relationships with the person’s quality of life and parent burden. We utilized case studies to illustrate variability across the spectrum of scores for six individuals in the dataset (Supplementary Table 2), including for individuals with similar scores but different communication profiles. Further evaluation is needed to determine if CID-OR could be a helpful clinical tool for tracking the ways that a person is communicating and for supporting parents, caregivers and educators to attune sensitively to their child’s unique communication methods. For an ultrarare disorder [37], our sample size is substantial and the individuals with CDD in this study were broadly similar to those in other studies [1]. Nevertheless, a larger sample size would be necessary for us to evaluate model fit using the RMSEA statistic [33]. The Cronbach’s alpha value was high which could reflect the relatively large number of items and suggest some redundancy. However, the items each indicate different acts of communication and after randomly splitting the items into 2 groups, the Cronbach’s alpha values were 0.944 and 0.942.
Conclusions
CDD is one of many DEE conditions with a known genetic cause [38] and the number of identified conditions will only increase with further advances in diagnostic technologies [38]. DEE conditions are defined phenotypically, and common features are well represented by CDD. Accordingly, we expect CID-OR to have broad applicability across multiple DEEs or other conditions with severe intellectual disability that share a similar phenotype. Establishing validation datasets of these similar disorders is an important next step. There is potential for the use of CID-OR in clinical trials.
Supplementary Information
Below is the link to the electronic supplementary material.
Supplementary Material 1
The reference list from the paper itself. Each links out to its DOI / PubMed record.
- 1Mangatt M, Wong K, Anderson B, Epstein A, Hodgetts S, Leonard H, Downs J (2016) Prevalence and onset of comorbidities in the CDKL 5 disorder differ from Rett syndrome. Orphanet J Rare Dis 1110.1186/s 13023-016-0418-y PMC 483256327080038 · doi ↗ · pubmed ↗
- 2Neul JL, Benke TA, Marsh ED, Suter B, Silveira L, Fu C, Peters SU, Percy AK (2023) Top caregiver concerns in Rett syndrome and related disorders: data from the US natural history study. J Neurodev Disord 1510.1186/s 11689-023-09502-z PMC 1057146437833681 · doi ↗ · pubmed ↗
- 3Keeley J, Saldaris J, Benson-Goldberg S, Lariviere J, Leonard H, Marsh ED, Demarest ST, Benke TA, Jacoby P, Downs J (2025) Content validation of the Communication Inventory Disability-Observer Reported (CID-OR). J Child Neurol 883073825136913810.1177/08830738251369138 PMC 1248424340900005 · doi ↗ · pubmed ↗
- 4Benke TA, Demarest S, Angione K, Downs J, Leonard H, Saldaris J, Marsh ED, Olson H, Haviland I (2024) CDKL 5 Deficiency Disorder. In Adam MP, Feldman J, Mirzaa GM, Pagon RA, Wallace SE, Amemiya A, editors. Gene Reviews®. Seattle (WA): University of Washington, Seattle 38603524 · pubmed ↗